MiViews Q4 2018: The end is not nigh
- Global growth remains firm despite the length of the current cycle. In the US, consumption is supportive while recession risk is low globally.
- However, inflation risk is rising as markets fail to fully reflect stronger wage growth and higher oil prices.
- We are defensive on government bonds but see value in breakevens and commodities. We are also broadly positive on equities in both developed and emerging markets.
Overview
This year should have marked a turning point. After the goldilocks period of strong growth last year, many expected central banks to tighten their grip over the world’s economy in response to rising inflation expectations. Such an environment is multi-asset funds’ worst enemy as it would likely hurt performance of both equity and bond markets. We got a taste of that in February – but that is all it was: the MSCI World index is now up by 2% year to date, while bond market returns are flat on the year.
The growth story continues while inflation expectations remain under control. Indeed, recession, not inflation, is now being mooted and the exceptional length of the current cycle raises questions as to how much longer it can continue. The US growth cycle has rumbled on for an extraordinary 112 months: is now the time to become more cautious?
We think not. In our view, recession risk is negligible, but inflation should continue to rise to levels slightly higher than expected. The macro picture remains favourable for growth and inflation assets. Sentiment remains broadly positive for equities globally: valuations are looking stretched in the case of developed market (DM) equities and more favourable in the case of emerging markets (EM). We remain overweight growth-related assets and cautious on selected domestic bond markets.
Is it the end of the cycle?
Several indicators point to the end of a cycle: growth has been positive and for a long period of time (✔), inflation pressures are rising both from the input price side (✔) and the wage side (half ✔), while commodity prices are rising as demand outpaces production (✔ for oil). From this perspective, it feels like we have reached the end of the cycle.
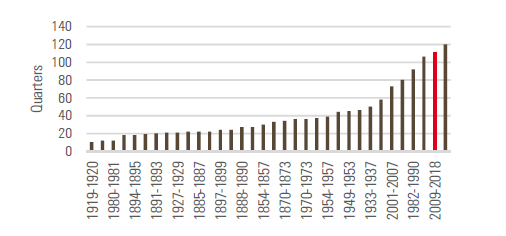
Figure 1 shows the duration of growth cycles in the US since 1854. The current cycle is 112 quarters old – 10 years roughly speaking – and is the second-longest cycle in US history. It stands eight quarters away from beating the cycle of the 90s, the longest cycle of all time that arose from the introduction of computers in firms. However, it is a big number that requires some contextualisation. The average growth cycle duration since WW2 has been twice as big as the period before (60 vs. 30 quarters previously): as an economy ages, recessions are becoming less and less frequent. Moreover, in addition to the indicators mentioned above (not all of them being fully ticked), two other indicators can be used to predict the threat and neither of them are a source of concern.
Figure 1: Ranked growth cycle durations in the US in quarters
The shape of the yield curve is one such indicator. This typically upward-sloping curve – illustrating the difference between long and short-term rates – has had a tendency to flatten before past recessions and invert (slope downwards) as it starts. Longer-term yields fall below shorter-term ones in anticipation of the central bank lowering rates in the future. As Bauer and Mertens from the US Federal Reserve (Fed) put it[1]: “Every US recession in the past 60 years was preceded by a negative term spread, that is, an inverted yield curve. Furthermore, a negative term spread was always followed by an economic slowdown and, except for one time, by a recession”.
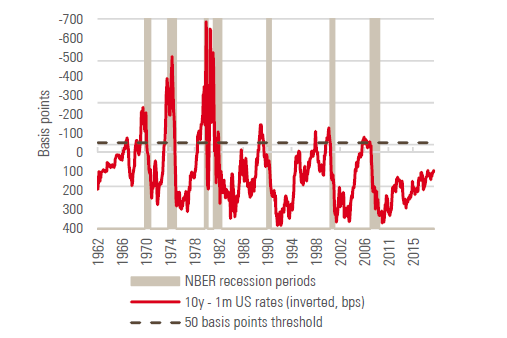
Figure 2 shows the recent evolution of the 1-month to 10-year rate spread in the US as a proxy for a yield curve recession indicator. It illustrates how the spread would need to tighten by 125 basis points (bps) for recession to be of real concern. Over the next 24 months, a 75 bps increase in the Fed’s target rate is expected. Without any reaction from the 10-year yield, an additional 50 bps tightening would be necessary to anticipate a recession within the following two years. No red light here.
Figure 2: One month to 10-year US yield curve slope vs. recession periods
Our Nowcasters corroborate this view. These proprietary indicators gauge recession risk across a broad array of countries with a focus on recessionary symptoms. In 2017, global growth was synchronised. However, since early 2018, economic activity has slowed in an heterogenous way with the US holding up firmly while China and Europe recorded softer economic performance. Today, the crucial question is how country growth will re-converge. Will the rest of the world re-accelerate and catch up with the US or will the US converge with the rest of the world?
Likely a bit of both: In the US, growth will continue to be supported by firm household consumption, offsetting weaker investment. China’s central government has implemented stimulus policies, explaining recent improvement in its housing market. The Eurozone outlook is more uncertain: consumption remains firm but investment is clearly lagging and the political situation remains uncertain. Figure 3 illustrates the broader point: when looking at the components of our growth Nowcasters, the cycle is clearly being supported mainly by consumption and residential investment – a far cry from recessionary conditions.
Figure 3a: World growth Nowcasters
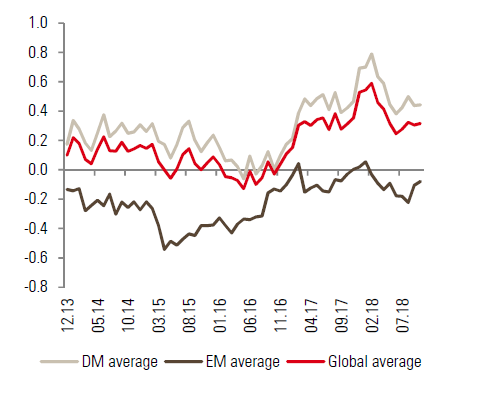
Figure 3b: Breakdown of Unigestion country-level growth Nowcasters by components
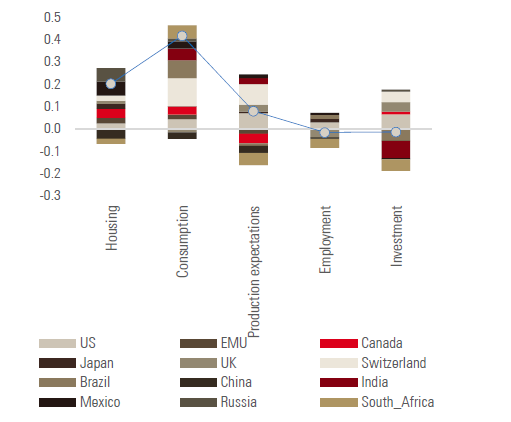
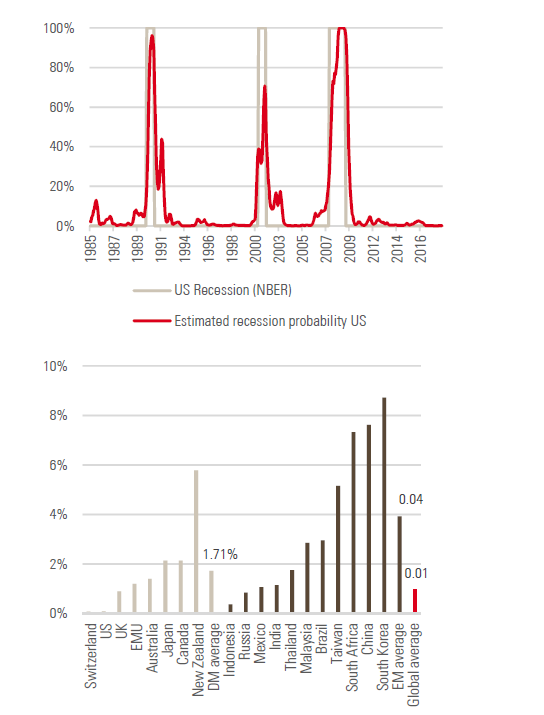
Figure 4 shows the results of turning those indicators into recession probabilities. In the case of the US (and consistent with the New York Fed’s recession probability numbers), this number is sub 1% for the time being: the cycle is old but it appears to be alive and kicking, supported by strong consumption momentum. We note that the probabilities for the DM world ex-US are higher, reflecting the much-commented slowing economic momentum that started to appear at the beginning of 2018. However, in aggregate, recession risk remains limited (below 5% on average) and is highest in case of New Zealand (while remaining contained).
EM economies look somewhat less resilient without being a source of genuine concern. On average, the estimated probability of recession is around 4%, with South Africa, China and South Korea lagging. Despite the obvious difference between the US and the rest of the world, from the perspective of our indicators, EM-related risk looks negligable over the next 12 months.
Figure 4: Estimated recession probabilities from the Unigestion growth Nowcasters in the US (top, time series) and across all countries (bottom)
With high growth comes higher inflation
The real sign of the end of a cycle is a burst of inflation: when the growth rate of consumer prices is not only expected to be high but also above what has been expected in the past. These ‘inflation surprises’ are a significant macro risk to markets. What we have seen so far has been the mere normalisation of a period of subdued inflation pressures arising for various reasons – be it the slower EM growth situation than the period 2005–2007, the low commodity price environment or slow wage growth in Europe. However, since the end of last year, we have been calling for a cautious stance on inflation-sensitive assets, government bonds ranking first among them. Rates have been edging higher this year and the key challenge now is to understand to what extent this move can continue.
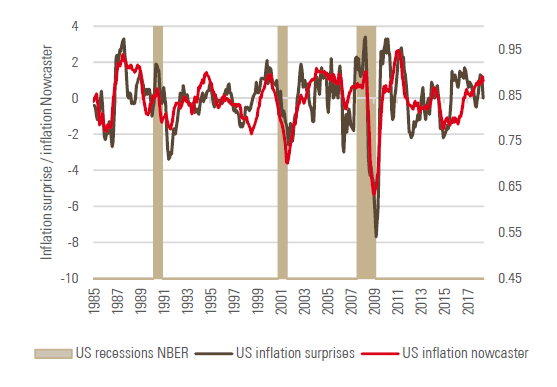
There are several ways of looking at inflation pressures, but the way we think about it is by looking at all the major potential sources for inflation surprises. Our domestic inflation Nowcasters have been designed to measure these on a daily basis. Figure 5 shows the output of our inflation Nowcaster against actual inflation surprises in US. It clearly indicates that inflation surprise risk has been increasing since the end of summer 2016, reaching a level that is consistent with a 1% potential surprise increase in inflation.
The year-on-year change in the Consumer Price Index (CPI) in the US is currently about 2.7%. If such a surprise happened, this number would reach a level slightly below 4%. That is definitely not on the cards for financial markets. Most market observers and private forecasters[1] expect inflation to remain around 2.2% in the US in 2019 while the IMF holds it at 2.4%. Our view on US CPI is that the current industry forecasts are too low and we expect this inflation number to settle around 2.5% as higher oil prices surprise to the upside. Medical care costs are not growing as fast as in the past (around 1.3%), but with strong US growth, the price of shelter should at least stay where is it now, if not increase (currently also around 1.3%).
Figure 5: US inflation Nowcaster vs. inflation surprises
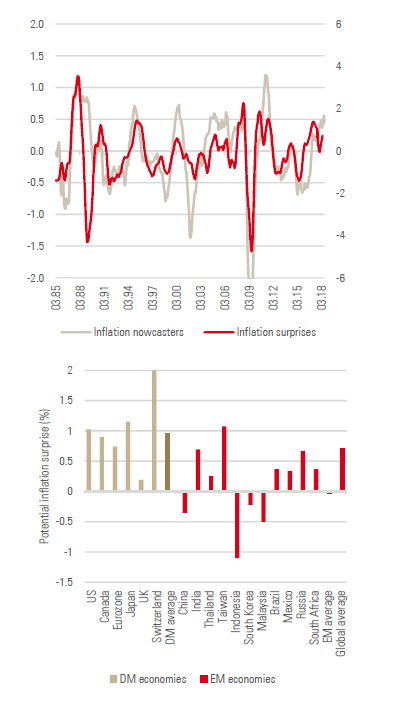
Markets are not underestimating US inflation alone. Figure 6 shows our world composite inflation Nowcasters versus inflation surprises in the OECD. It also provides country-by-country granularity, showing the extent of the inflation situation in both DM and EM economies. Clearly, the risk across the DM world is that inflation continues to surprise to the upside: from a potential inflation surprise of about 2% in Switzerland to a potential of 20 basis points in the UK. These numbers can look small, but what is important is the pricing of inflation across markets.
Figure 6: OECD inflation surprises vs. world inflation Nowcaster (top) and potential inflation surprises derived from the domestic inflation Nowcasters (bottom)
A game of expectations
Understanding where expectations stand is a crucial part of investing. Only by comparing the macro situation to market expectations is it possible to devise an active risk management process: both sentiment and valuation dimensions are key here.
One of our main calls for 2018 was that the inflation premium across markets would be considerably revalued, as reflation became inflation. Earlier this year, markets proved us right as bond prices poorly reflected inflation risk. Are valuations now in a better position? We do not think so: rates increased throughout the year but for the wrong reason. Of the 67 bps of increase in 10-year rates, only 16 of them actually reflect an increase in the inflation premium as of the end of September.
Figure 7 further illustrates this point: up until June, breakeven rates were following the evolution of oil, but since then a disconnect has appeared. Oil prices have increased by an additional 10 dollars per barrel without breakevens moving. This disconnect is not new: rates have overall had a lower beta than usual to inflation risk over the past two years. Figure 7b provides estimates for this phenomenon: in 2017 and 2018, the sensitivity of US rates to a basket of assets positively related to inflation has not only diminished but has literally been next to zero.
Our call for cautiousness regarding government bonds remains: recession is not the enemy for now, inflation is. We see 3.2% as a target for 2018 for the US 10-year yield and 0.6% for the German Bund. While these levels are not far from where they stand today, we also see potential for market over-reaction. As growth will continue to support core inflation, we continue to expect rates to reach higher levels.
Figure 7a: US 10-year rate vs. US 10-year breakeven rate
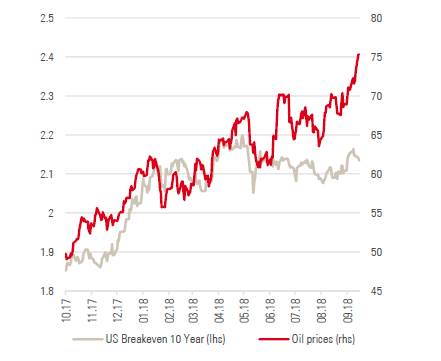
Figure 7b: Beta of US rates to Unigestion’s four macro factors
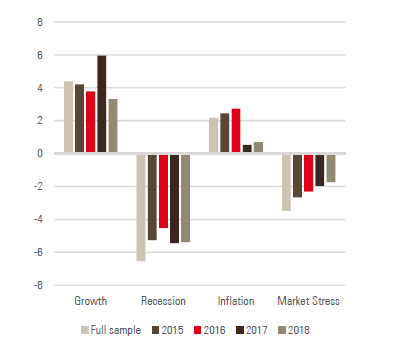
The case for growth-related assets calls for greater discrimination. If we continue to see investment grade and high yield bonds as potentially at risk given the inflation risk, the case of equities is more of a mixed bag, and one where combining macro analysis with valuation/sentiment makes more sense. As illustrated in Figure 8, in light of this year’s volatility, overall equity exposure across various market participants has moved from short (HFRX Macro and CTAs) to long for L/S equities. Growth remains on the side of equity investors but the valuation of equities is becoming an increasing concern.
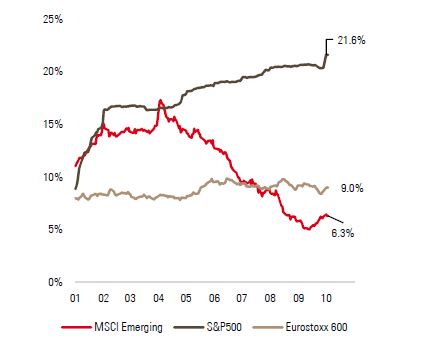
As further illustrated in Figure 8, analysts are now expecting 21% earnings growth across S&P 500 companies, explaining the 11.5% year-to-date total return of the index. But geography is important here. Earnings growth expectations for the Eurostoxx 600 is just 9%, while EM equities (measured by the MSCI Emerging Markets index) have seen their earnings growth revised downwards considerably from a 17% high over Q1 to 6% today. What this number says is that analysts are now expecting barely any nominal growth on average from the emerging world. We currently remain on the defensive side when it comes to European assets, as we still see the Italian situation as a significant problem: Italy currently grows around its potential growth rate but its political issues are a considerable risk to anything tied to the Eurozone.
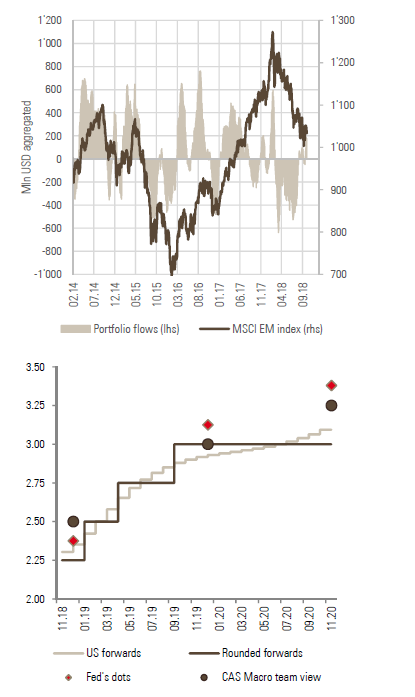
When it comes to EM assets, our outlook has recently changed marginally. Our Nowcasters point to slowed activity, currently stabilizing if not improving – this is the macro situation. As shown in Figure 8, expectations are now a lot more in line with this macro assessment – this is the sentiment part. What is more, when investigating portfolio flows towards EM assets (Figure 9), the situation has changed considerably over the past six months. Earlier this year, portfolio flows turned significantly negative on concerns over a trade war and several idiosyncratic risks, such as the Chinese housing market slowdown and the Brazilian political situation. Over the summer, this broad-based act of defiance on EM assets came to an end and part of the recent rally can be explained by positive flows. We had a negative stance on EM equities earlier this year, but we are now more constructive towards them.
Figure 8a: Hedge fund beta to equities
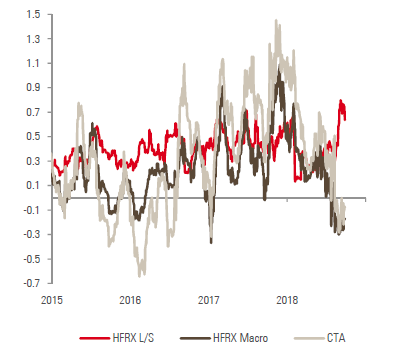
Figure 8b: Revisions to the analysts’ expected earnings growth
This overall positive vision of the investment world for selected growth-related assets does not come without risks. Beyond the collection of previously mentioned idiosyncratic risks, one of the biggest risks that we foresee for the coming quarters is monetary policy. Market expectations for future Fed policy decisions have not yet converged towards the Fed’s now famous ‘dots’, its expectations for its own monetary policy.
As presented in Figure 9, the Fed predicts two hikes more than what markets are expecting by the end of 2020. From the moment the Fed started hiking after the 2015 Chinese slowdown, the market started converging towards the Fed’s projection. The gap that remains, combined with the European Central Bank’s (ECB) reluctance to normalise its monetary policy, could be the source of an unpleasant return of episodes of market stress across markets, especially if higher inflation materialises. We expect markets to converge further towards the Fed’s dots, with one more hike this year and two more next year. We also expect the ECB to stop its quantitative easing programme by the end of 2018 and to normalise the negative rates situation next year. We see this risk as significant and remain particularly vigilant on this point.
Figure 9: Daily portfolio flows towards EM assets (top) and the Fed’s dots vs. markets expectations (bottom)
Conclusion
We continue see the world growing at a reasonable pace – with limited recession risk across the major economies – but with inflation that could be marginally higher than expected. Yet again, markets are not prepared for this higher inflation environment and accommodative central bank policy creates an additional risk overlay to this scenario. In our opinion, the main risk lies with government bonds, which will be the most affected by a repricing of the inflation premium. Dynamically, we therefore retain a substantial underweight in the asset class, implemented using a number of options strategies.
In addition, we see value in inflation-tracking assets, such as inflation breakevens and commodities. On a more positive note, we still see value in equities overall and this time not only in developed markets. We remain convinced that the investment environment is changing at a faster pace than last year. Consequently, at a time when long-only, diversified solutions are suffering from increasing dispersion in performance, the need to be ever more dynamic is increasing. We rest assured that our investment philosophy is well equipped to take advantage of such a market environment.
[1] Bauer, M. D., & Mertens, T. M. (2018). Economic Forecasts with the Yield Curve. FRBSF Economic Letter, 7.
Important information
Past performance is no guide to the future, the value of investments can fall as well as rise, there is no guarantee that your initial investment will be returned.
This document has been prepared for your information only and must not be distributed, published, reproduced or disclosed by recipients to any other person.
This is a promotional statement of our investment philosophy and services only in relation to the subject matter of this presentation. It constitutes neither investment advice nor recommendation. This document represents no offer, solicitation or suggestion of suitability to subscribe in the investment vehicles it refers to. Please contact your professional adviser/consultant before making an investment decision.
Where possible we aim to disclose the material risks pertinent to this document, and as such these should be noted on the individual document pages. A complete list of all the applicable risks can be found in the Fund prospectus.
Some of the investment strategies described or alluded to herein may be construed as high risk and not readily realisable investments, which may experience substantial and sudden losses including total loss of investment. These are not suitable for all types of investors. To the extent that this report contains statements about the future, such statements are forward-looking and subject to a number of risks and uncertainties, including, but not limited to, the impact of competitive products, market acceptance risks and other risks. As such, forward looking statements should not be relied upon for future returns.
Data and graphical information herein are for information only and may have been derived from third party sources. Unigestion takes reasonable steps to verify, but does not guarantee, the accuracy and completeness of this information. As a result, no representation or warranty, expressed or implied, is or will be made by Unigestion in this respect and no responsibility or liability is or will be accepted. All information provided here is subject to change without notice. It should only be considered current as of the date of publication without regard to the date on which you may access the information. Rates of exchange may cause the value of investments to go up or down. An investment with Unigestion, like all investments, contains risks, including total loss for the investor.
Unigestion UK Limited SEC registered. Authorised and regulated by the UK Financial Conduct Authority. Unigestion SA authorised and regulated by the Swiss FINMA. Unigestion Asset Management (France) S.A. authorised and regulated by the French Autorité des Marchés Financiers. Unigestion Asia Pte Limited autorised and regulated by the Monetary Authority of Singapore.