COVID-19: How Unigestion’s Risk-Managed Equity Strategies are Positioned During This Black Swan Event and Period Of Market Turmoil
COVID-19: How Unigestion’s Risk-Managed Equity Strategies are Positioned During This Black Swan Event and Period Of Market Turmoild
- After initially hitting China and Asia, market implications of the Coronavirus have rapidly become global.
- Our risk-managed global equities strategy has held up well, with outperformance helped by both country and sector allocations.
- While the many unknowns makes it difficult to quantify the economic implications of the virus, historically, epidemics have proved to be buying opportunities for equity investors – though risks to the downside should not be taken lightly.
Overview
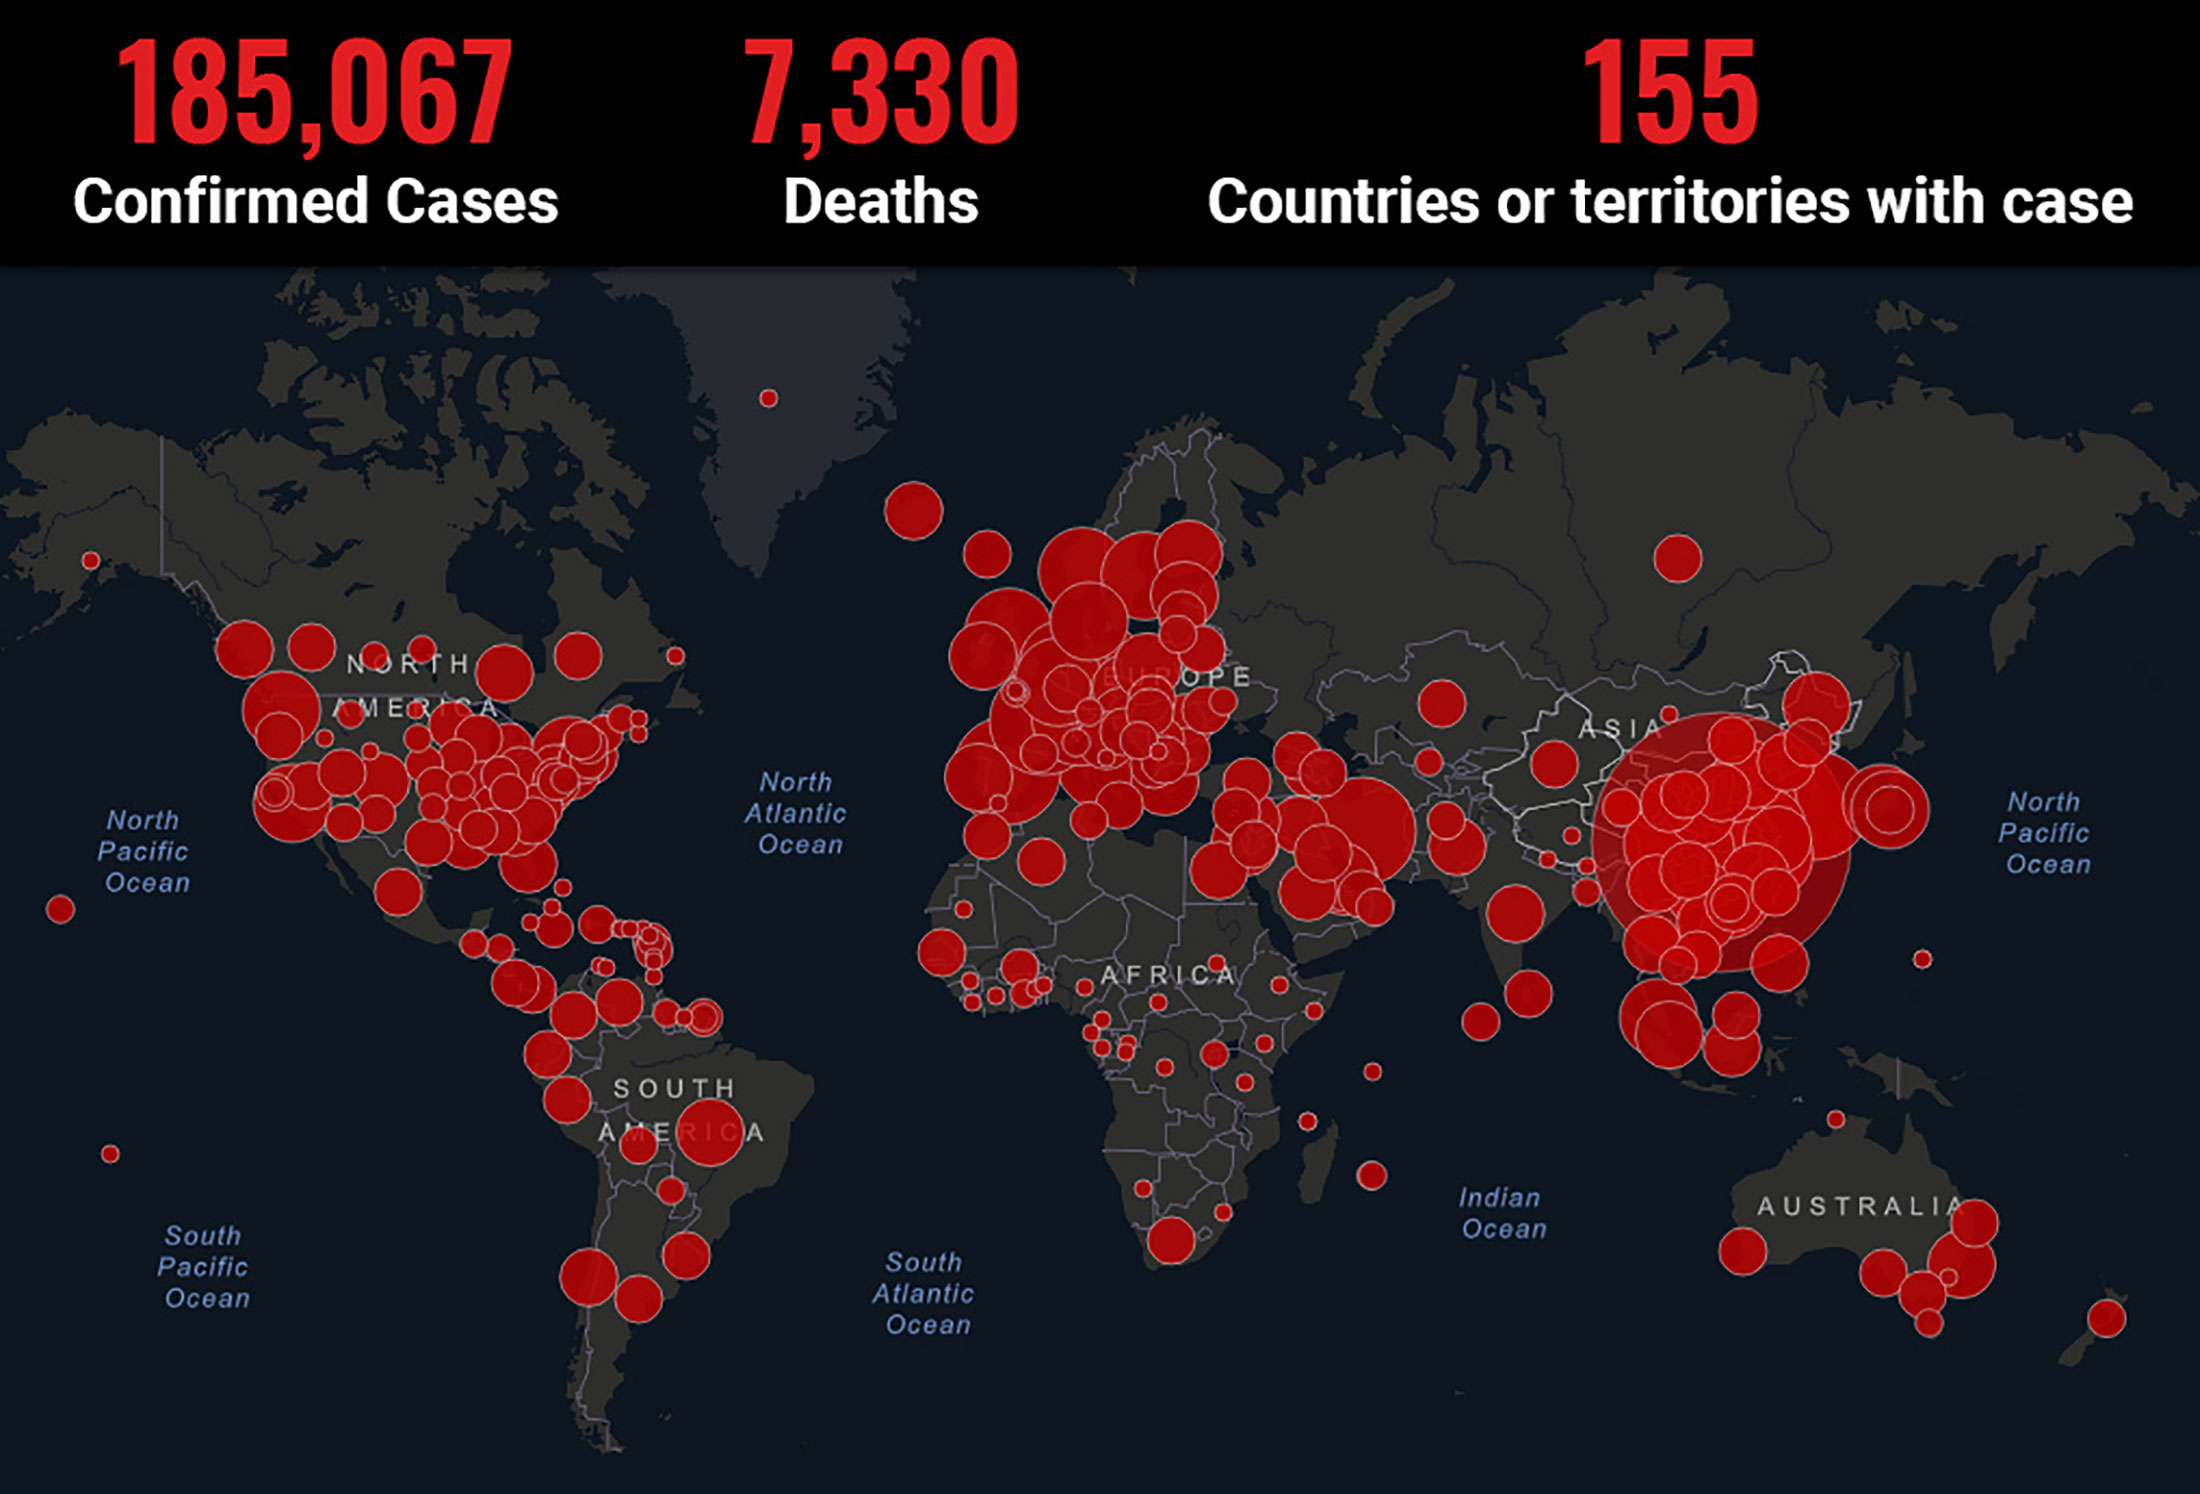
On January 30, 2020, the International Health Regulations Emergency Committee of the World Health Organization declared the outbreak of the Novel Coronavirus (COVID-19) a “public health emergency of international concern”. As we write, over 81,000 people in China have been infected with the virus, with a further 104,000 cases elsewhere. 155 countries/regions have now been affected.
Figure 1: Distribution of COVID-19 as of 17 March 2020
In this paper, we discuss the positioning of our risk-managed equity strategies, assess the performance since the emergence of the virus and outline what we believe the immediate future may hold.
Market Implications of the Coronavirus
In addition to the humanitarian toll, which has been immense, the COVID-19 outbreak has had significant market implications for global markets and beyond.
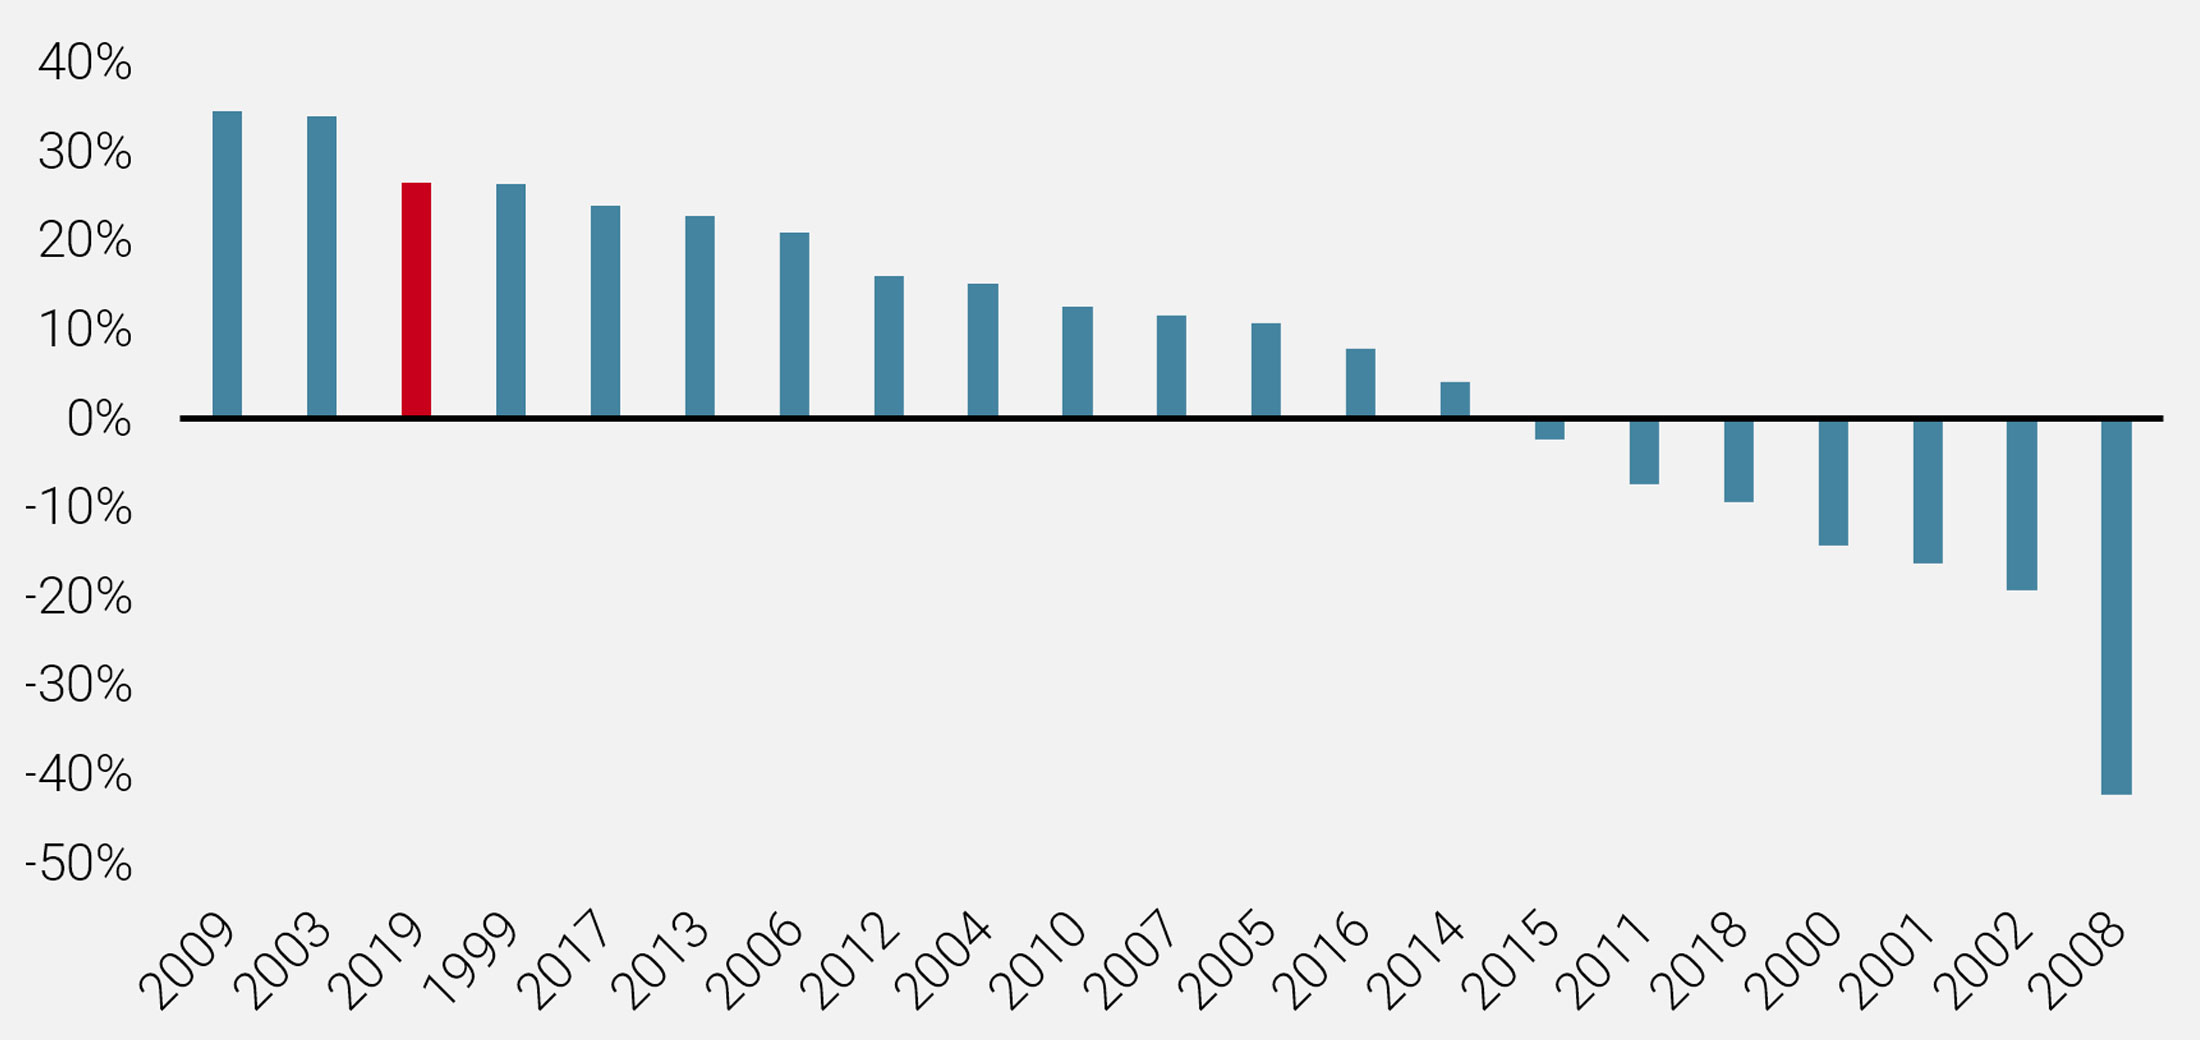
In retrospect, 2019 was one of the strongest years for many equity markets over the past 20 years, as shown in Figure 2, with solid performance and little in the way of volatility. In addition to an extremely bullish environment, the year 2019 also exhibited extreme style dispersion.
Figure 2: Calendar Performance of the MSCI AC World TR Net USD since 2000

Central bank action helped markets in 2019.

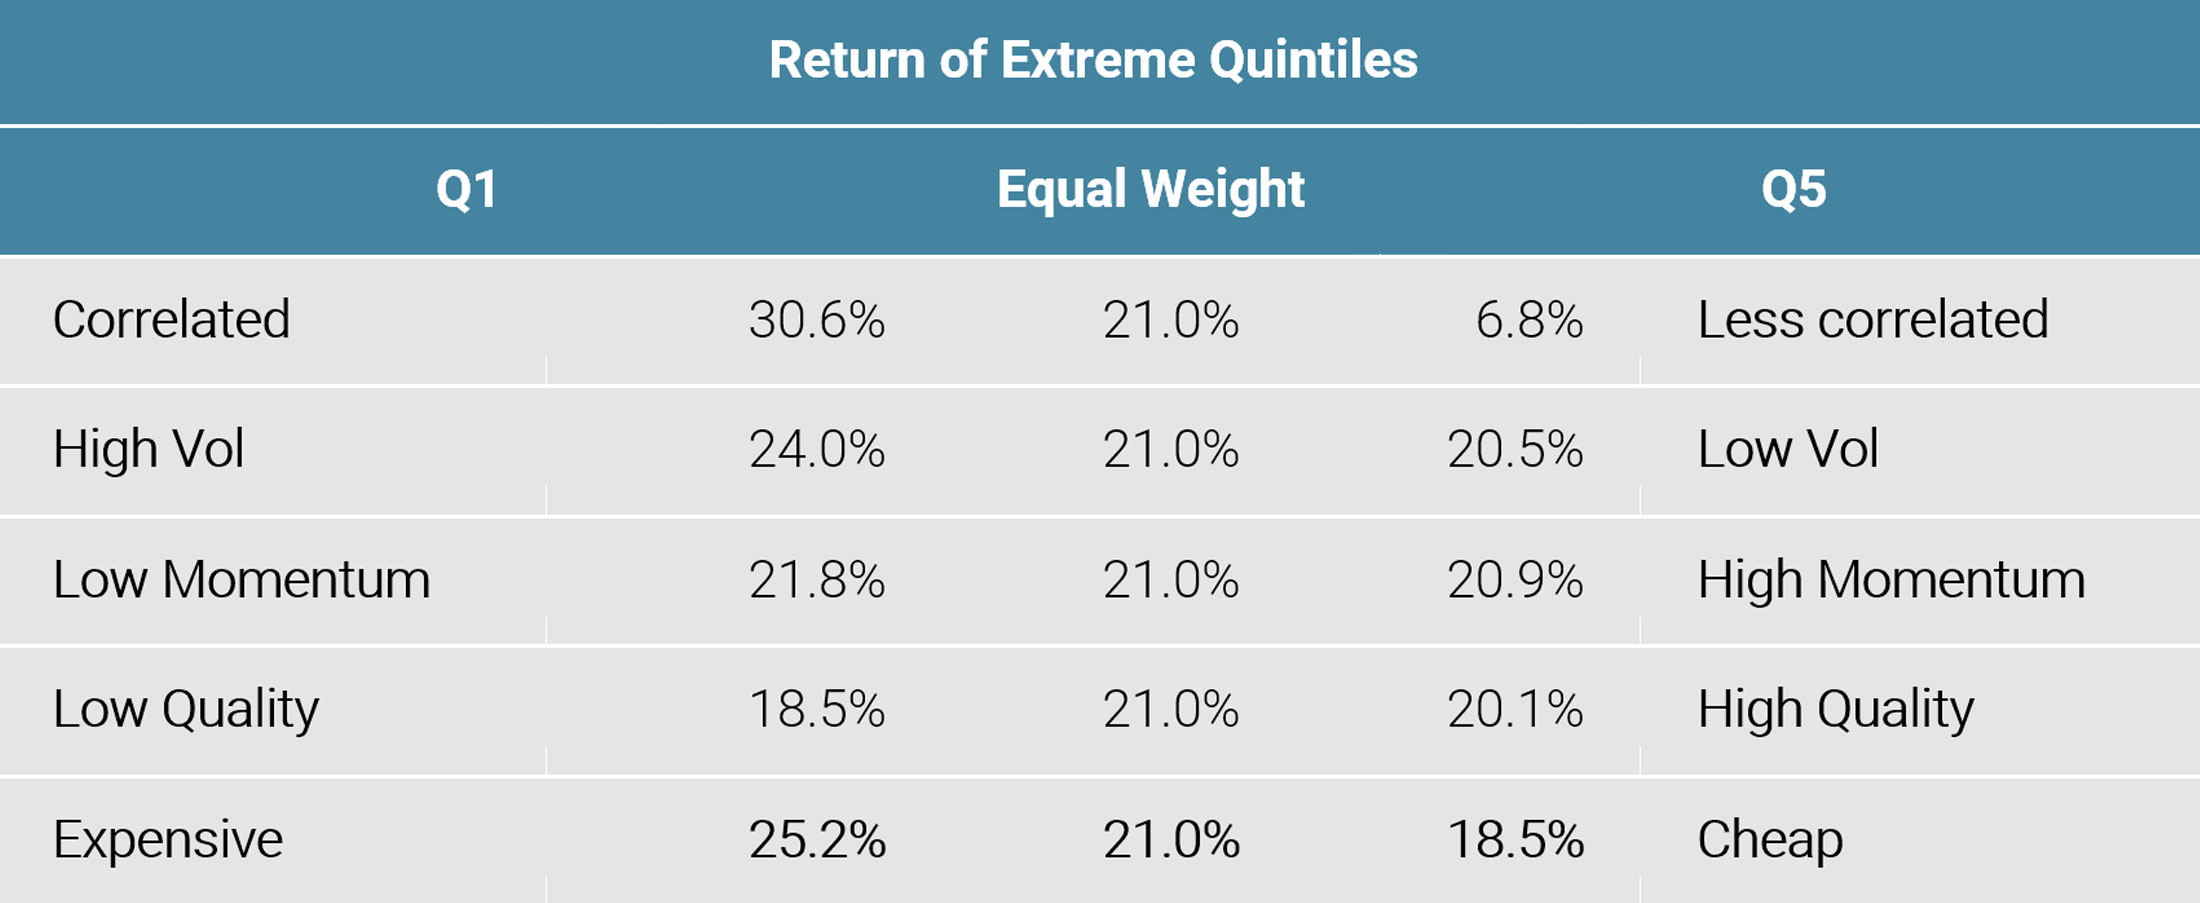
The dovish stance from central banks across the globe drove the performance of risky assets and gave an advantage to the riskiest stocks, irrespective of their valuation (Figure 3).
Figure 3: Returns of Extreme Style Quintiles in 2019
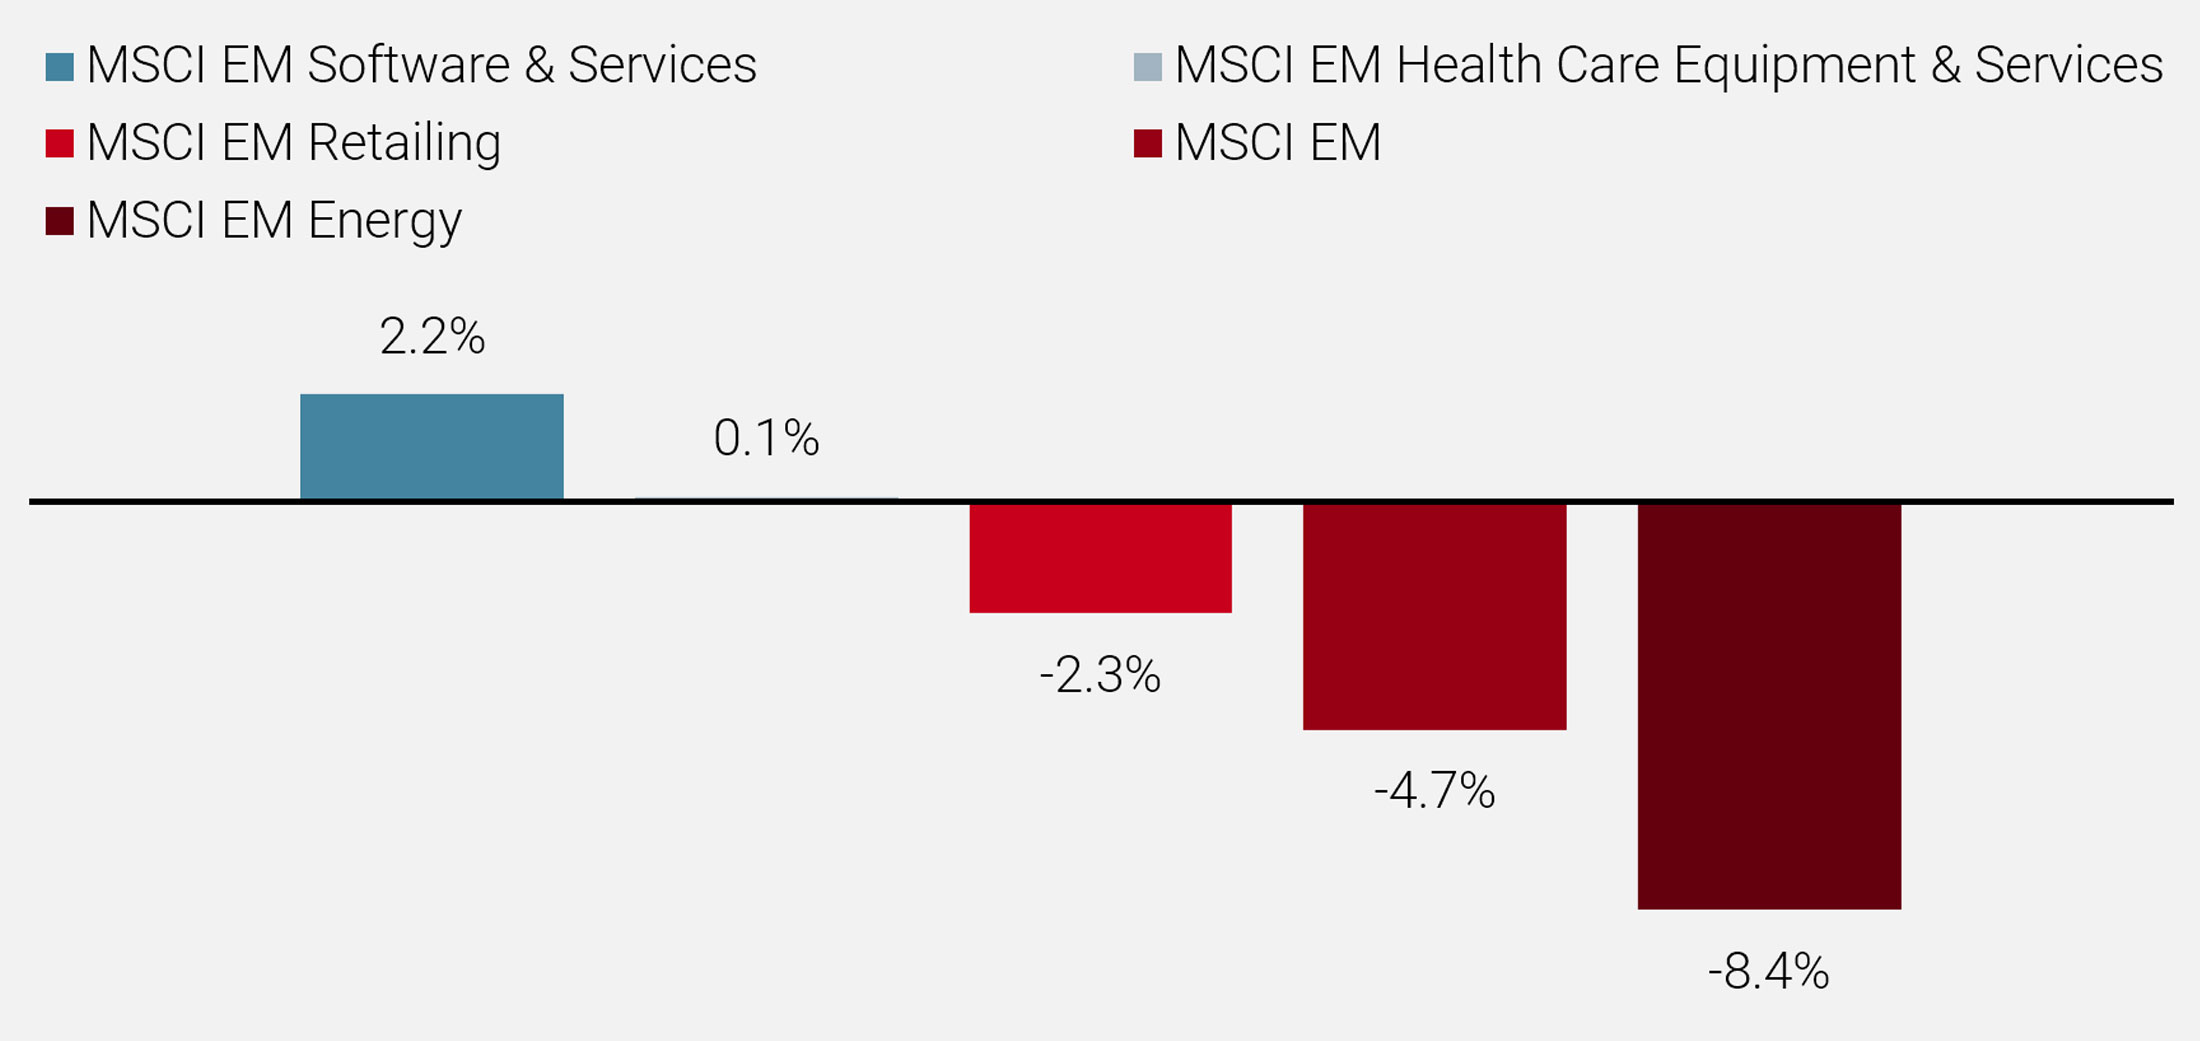
In January 2020, emerging equity markets reversed 2019’s year-end rally to close the month lower despite positive momentum from the US and China signing their “phase one” trade agreement. The sell-off, which saw the MSCI Emerging Markets TR Net fall nearly 5%, was predominantly driven by Asian markets, with the outbreak of the virus triggering substantial shifts during the month. Although the fallout was largely focused on Chinese and Asian markets, the emerging markets in Europe also registered negative performances in January, with Greece particularly weak, as highlighted in Figure 4. While most sectors had a disappointing month, software and health care stocks delivered positive returns – see Figure 5. The uncertainty also interrupted the strong performance of higher beta growth stocks.
Figure 4: Emerging Markets Returns in January 2020 – Select Countries
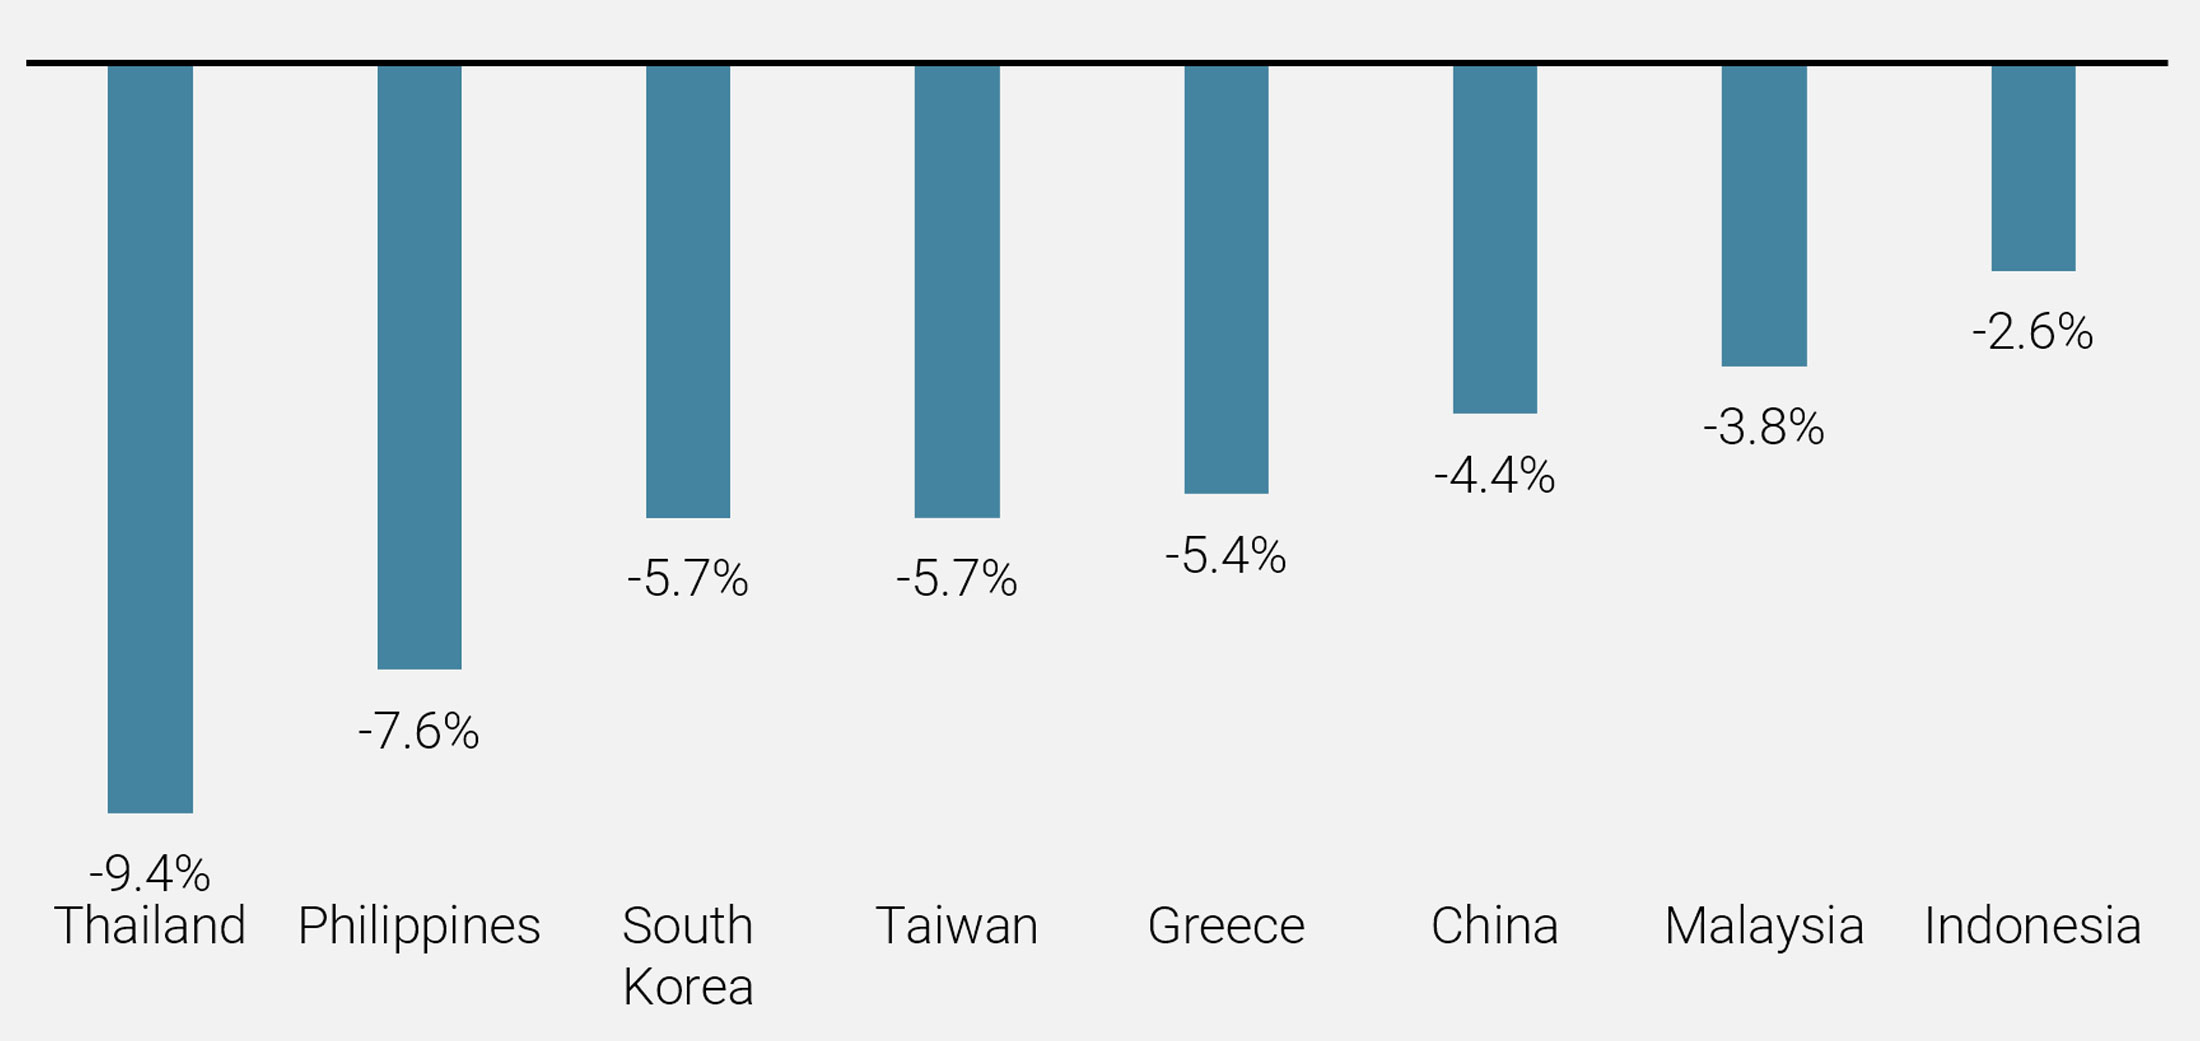
Figure 5: Emerging Markets Returns in January 2020 – Select Sectors
Moving into February, global equity markets fell sharply given the increasing number of reported COVID-19 cases in mainland China and some developed markets. The outbreak has created heightened market volatility, particularly at the end of the month when markets suffered their worst week since the global financial crisis, as illustrated in Figure 6.
At the end of February, markets suffered their worst week since the global financial crisis.
Concerns over growth continued to weigh on the global economic outlook and the oil price experienced another sharp drop during the month. Emerging equity markets also underperformed, but held up relatively well compared to their developed market counterparts, partially due to the downturn they had already experienced at the end of January. Although China fared relatively well on the back of the country’s central bank providing fiscal stimulus to the economy, some traditionally defensive markets, such as Thailand and South Korea, failed to cushion the market panic. Among sectors, communication services, real estate and health care fared slightly better than the broader market (albeit still down), while energy was the weakest sector.
Figure 6: Equity Market Performance (19th – 27th February)
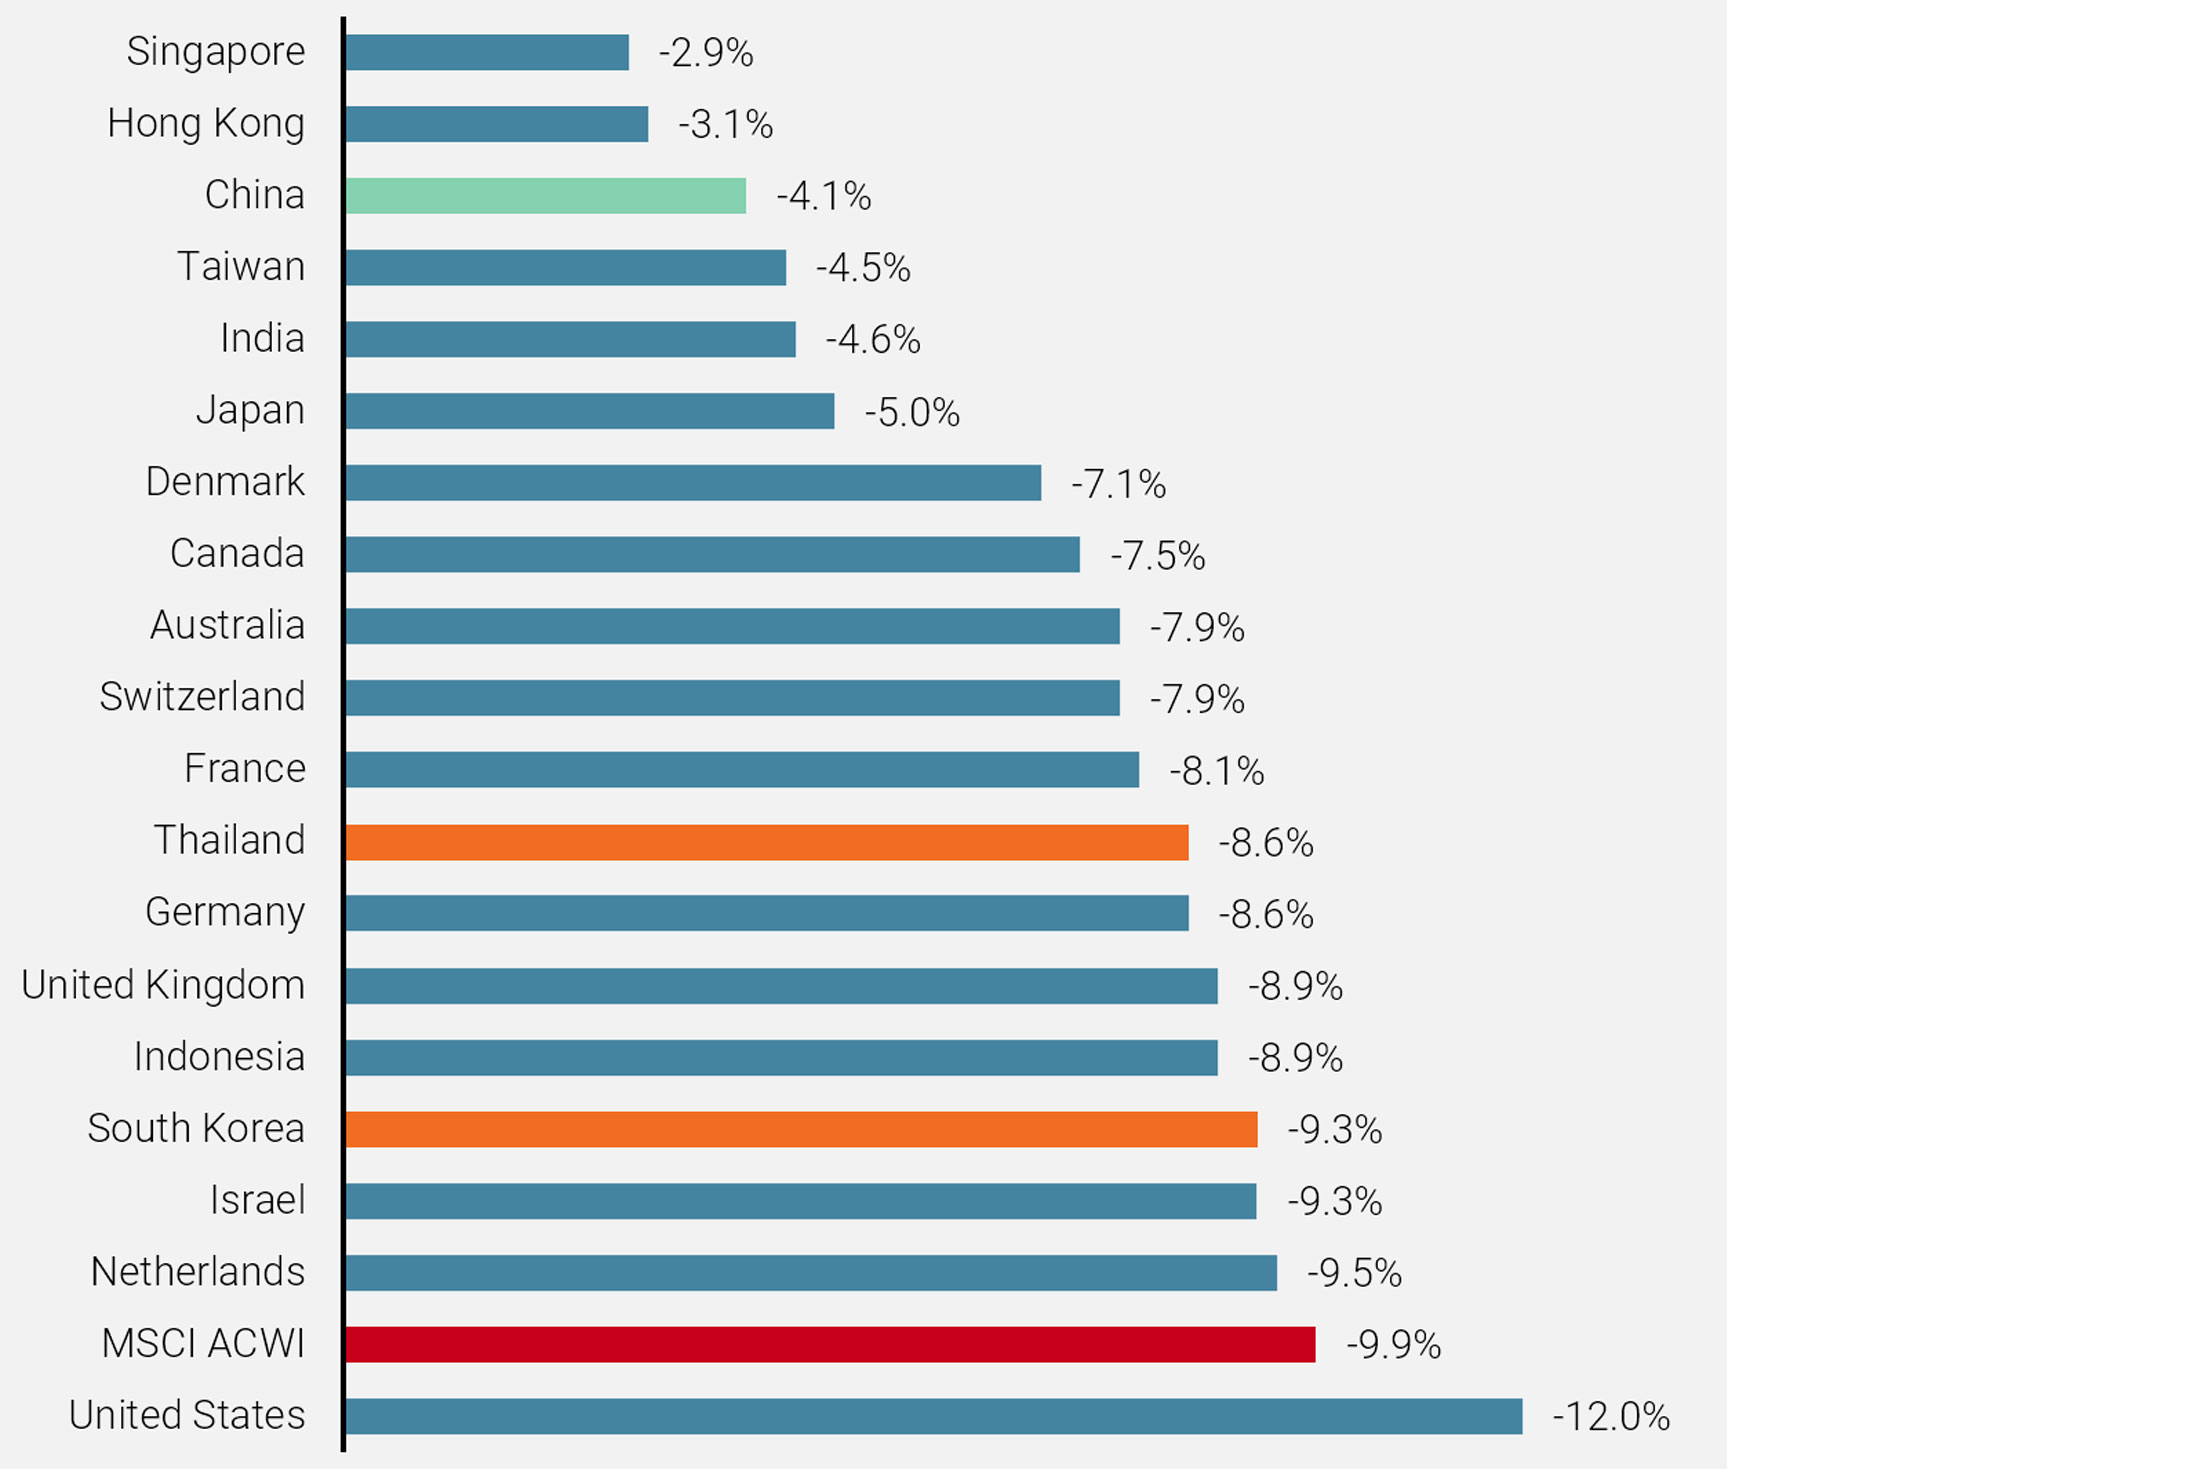
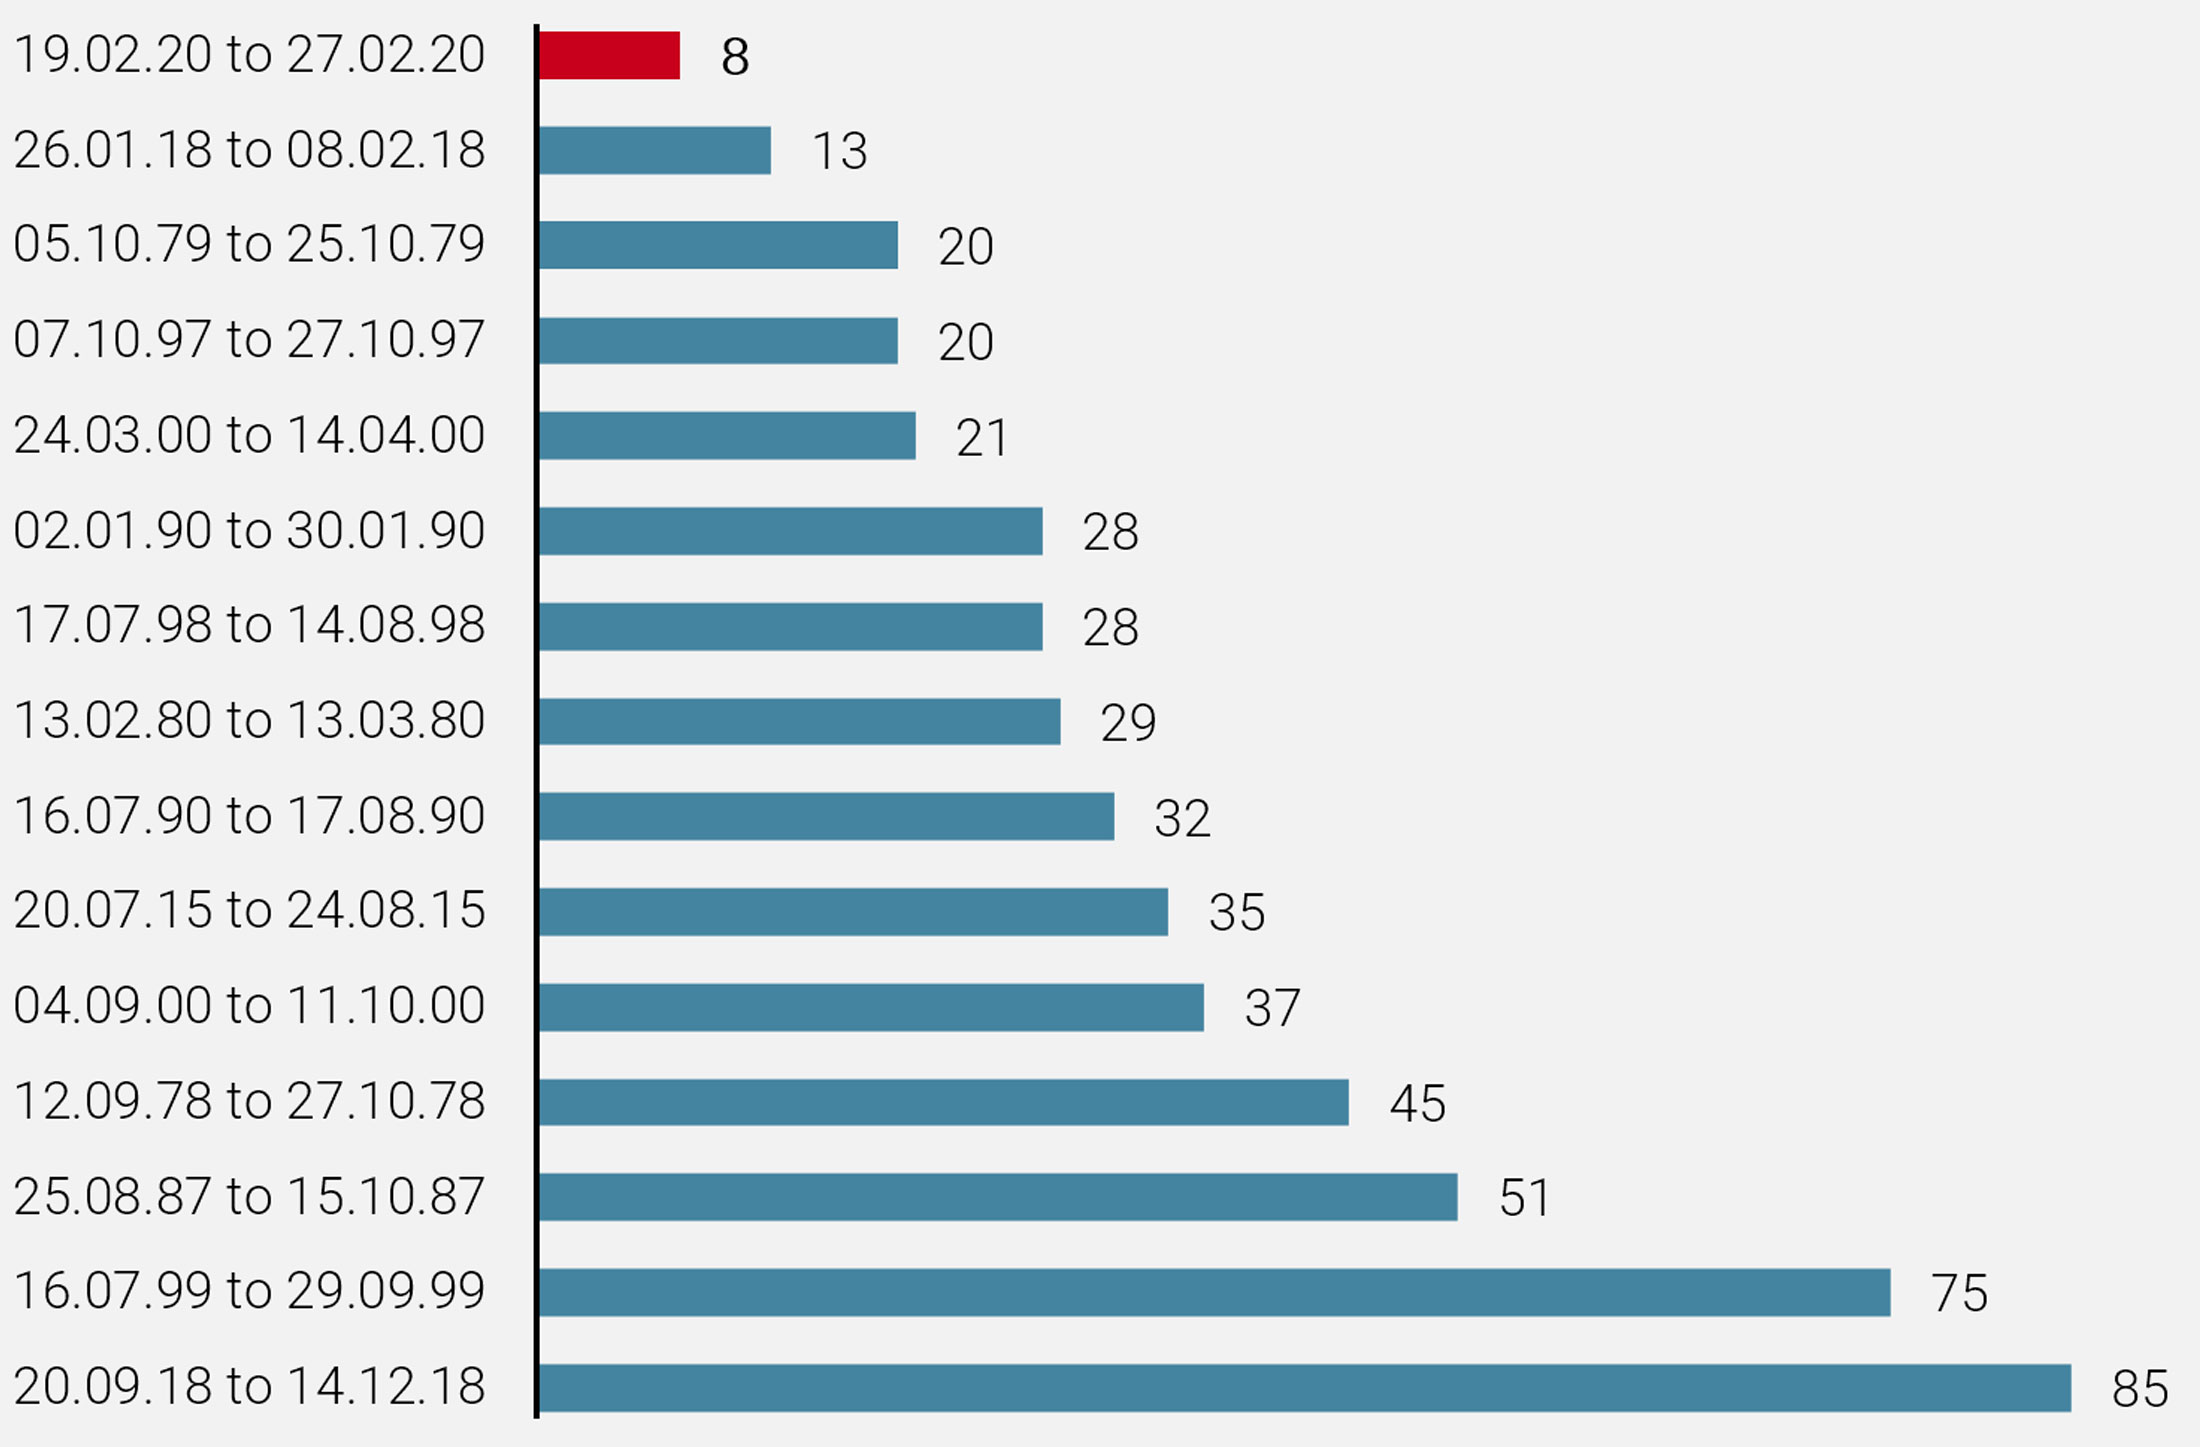
Figure 7: Number of Days for S&P 500 Index to Lose 10% from Peak
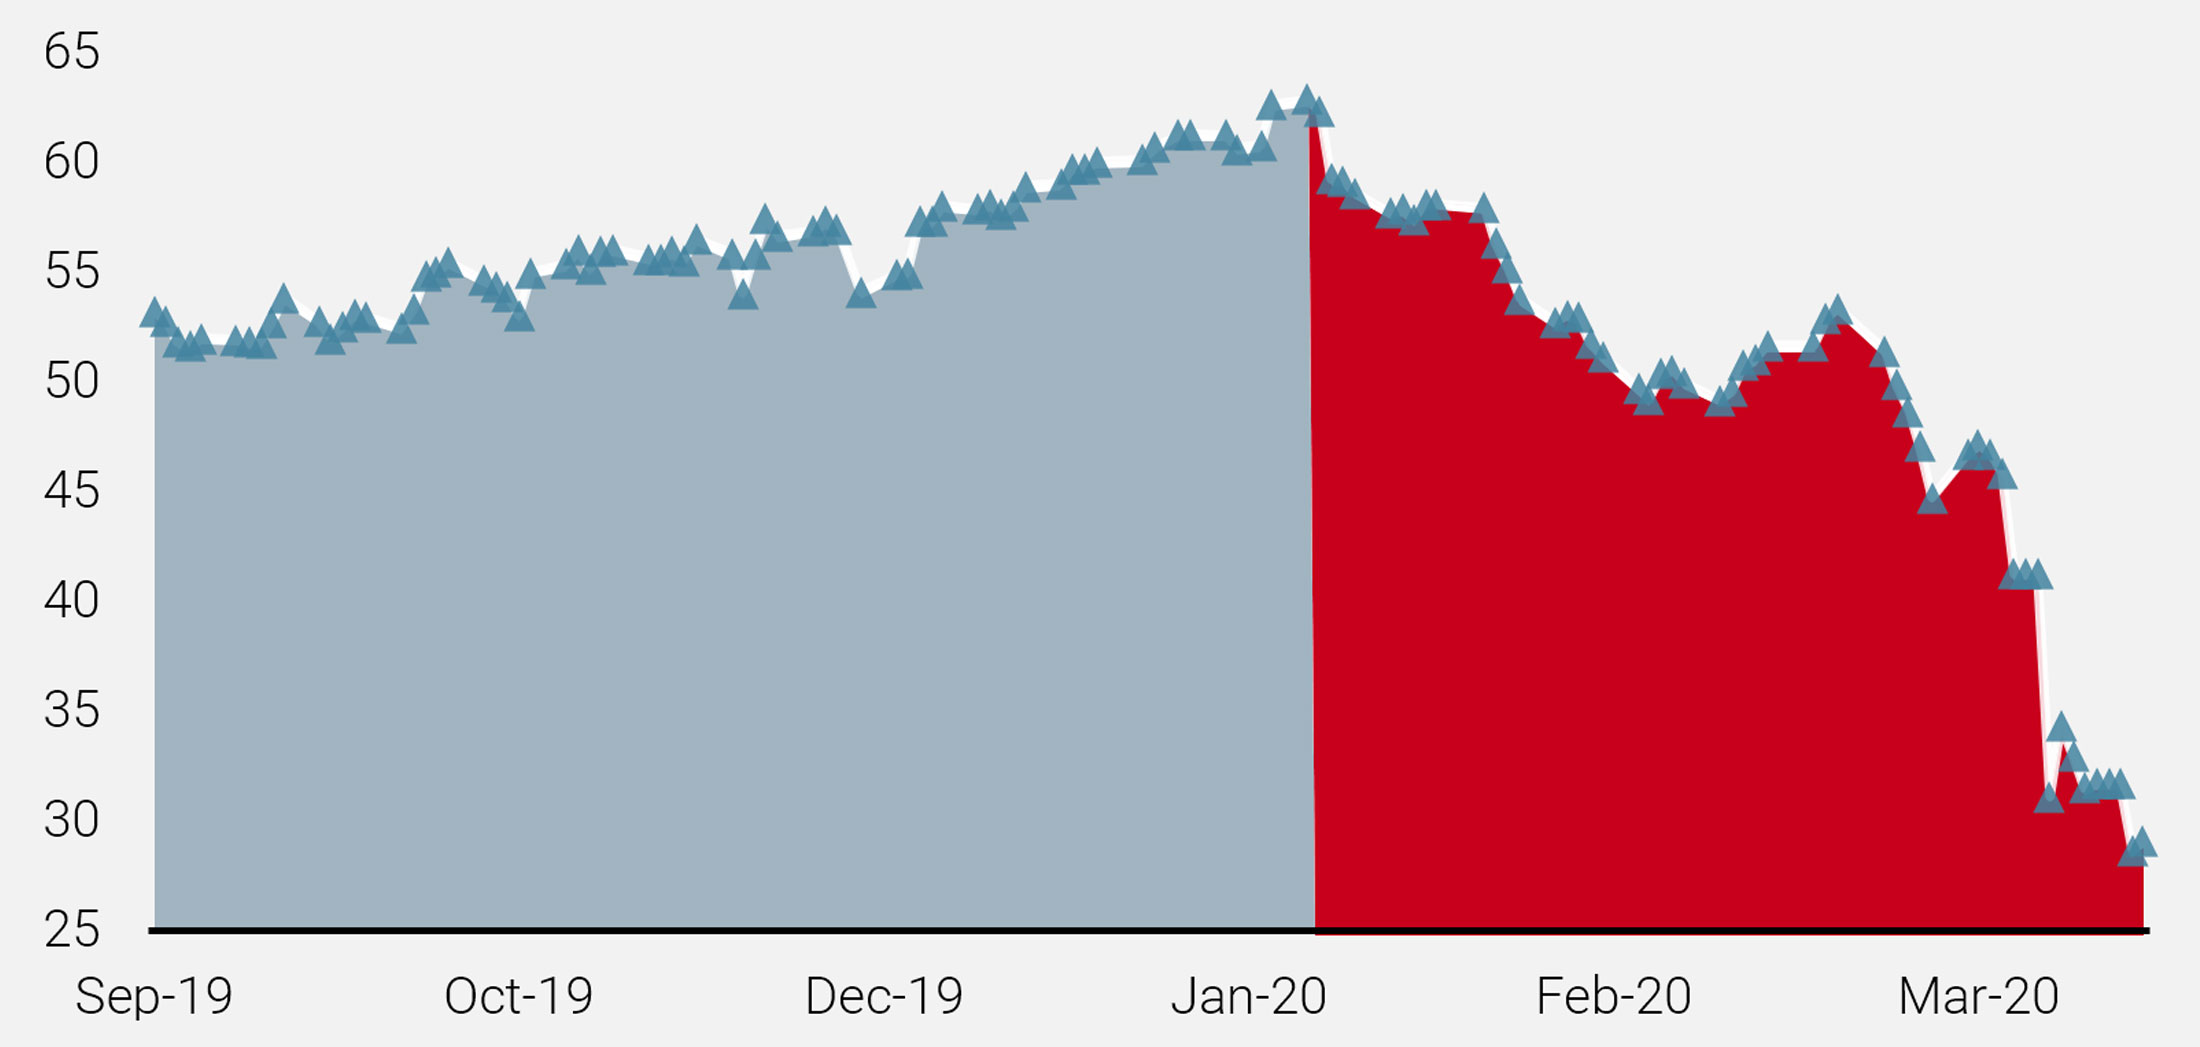
As Figure 8 shows, the oil price has also experienced a volatile start to the year. After a sharp spike on the back of geopolitical risk from direct military confrontation between Iran and the US, the price of Brent Crude has fallen sharply on worries that the virus outbreak will lower Chinese demand for crude. This explains the sharp fall in the MSCI Emerging Markets Energy index in January.
Figure 8: Price of Brent Crude
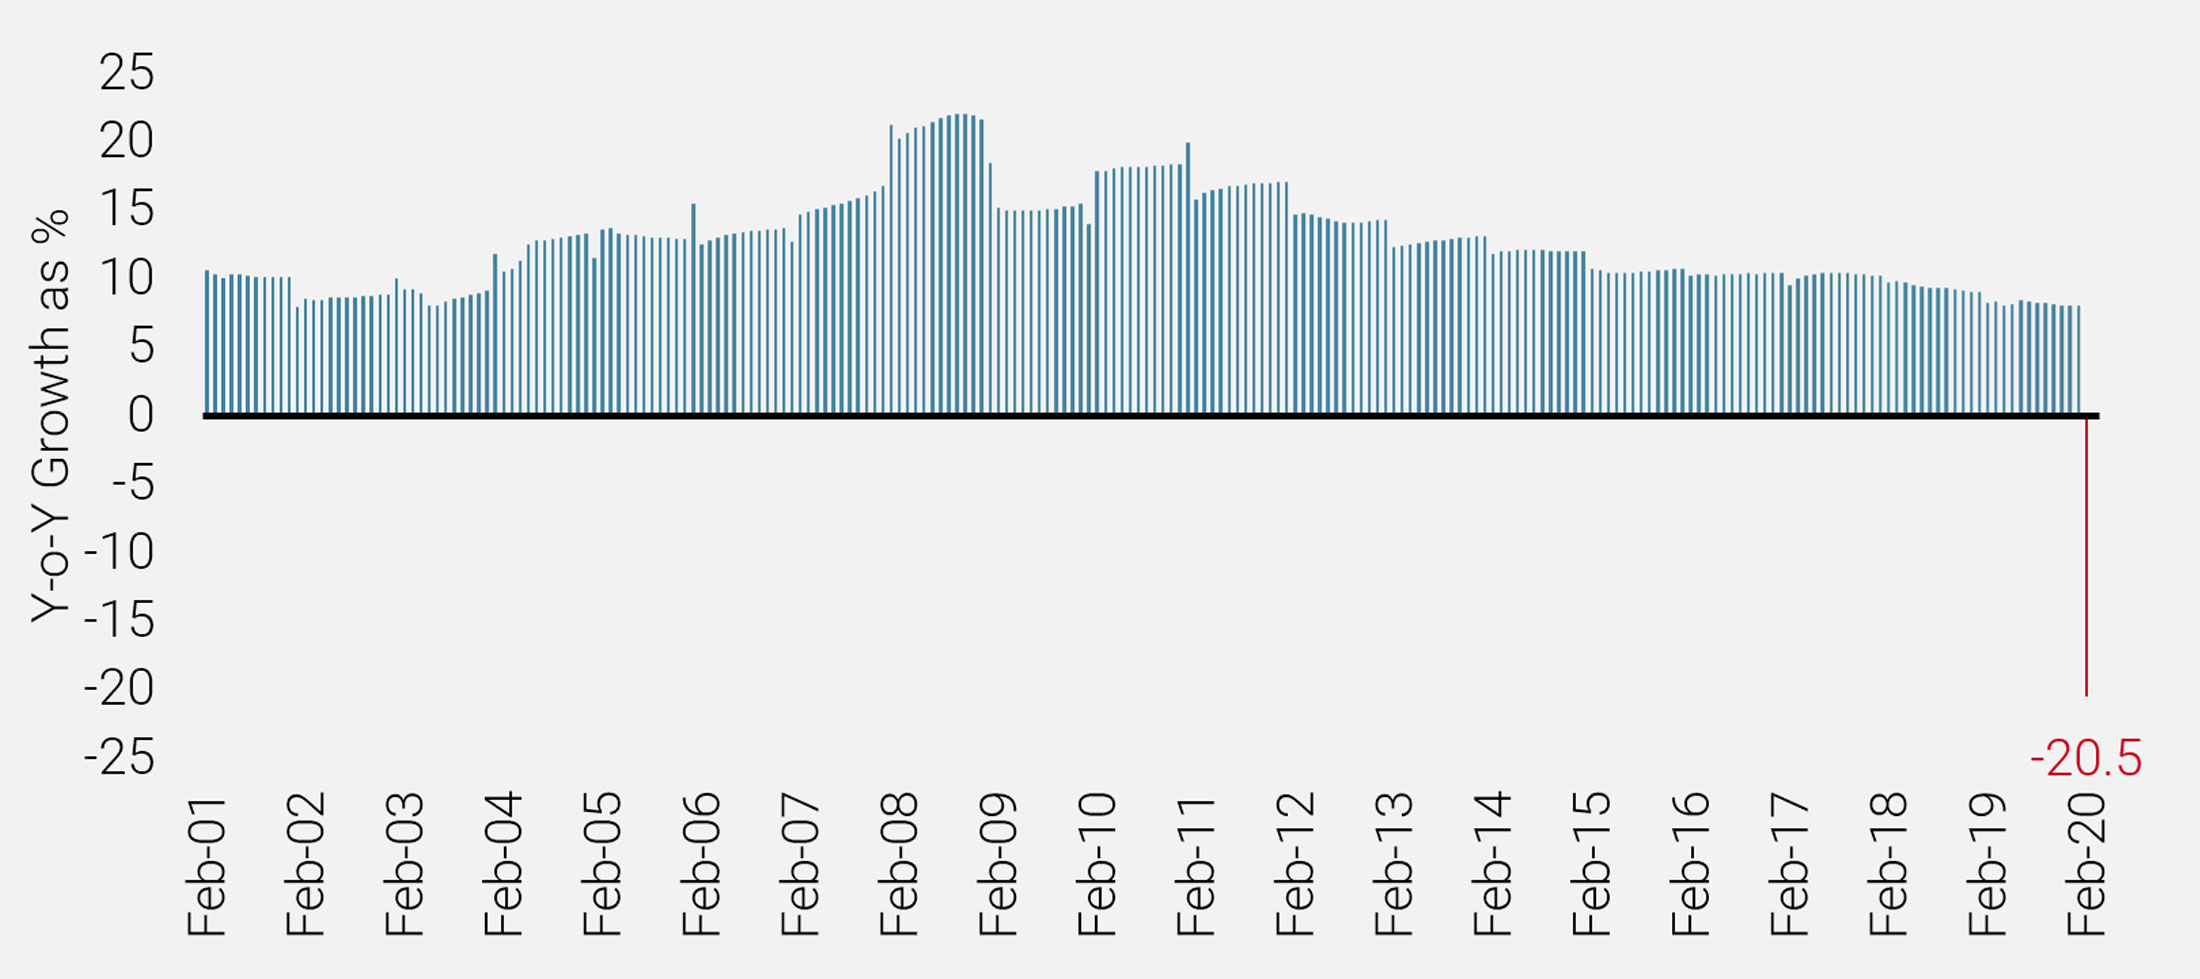
With governments taking unprecedented measures to curb the spread of the virus, sectors such as retailing, in particular retailers of luxury goods, transportation and consumer services, such as hotels and restaurants & leisure, are among the most vulnerable in the near term. Given many factories in China closed during the COVID-19 outbreak, the globally integrated economy is particularly vulnerable to global supply chain disruptions. For example, Apple Inc. has already announced that they expect revenue to be impacted, and this has raised concerns about making and selling products in China, as shown in Figure 9.
Figure 9: Annual Growth in Chinese Retail Sales
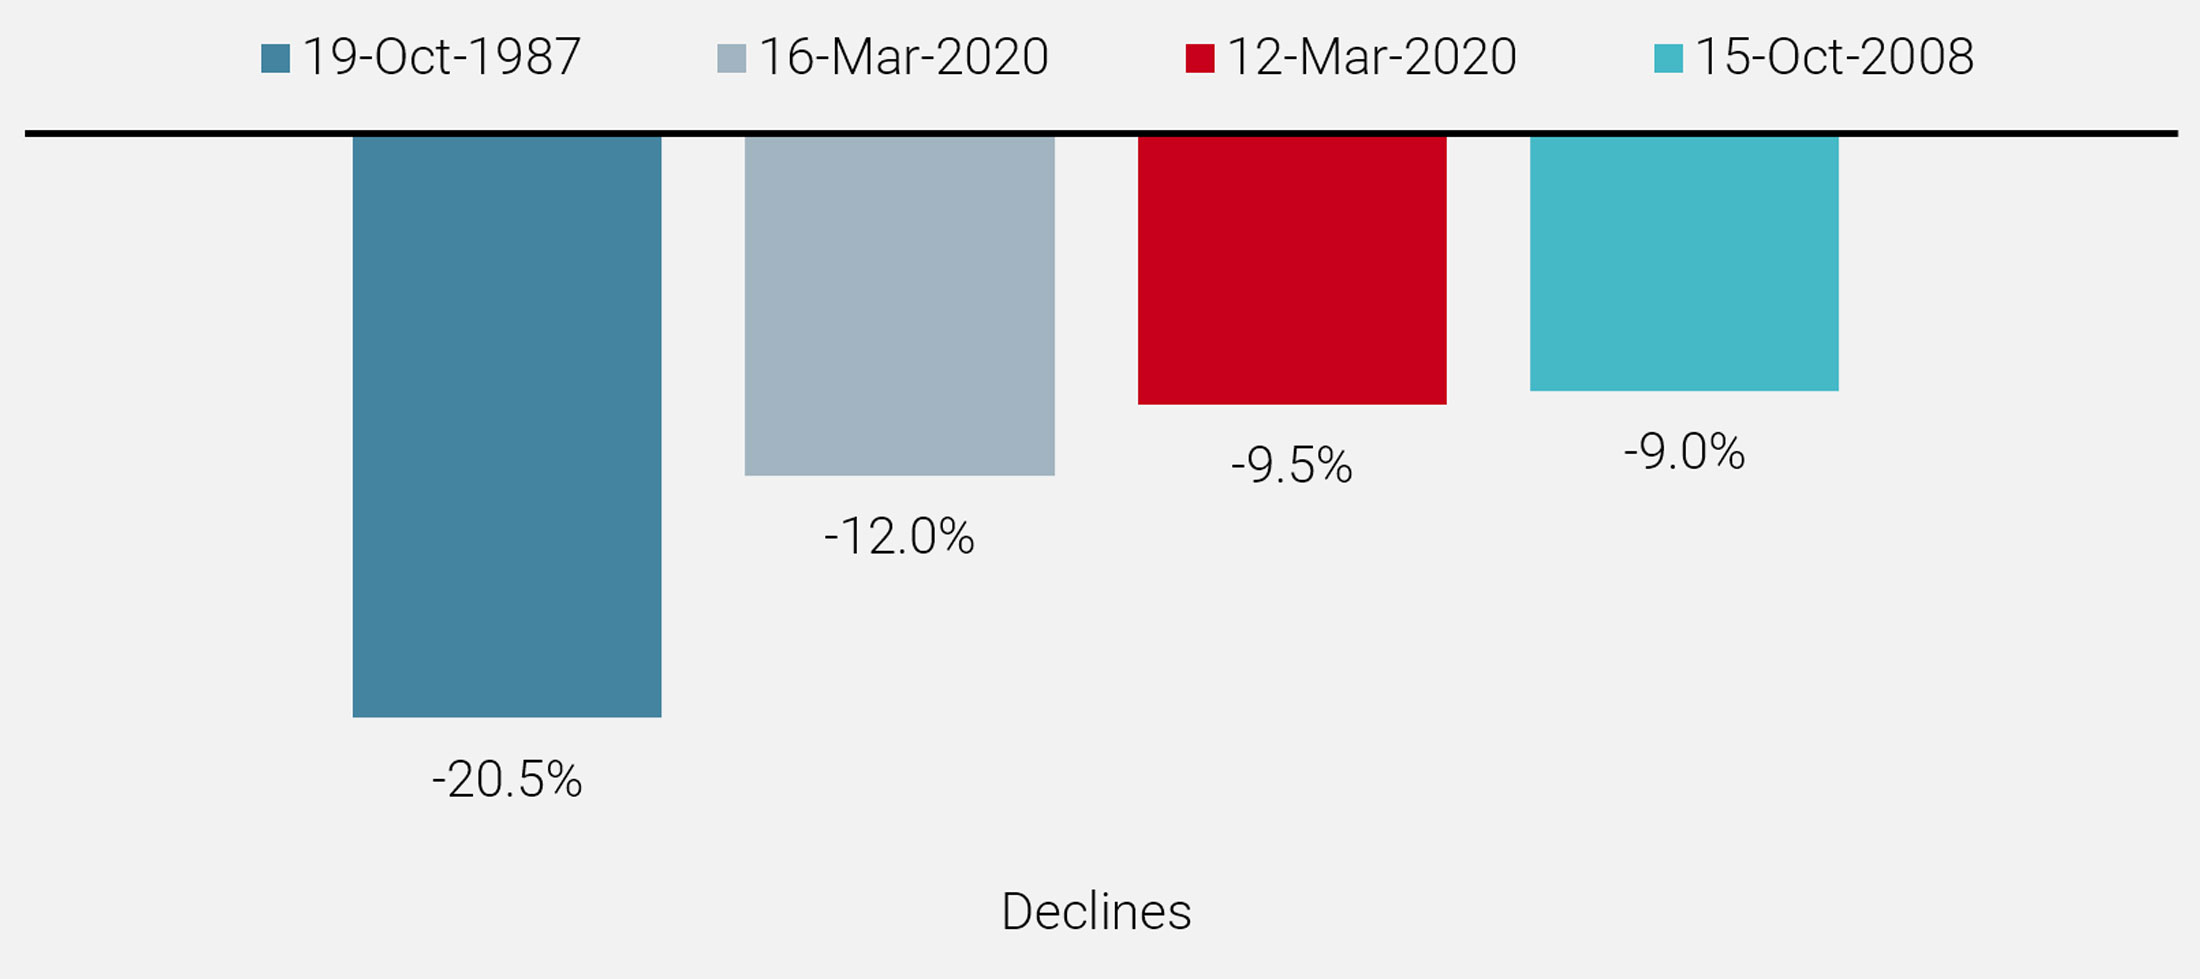
In March, the COVID-19 pandemic and the oil price war have accelerated the move lower for equity markets, in both magnitude and velocity. As we write, March 16, 2020 became the second-worst day for the S&P 500 Index since 1987, marking a new “Black Monday”, just a few days after beating this record on March 12 (Figure 10).
The oil price war has compounded the financial and economic implications of COVID-19.
Figure 10: Four Worst Days for the S&P 500 Index
Active Management – Adapt Quickly and React to Changing Market Conditions
The rapid escalation of the COVID-19 outbreak is highlighting, in particular, the importance of active judgement and context. Compared to an index/rule based investment strategy, we have been proactively analysing both our top-down (country, industry and style) and bottom-up (stock level) decisions.
The escalation of COVID-19 outbreak is highlighting the importance of active judgement and context.
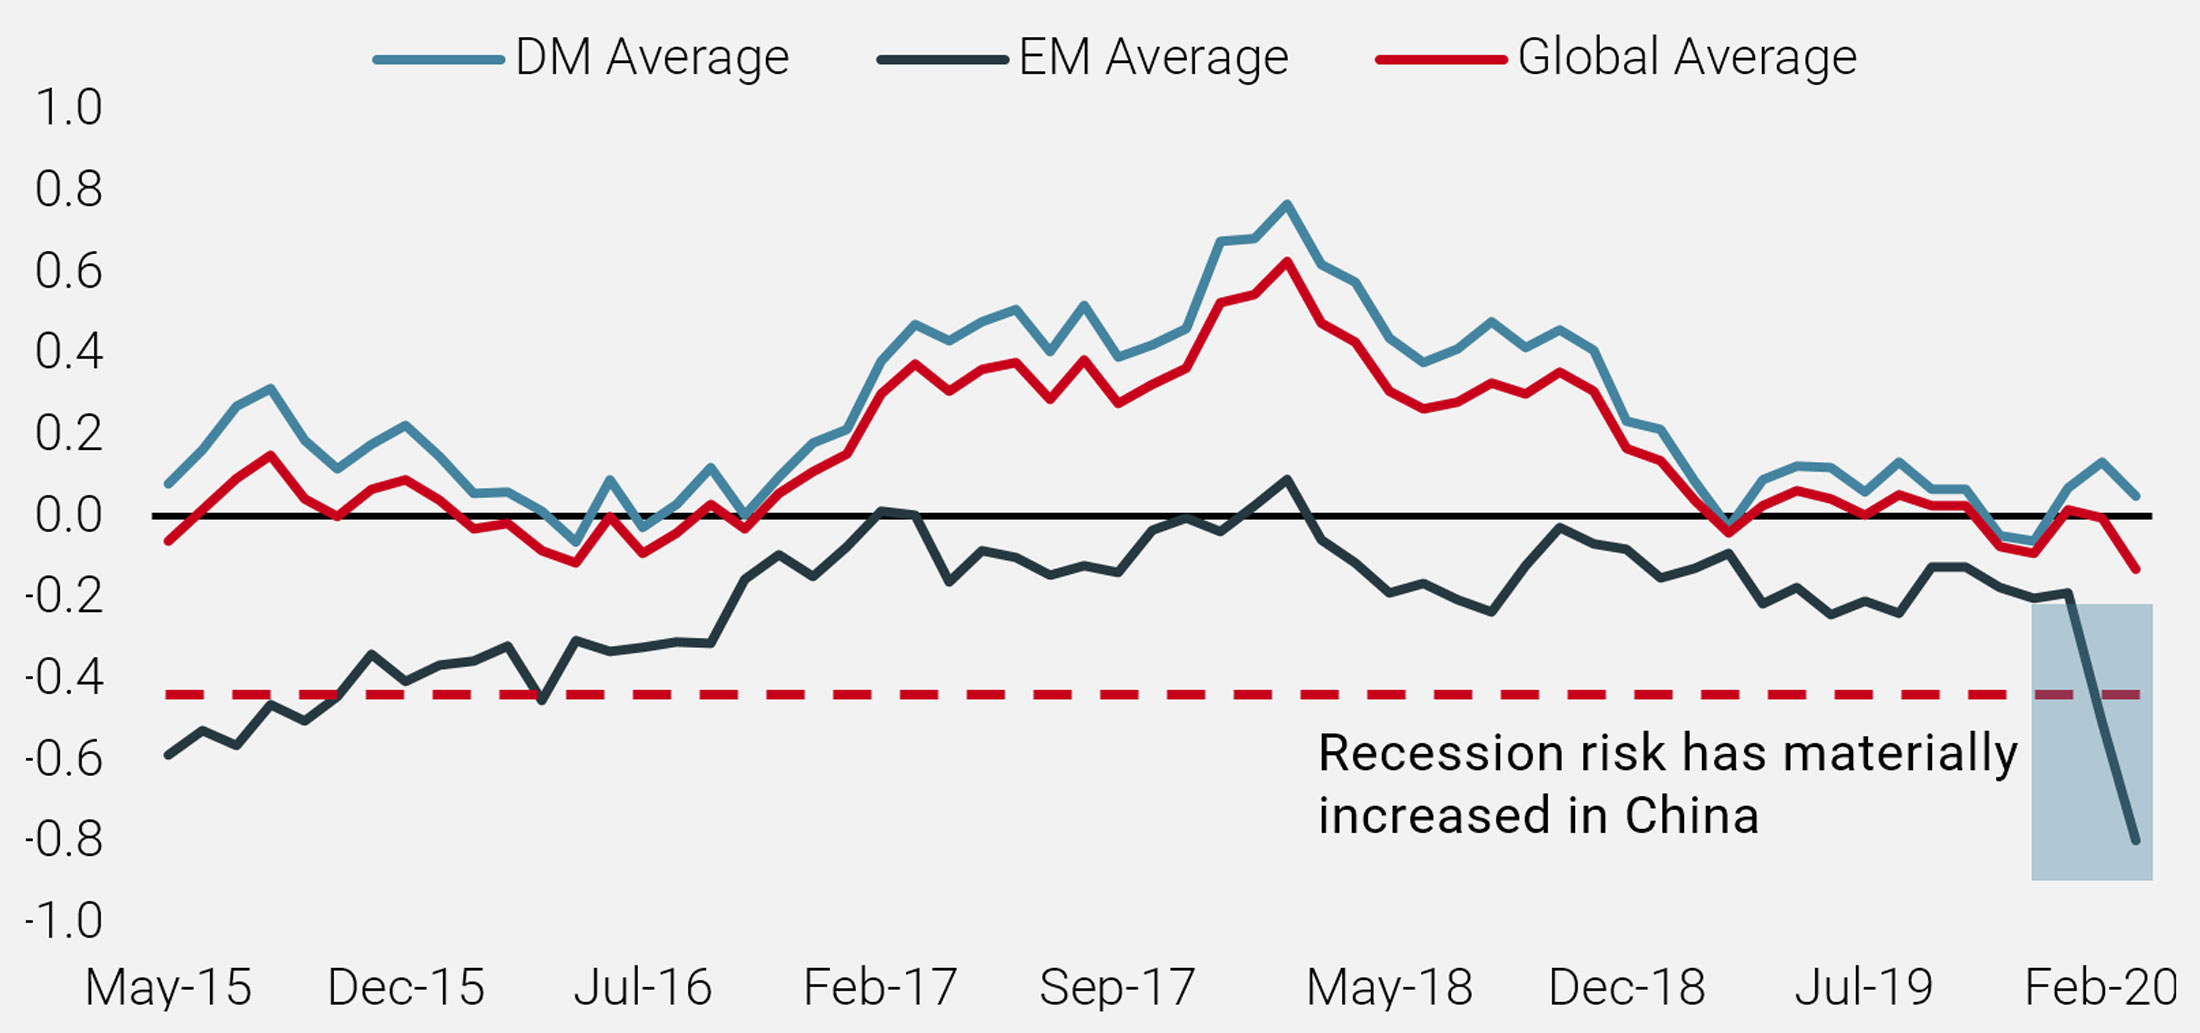
Our proprietary World Growth Nowcaster model (Figure 11) assesses the economic conditions of individual countries. Since February 21, we have seen uncertainty rising, coinciding with the spread of COVID-19 cases beyond China. It is a negative factor to growth assets and to the underlying economies, harming consumption and postponing investment projects. It also perturbates the global supply chain with complex consequences for corporates and a negative impact on market liquidity.
Figure 11: Unigestion World Growth Nowcaster
We are keeping a close eye on the development of the COVID-19 crisis and its impact on our Growth Nowcasters. Based on this, we have been reviewing our exposure to Thailand, which is one of our largest overweights, and are rebalancing our equity portfolios to take into account the new Coronavirus-related risk factors.
Since the outbreak, Thailand has been hit hard due to its high exposure to tourism, particularly from China. The tourism industry represents roughly 15% of the country’s GDP and Chinese tourists account for 1 out of 3 international arrivals. Thailand also entered this challenging period with a relatively weak economic momentum and exports, as well as tourism, which will take a hit short-term. In response, the central bank has cut interest rates to 1% (a historical low) and with a 40% government debt to GDP ratio, there is ample room for a large fiscal stimulus package.
From a bottom-up perspective, we are carefully assessing our positions in stocks with significant exposure to the virus, in particular holdings linked to the tourism and travel businesses. For instance, we have taken action on some of the most exposed stocks such as the Airport of Thailand, Krung Thai Bank and Central Pattana (shopping malls, food courts, hotels), whose business is heavily exposed to COVID-19 uncertainty from Thailand. Likewise, with the US imposing travel restrictions, we have decided to sell our positions in Grupo Aeroport Del Pacific because the US-Mexico border could also be shut down to contain the virus. In developed markets, we have proactively reviewed and trimmed our exposures on Aéroports de Paris and Flughafen Zurich, among others.
On the other hand, within emerging markets, we remain long in Top Glove, the world’s largest rubber glove manufacturer. The company produces a comprehensive range of rubber glove products from natural and synthetic rubber and orders for these and other protective medical equipment have seen a spike. In developed markets we continue to favour Roche given its defensive characteristics, reasonable valuations and sustainable growth (i.e. growth is expected in multiple areas ranging from sclerosis, haemophilia, immunology and ophthalmology).
The strategy tends to exhibit a smaller drawdown than the broader market when such black swan events occur.
Downside Protection During a Black Swan Event
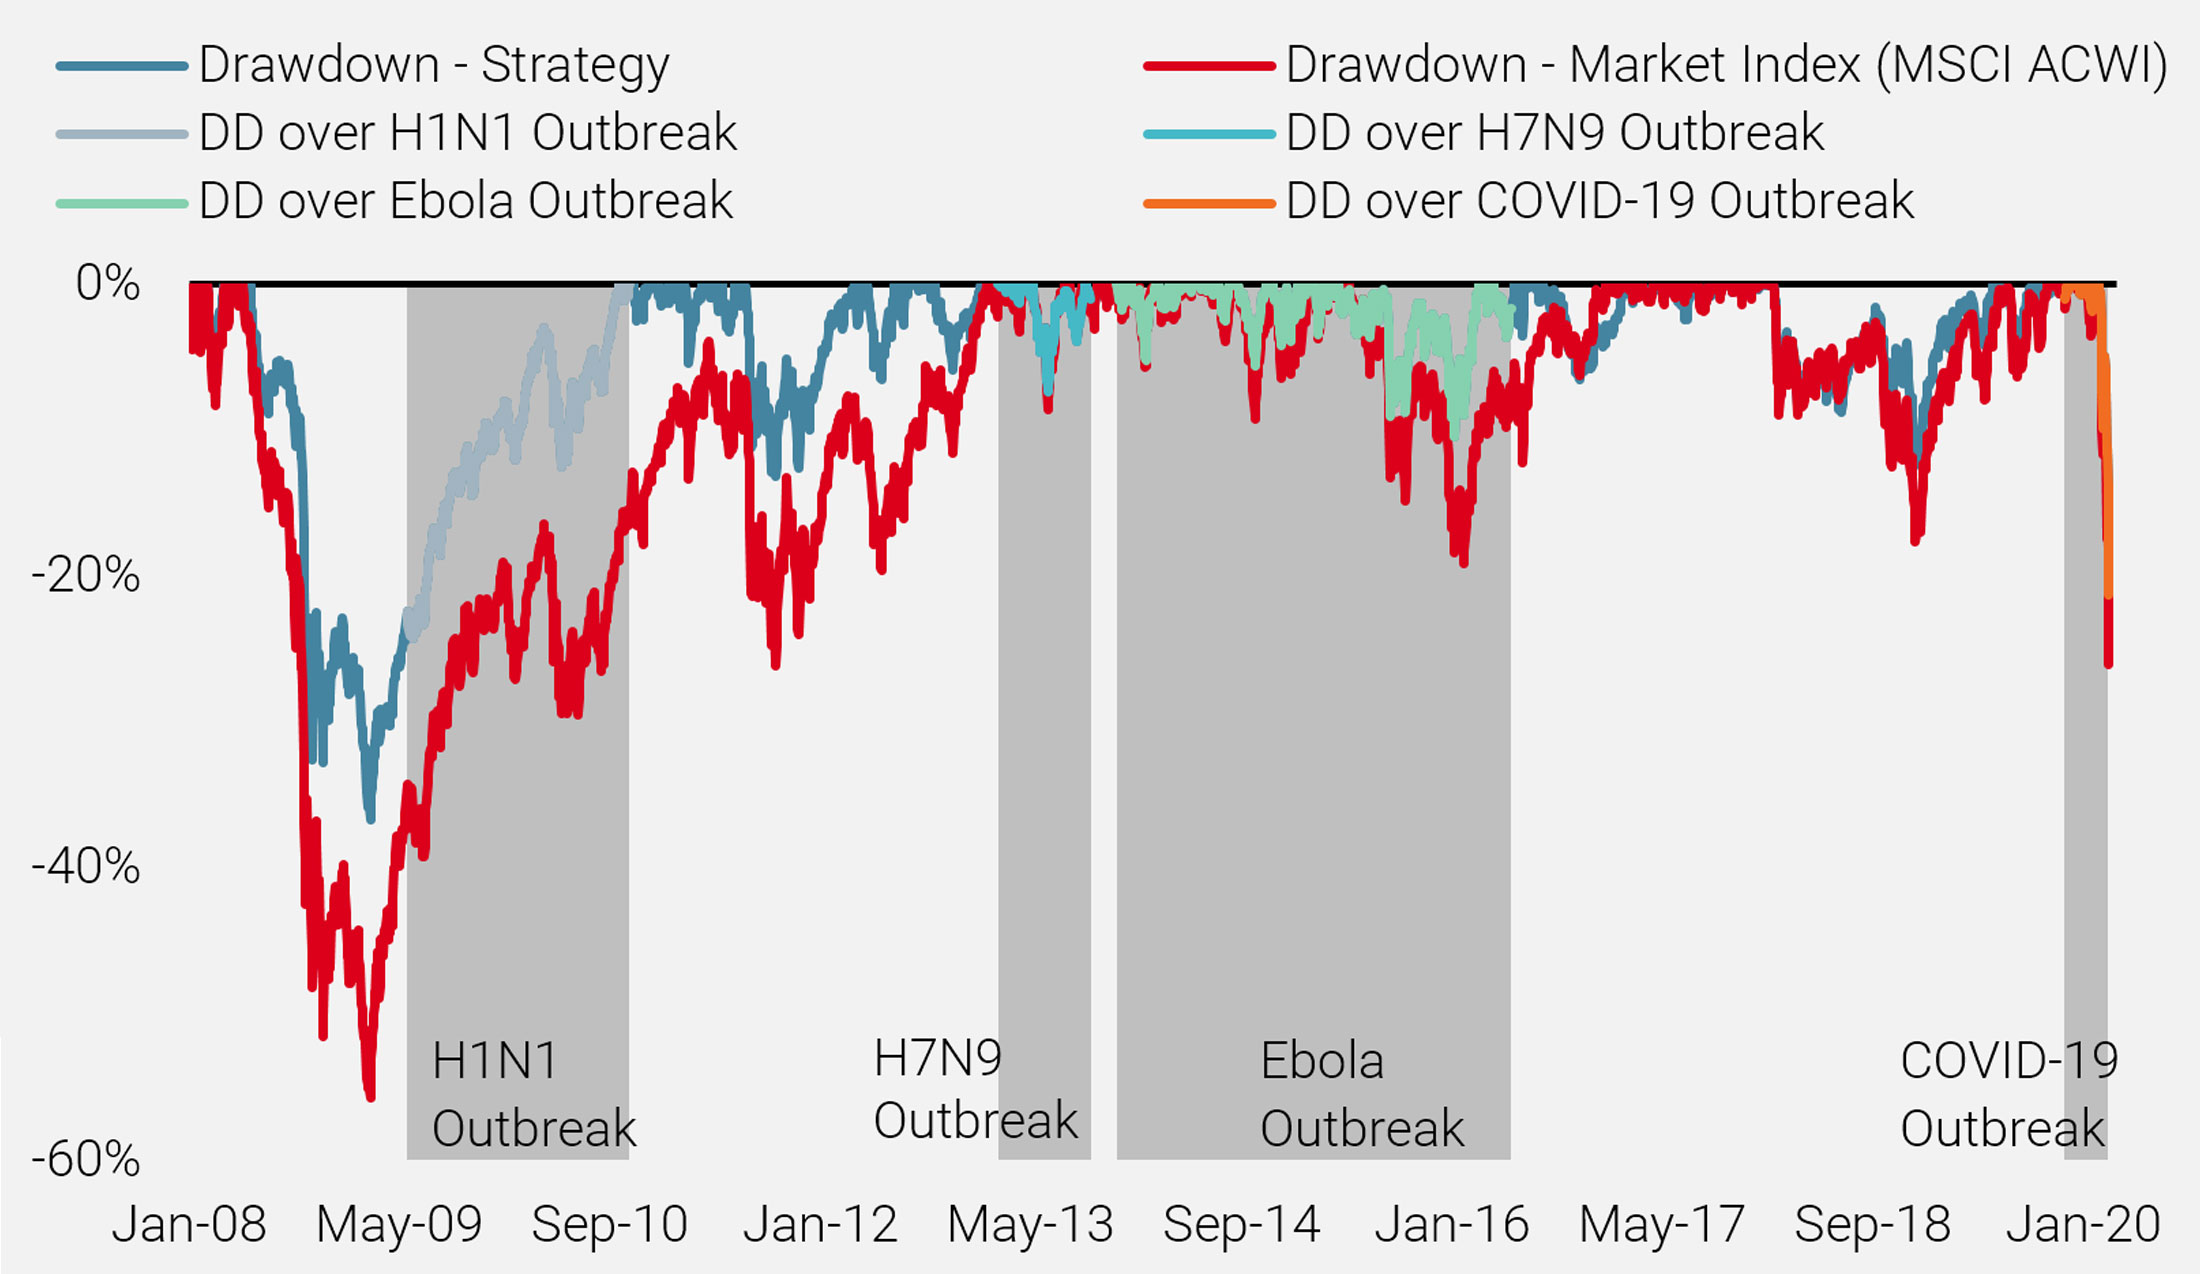
To better understand the market impact of the current outbreak, we examined the response of our risk-managed global equities strategy during other similar situations, analysing relative performance during the 2009 H1N1 Pandemic Influenza, the 2013 Avian Influenza A (H7N9) and the Ebola Virus from 2014 to 2016. As shown in Figure 12, the strategy tends to exhibit a smaller drawdown than the broader market when such black swan events occur.
Figure 12: Historical Drawdowns During Outbreaks
How Have our Risk-Managed Equity Strategies Performed?
The strategies favour industries such as telecommunications, utilities and pharmaceuticals, which are relatively immune to economic cycles and have more defensive characteristics. These companies provide products and services that are needed in both good and bad times. On the other hand, the portfolio is less exposed to retailing and media & entertainment when compared to the market index.
Since the start of the outbreak, our risk-managed strategies have outperformed the broader market.
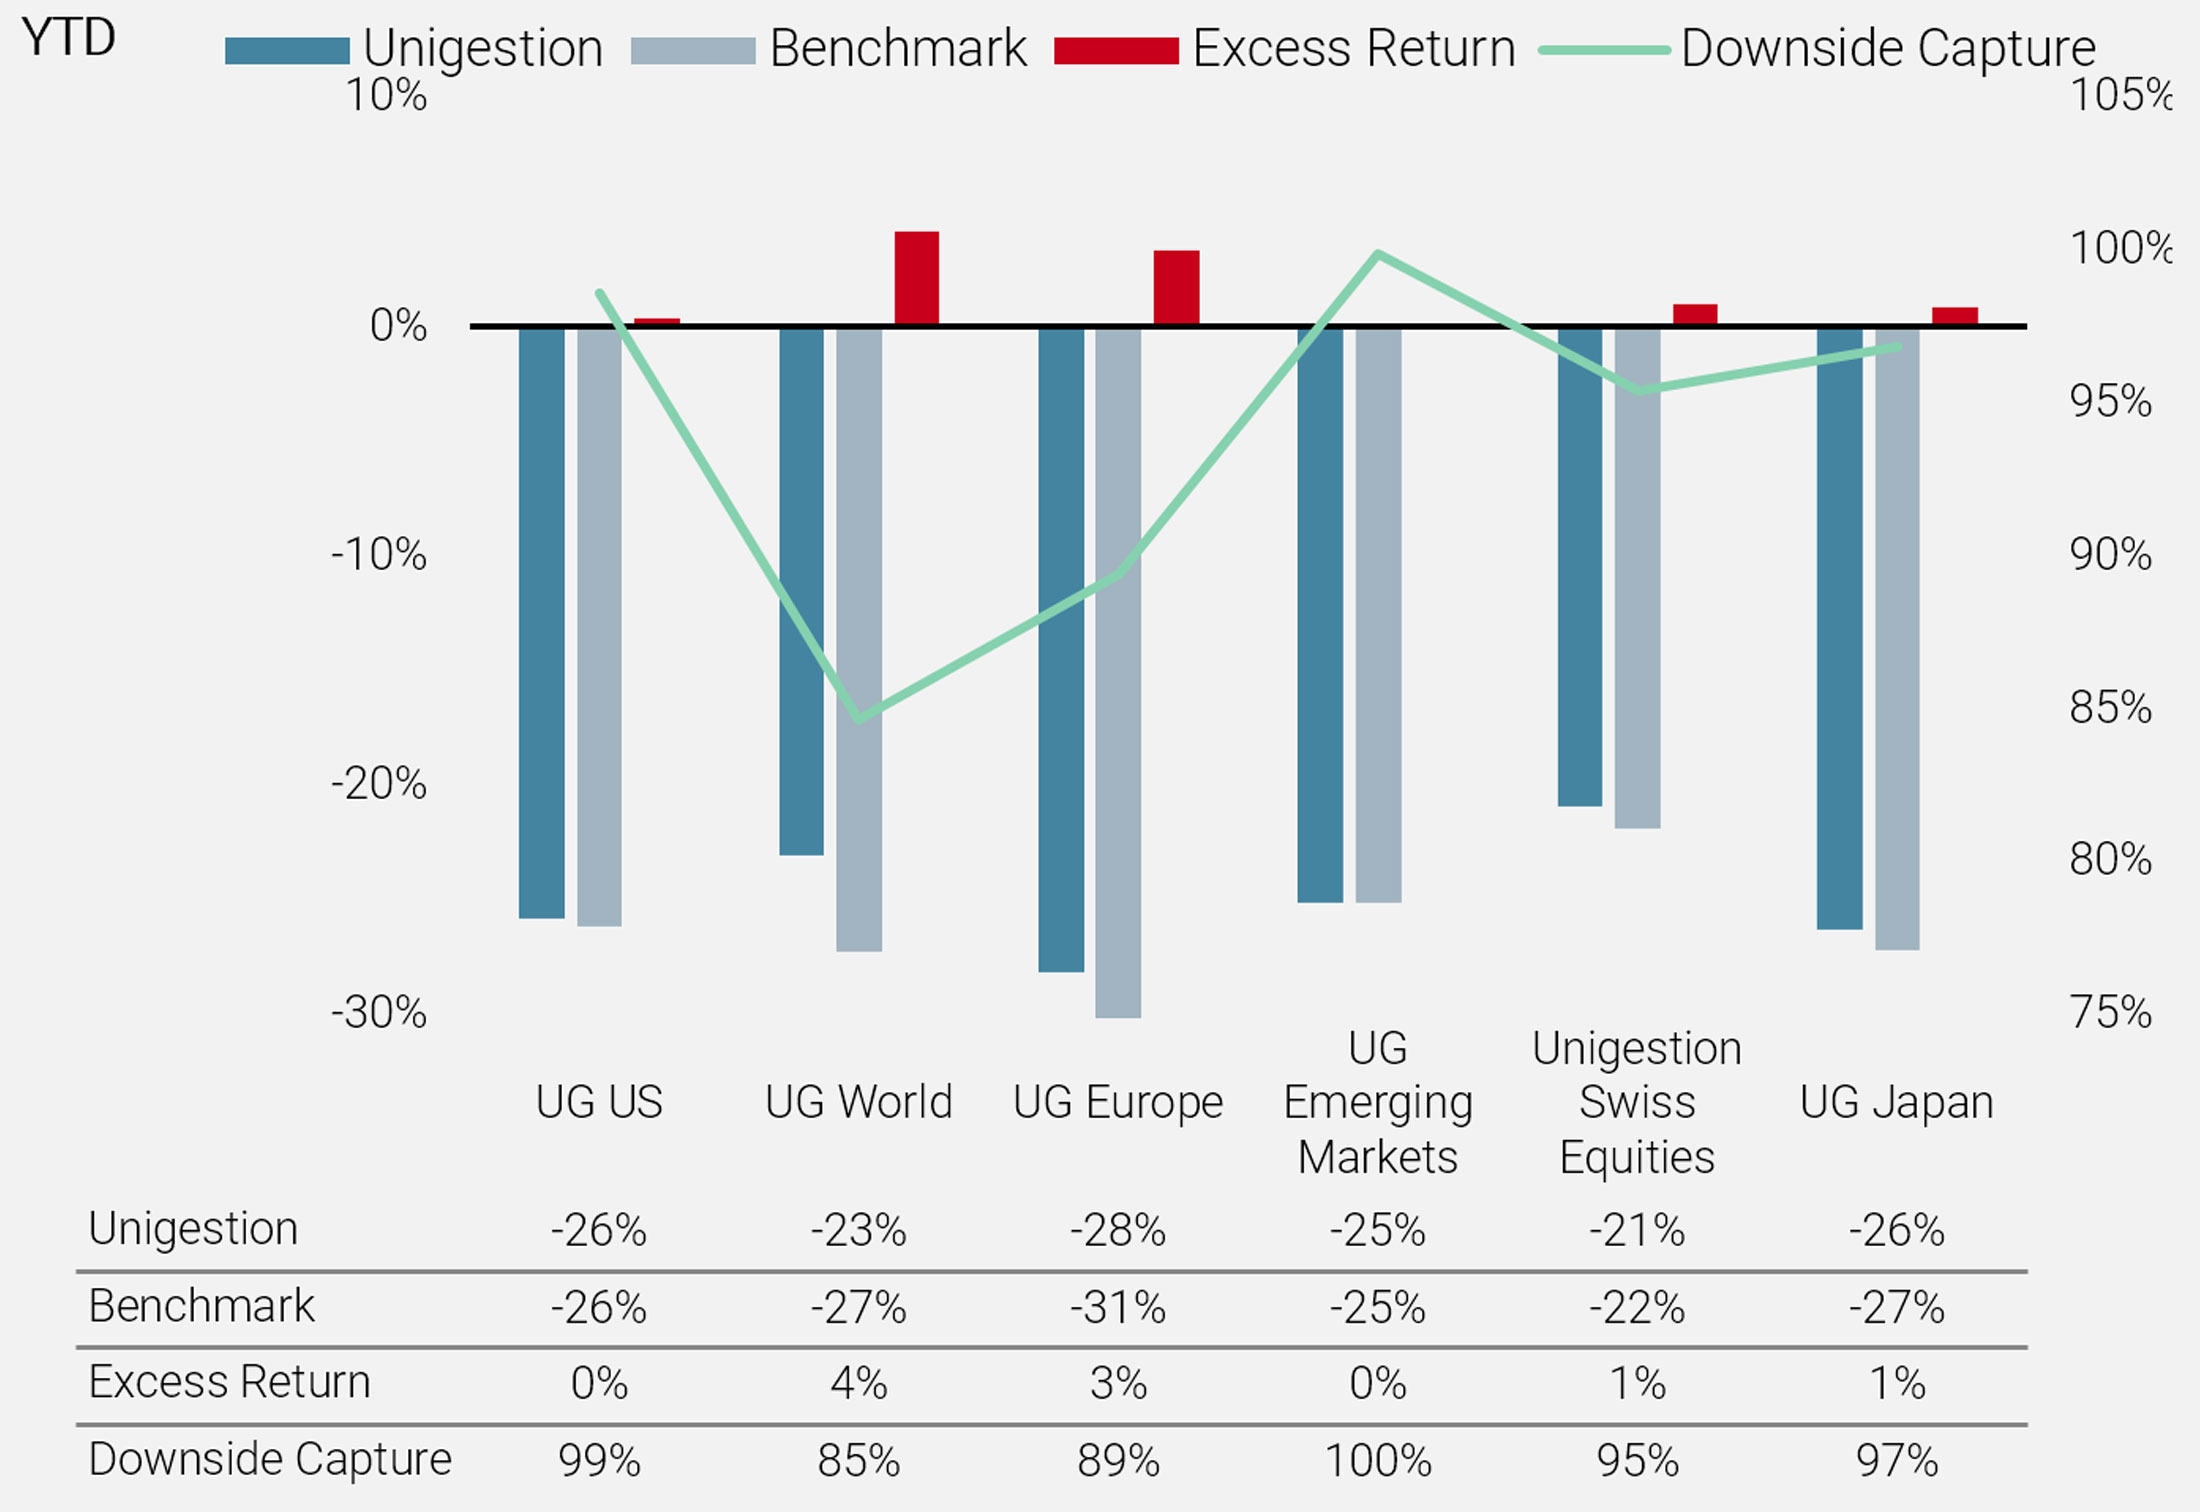
Since the start of the outbreak, our strategies have outperformed their respective regional benchmarks, as shown in Figure 13 for estimated month-to-date performance and Figure 14 for estimated year-to-date performance as of March 16.
Figure 13: Estimated Month-to-Date Results – Flagship Strategies (As of March 16)
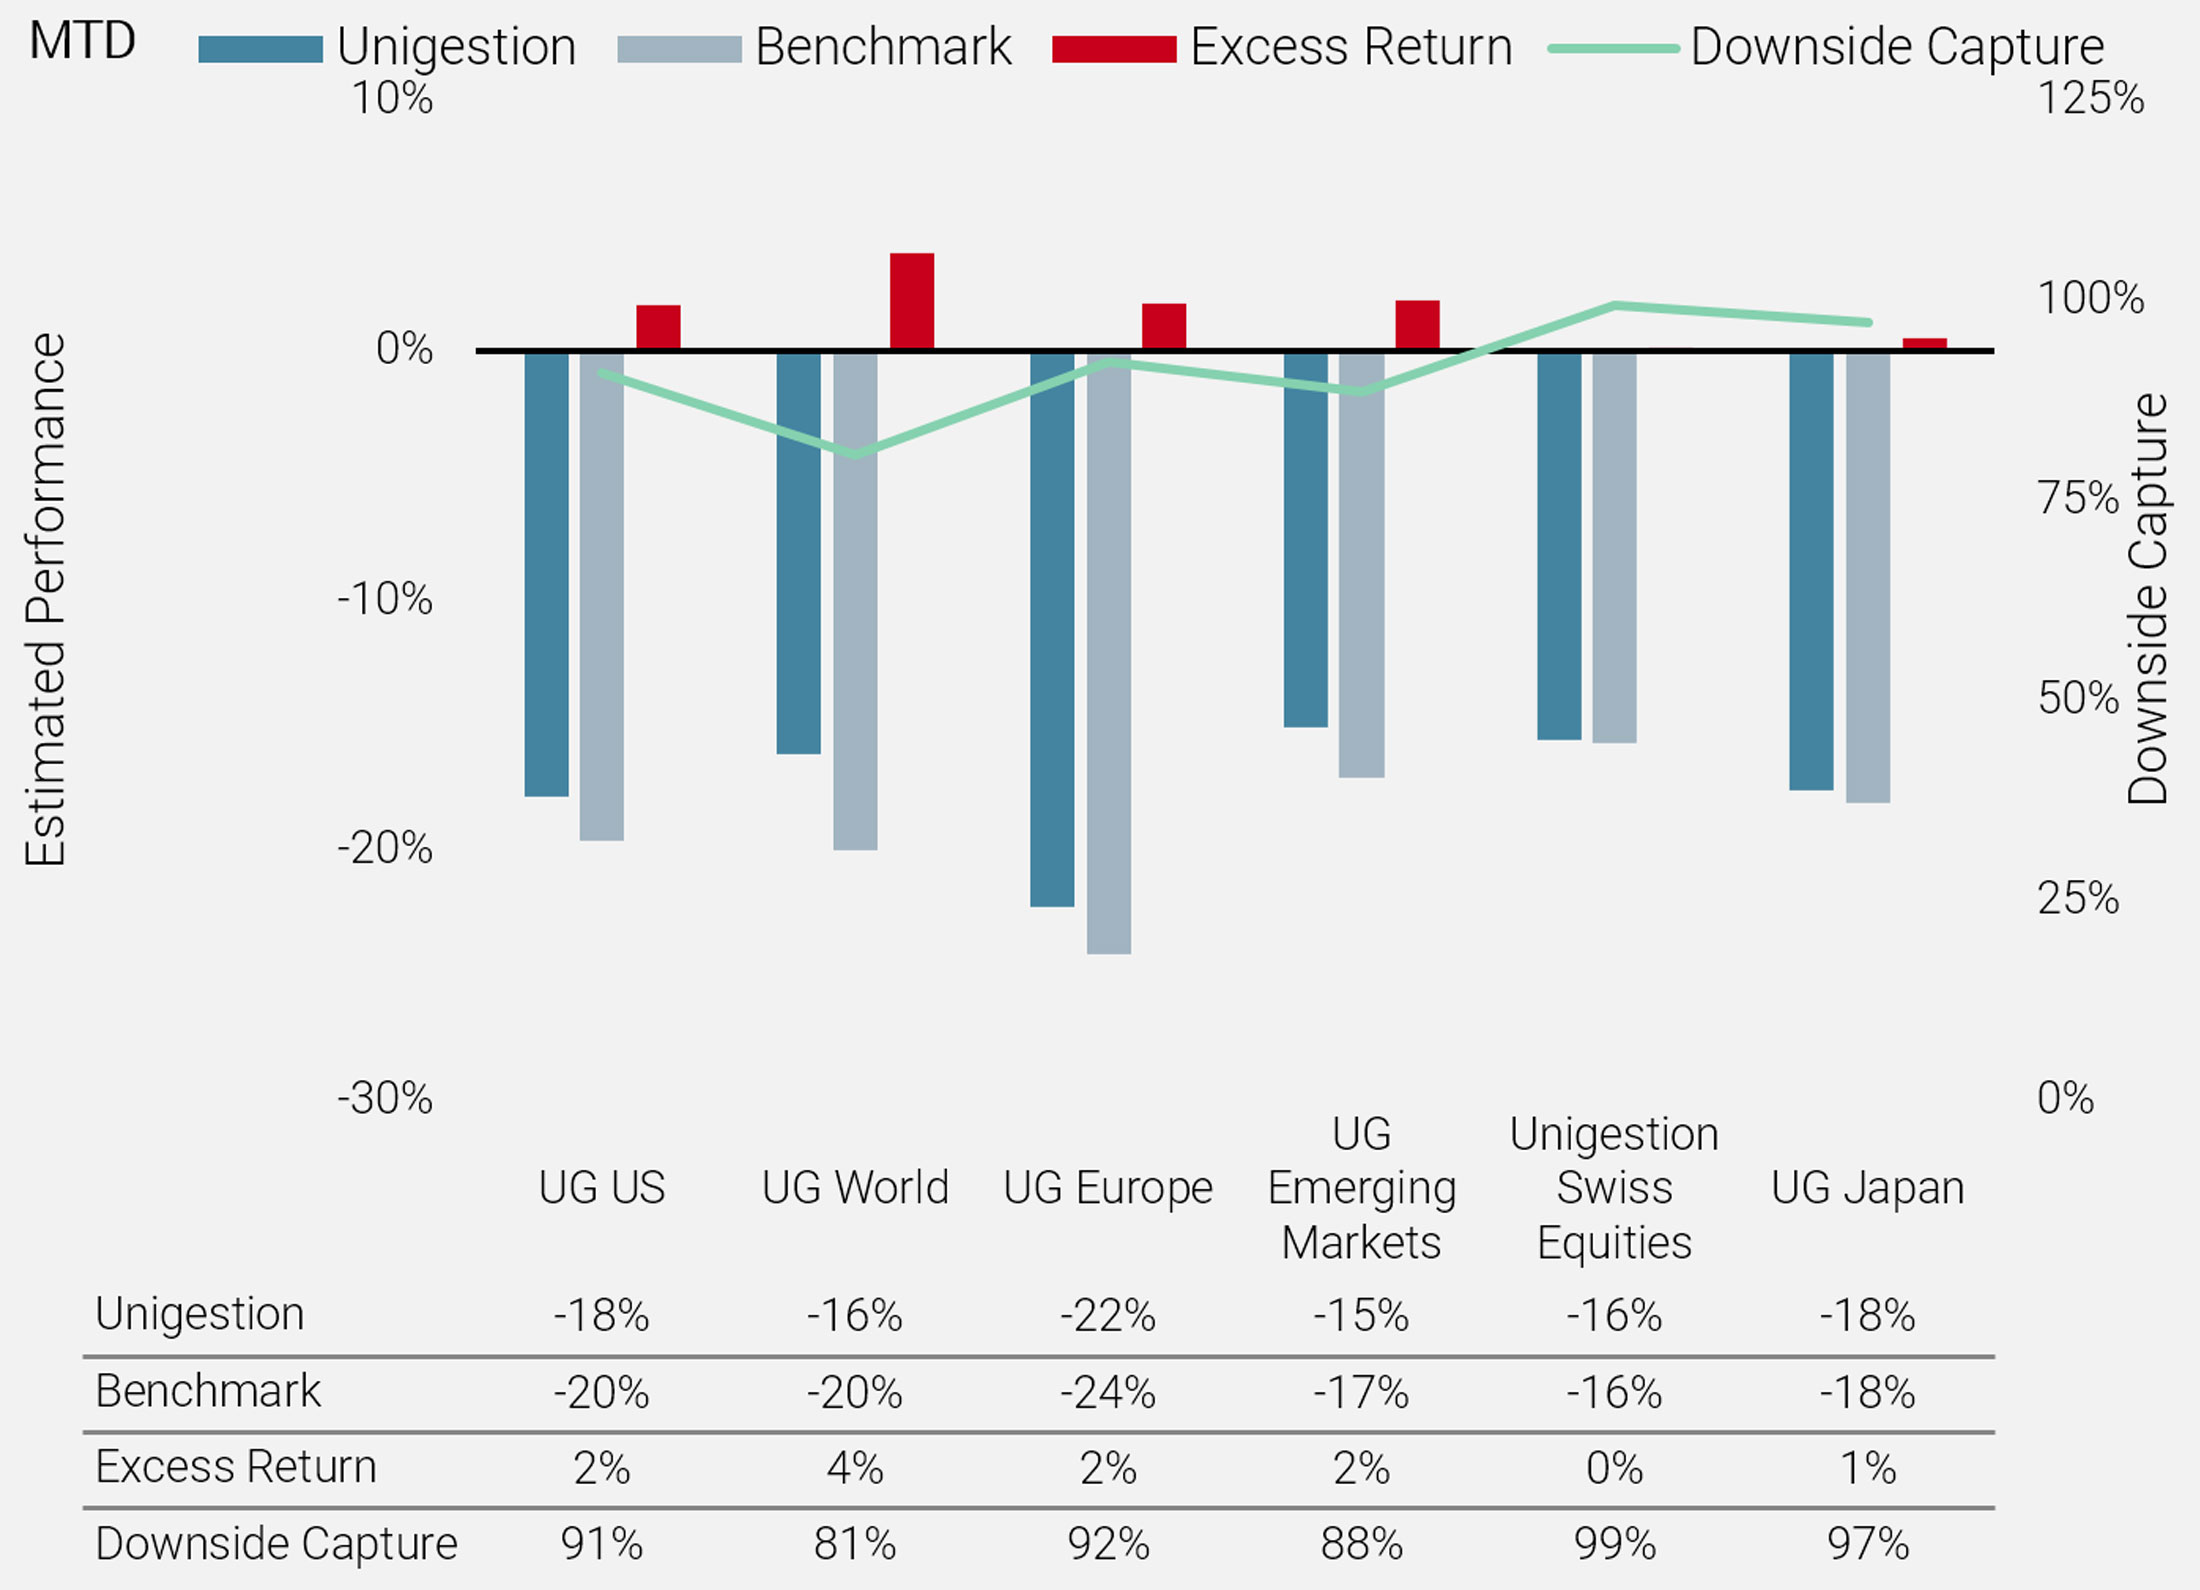
Figure 14: Estimated Year-to-Date Results – Flagship Strategies (As of March 16)
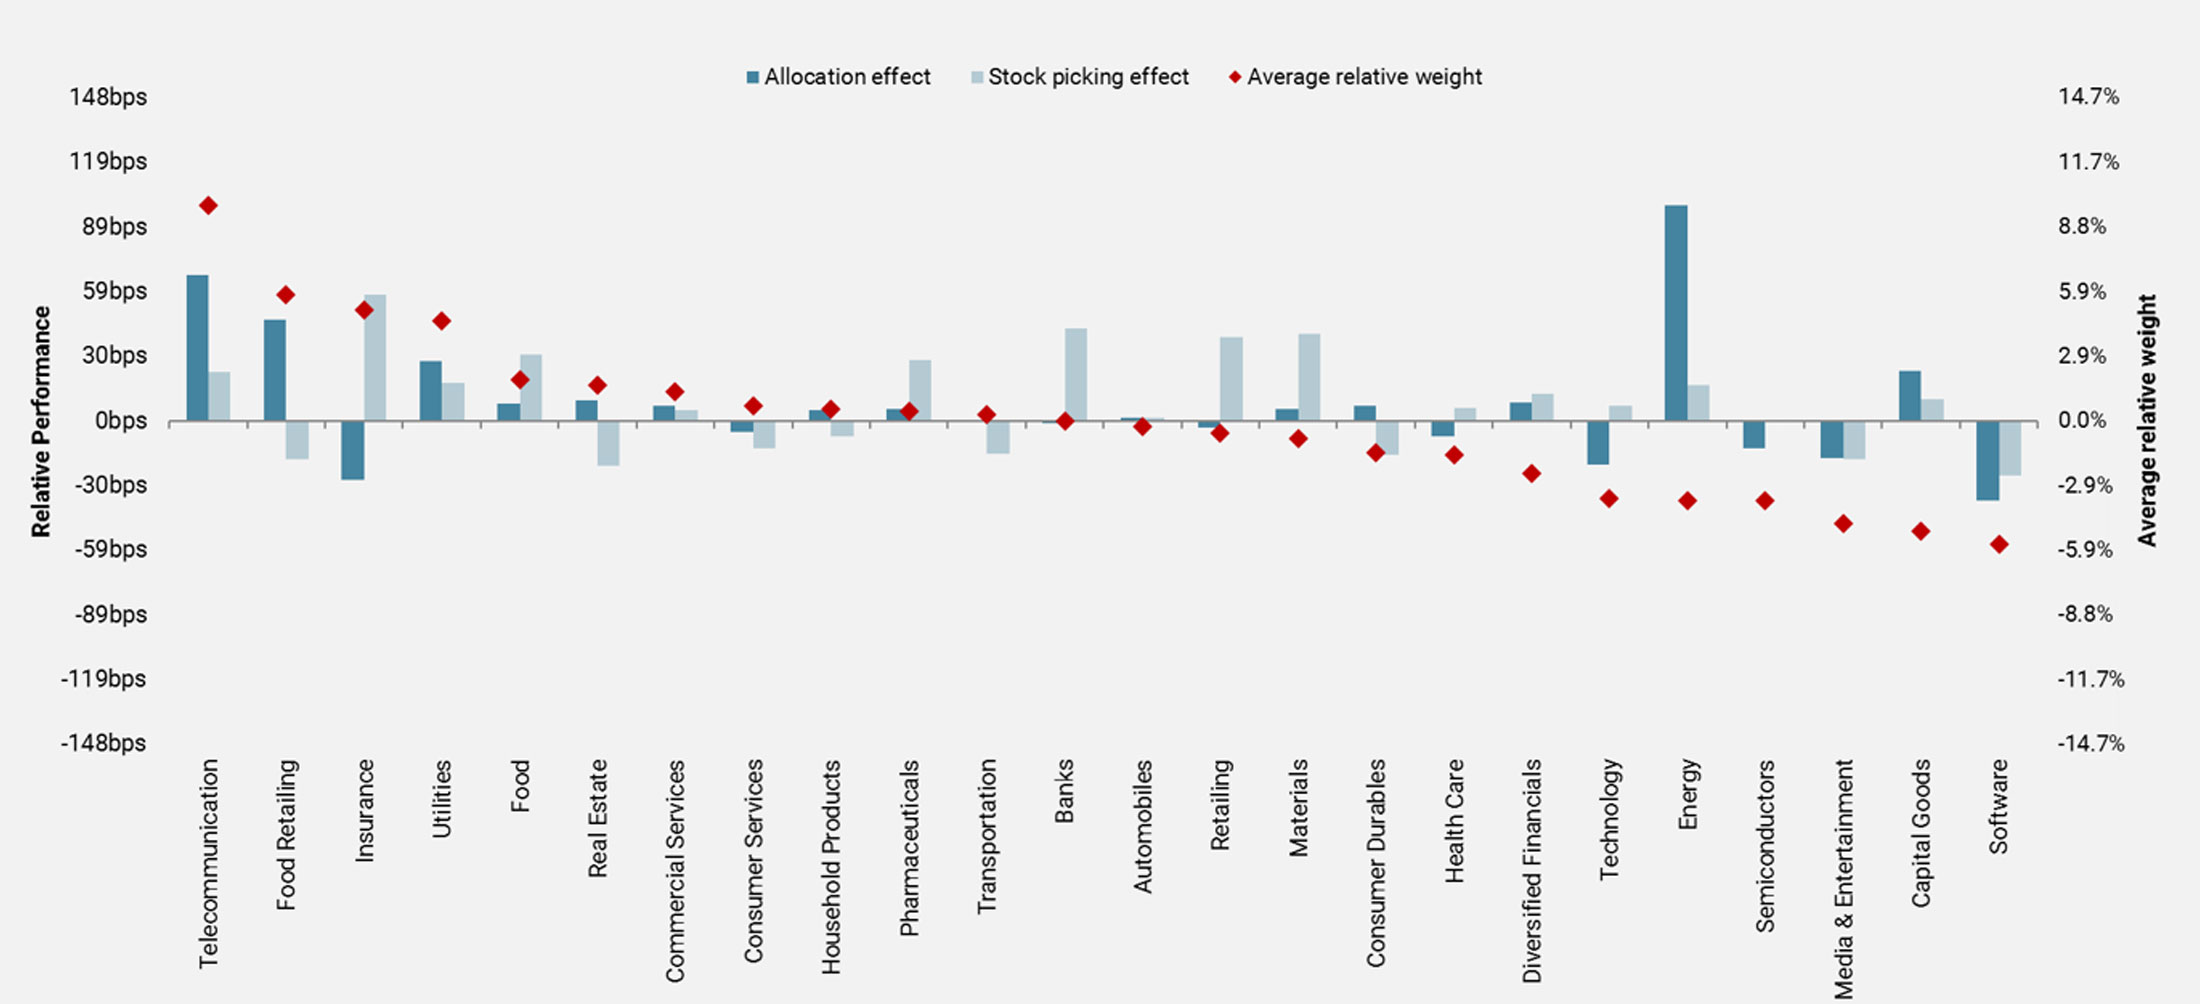
As an illustration of what drove the returns, Figure 15 shows the performance attribution for our global equity strategy and highlights how both our allocation and selection contributed positively. Our overweight allocations to telecommunications and utilities and an underweight in energy, were positive. In contrast, our underweight allocations to software and semiconductors proved to be a headwind.
Figure 15: Global Equity Strategy – Performance Attribution by Sector
Year-to-date performance has been helped by both allocation and selection.
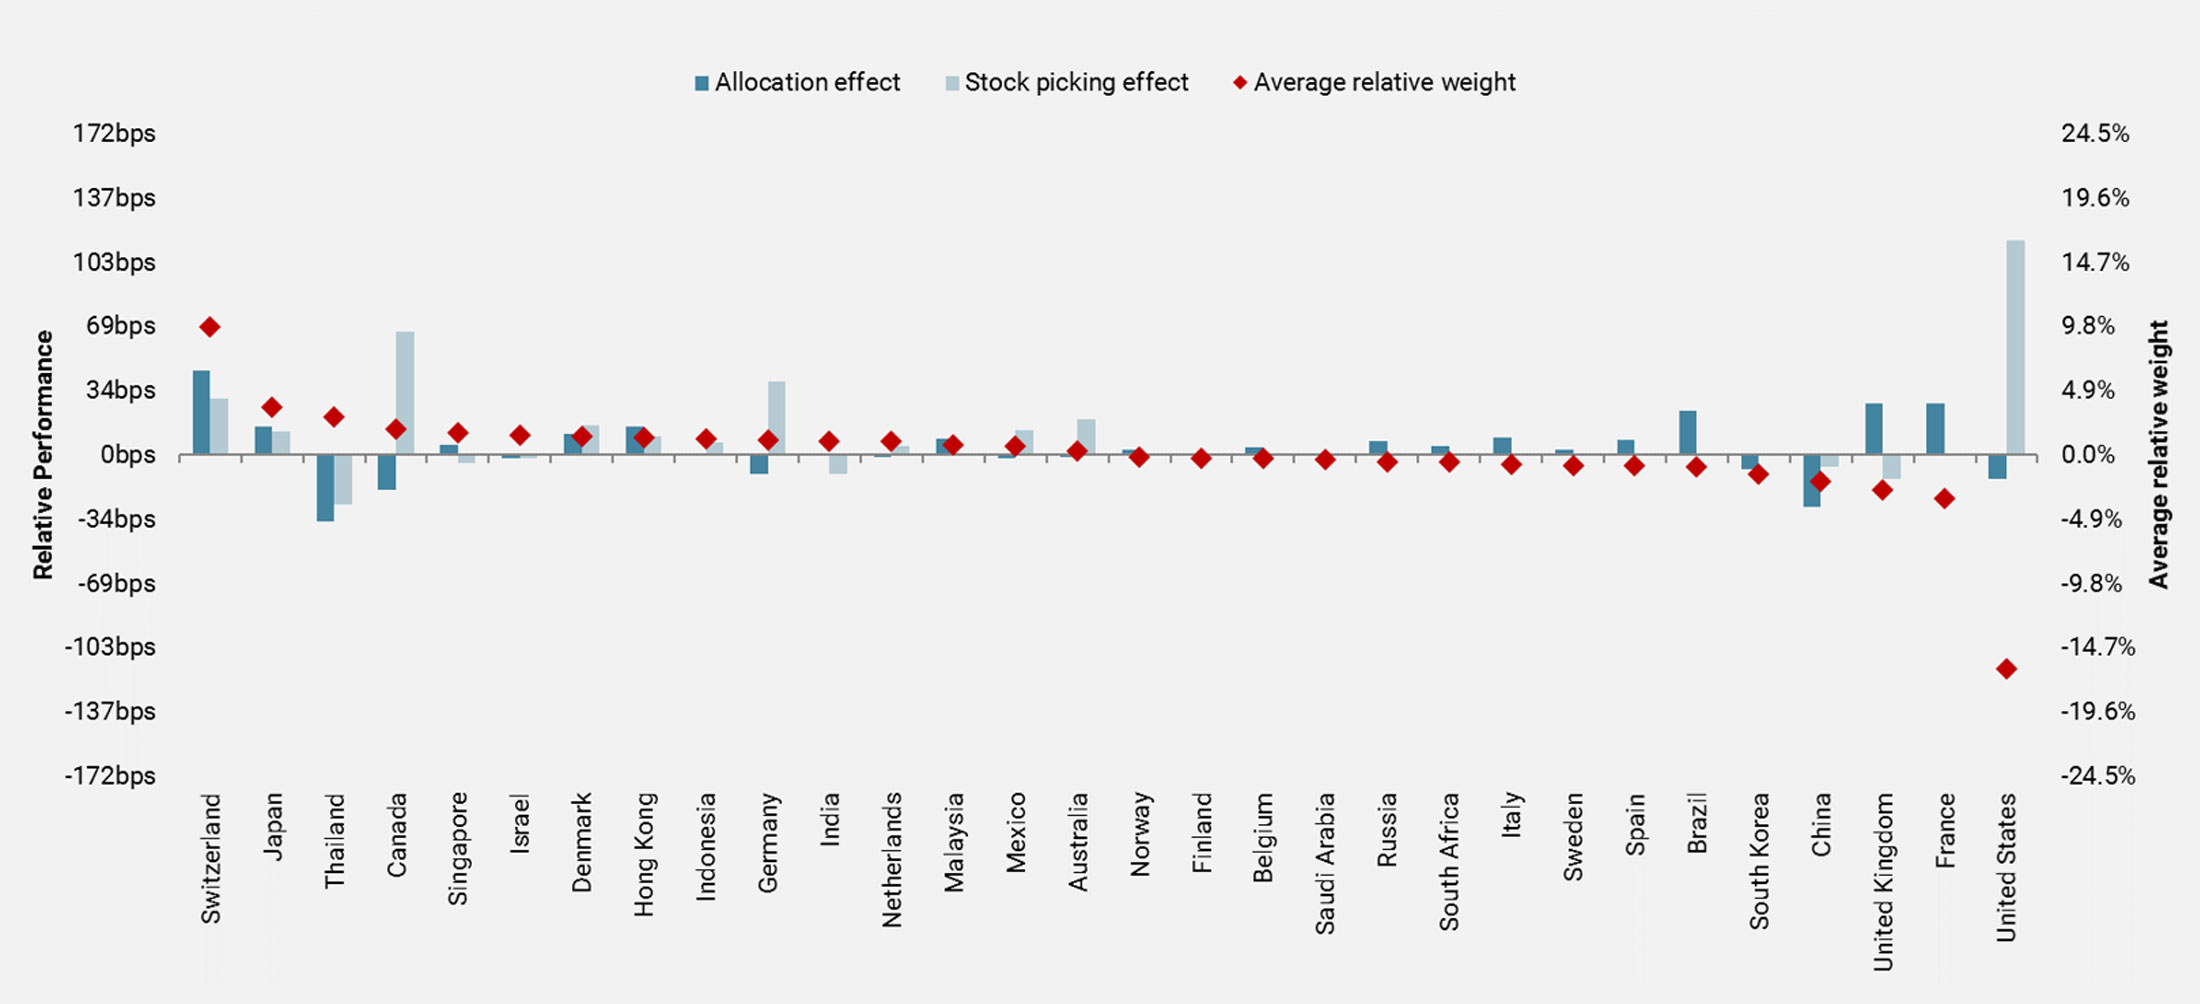
As Figure 16 shows, performance was also helped by our country allocation. Our overweight allocations to Switzerland and Denmark, coupled with our underweights to the UK, Brazil and France, contributed to performance. However, given the Thai economy’s dependence on tourism from China, our overweight allocation to the country, together with stock selection such as Kasikornbank (banks), was the main performance detractor over this volatile period. Finally our underweight to China, which has proved surprisingly resilient so far, has been a drag.
Figure 16: Global Equity Strategy – Performance Attribution by Country
Among stocks, overweighting Roche (pharmaceuticals, Switzerland), Pinnacle West Capital (utilities, US) and Novo Nordisk (pharmaceuticals, Denmark) contributed positively to performance.
Looking Ahead
In our view, the current sell-off was borne out of the combination of fears for expected future economic growth, extreme valuations and market specifics such as the weight of systematic and passive strategy positions. The number of people affected by the disease surged outside of Asia, meaningfully increasing the possibility of seeing the same type of massive quarantines that were implemented in China and jolting investors out of complacency. In Europe and the US, big corporations have advised their employees to avoid travelling for business, schools have closed, hotels have been quarantined and summits cancelled in a global effort to stop the propagation.
Our portfolios have shown some downside resilience and we expect them to provide even better protection over the longer term.
So far, our portfolios have shown some downside resilience and we expect them to provide even better protection over the longer term. During significant market corrections, dispersion usually remains low initially, as systematic de-risking negatively impacts all stocks indiscriminately. We expect more dispersion to materialise in the coming weeks should this correction persist, as stocks with more robust fundamentals and valuation levels should ultimately benefit from better investor confidence.
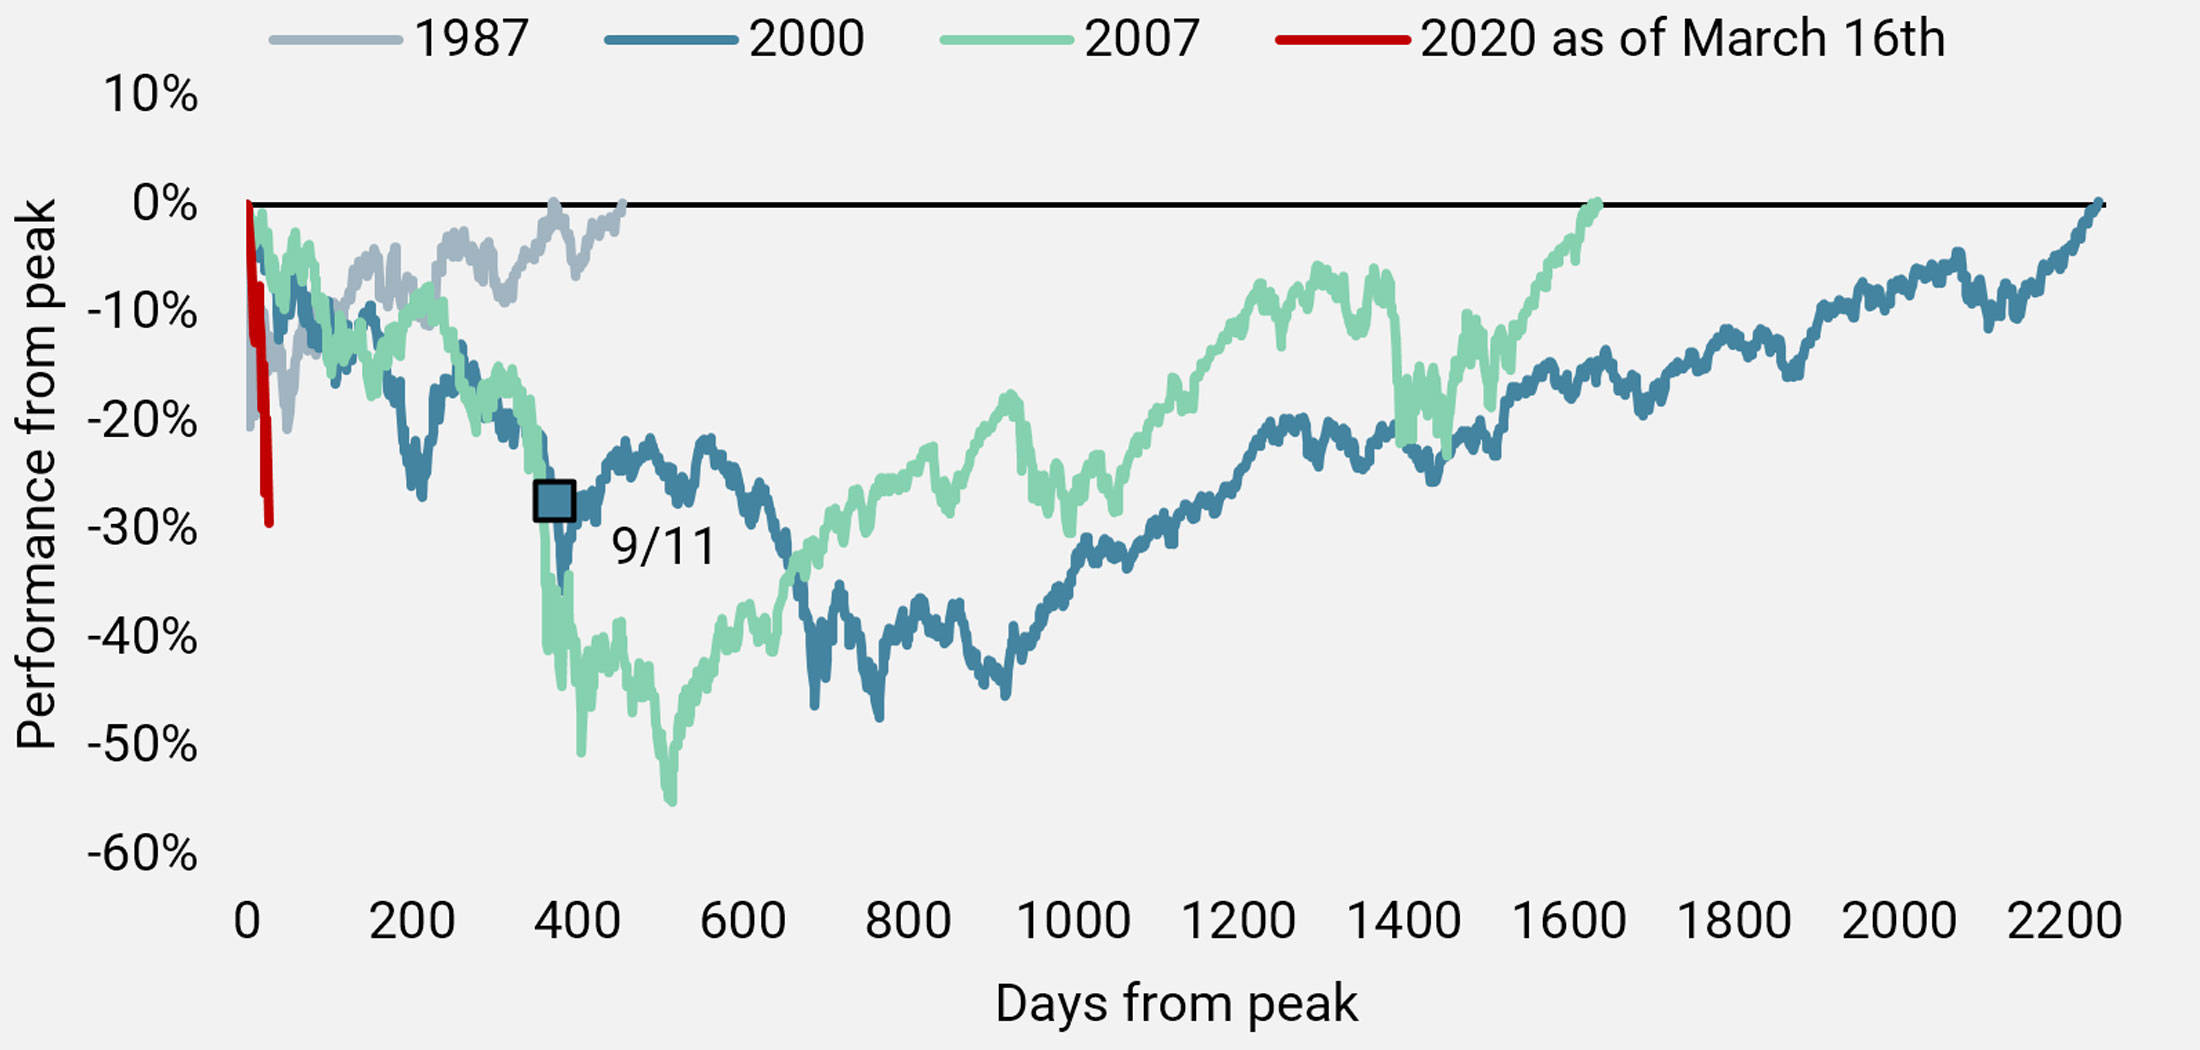
The current market drop overshoots market corrections we have seen so far, as illustrated in Figure 17, which is explaining a massive correlation on the downside and the relative lack of dispersion, hence less protection by our portfolios. If history is of any guidance, volatility could persist for many more months, with more dispersion in the future and some rebounds/range trading periods.
Figure 17: Equity Market Corrections: US (S&P 500 TR Index)
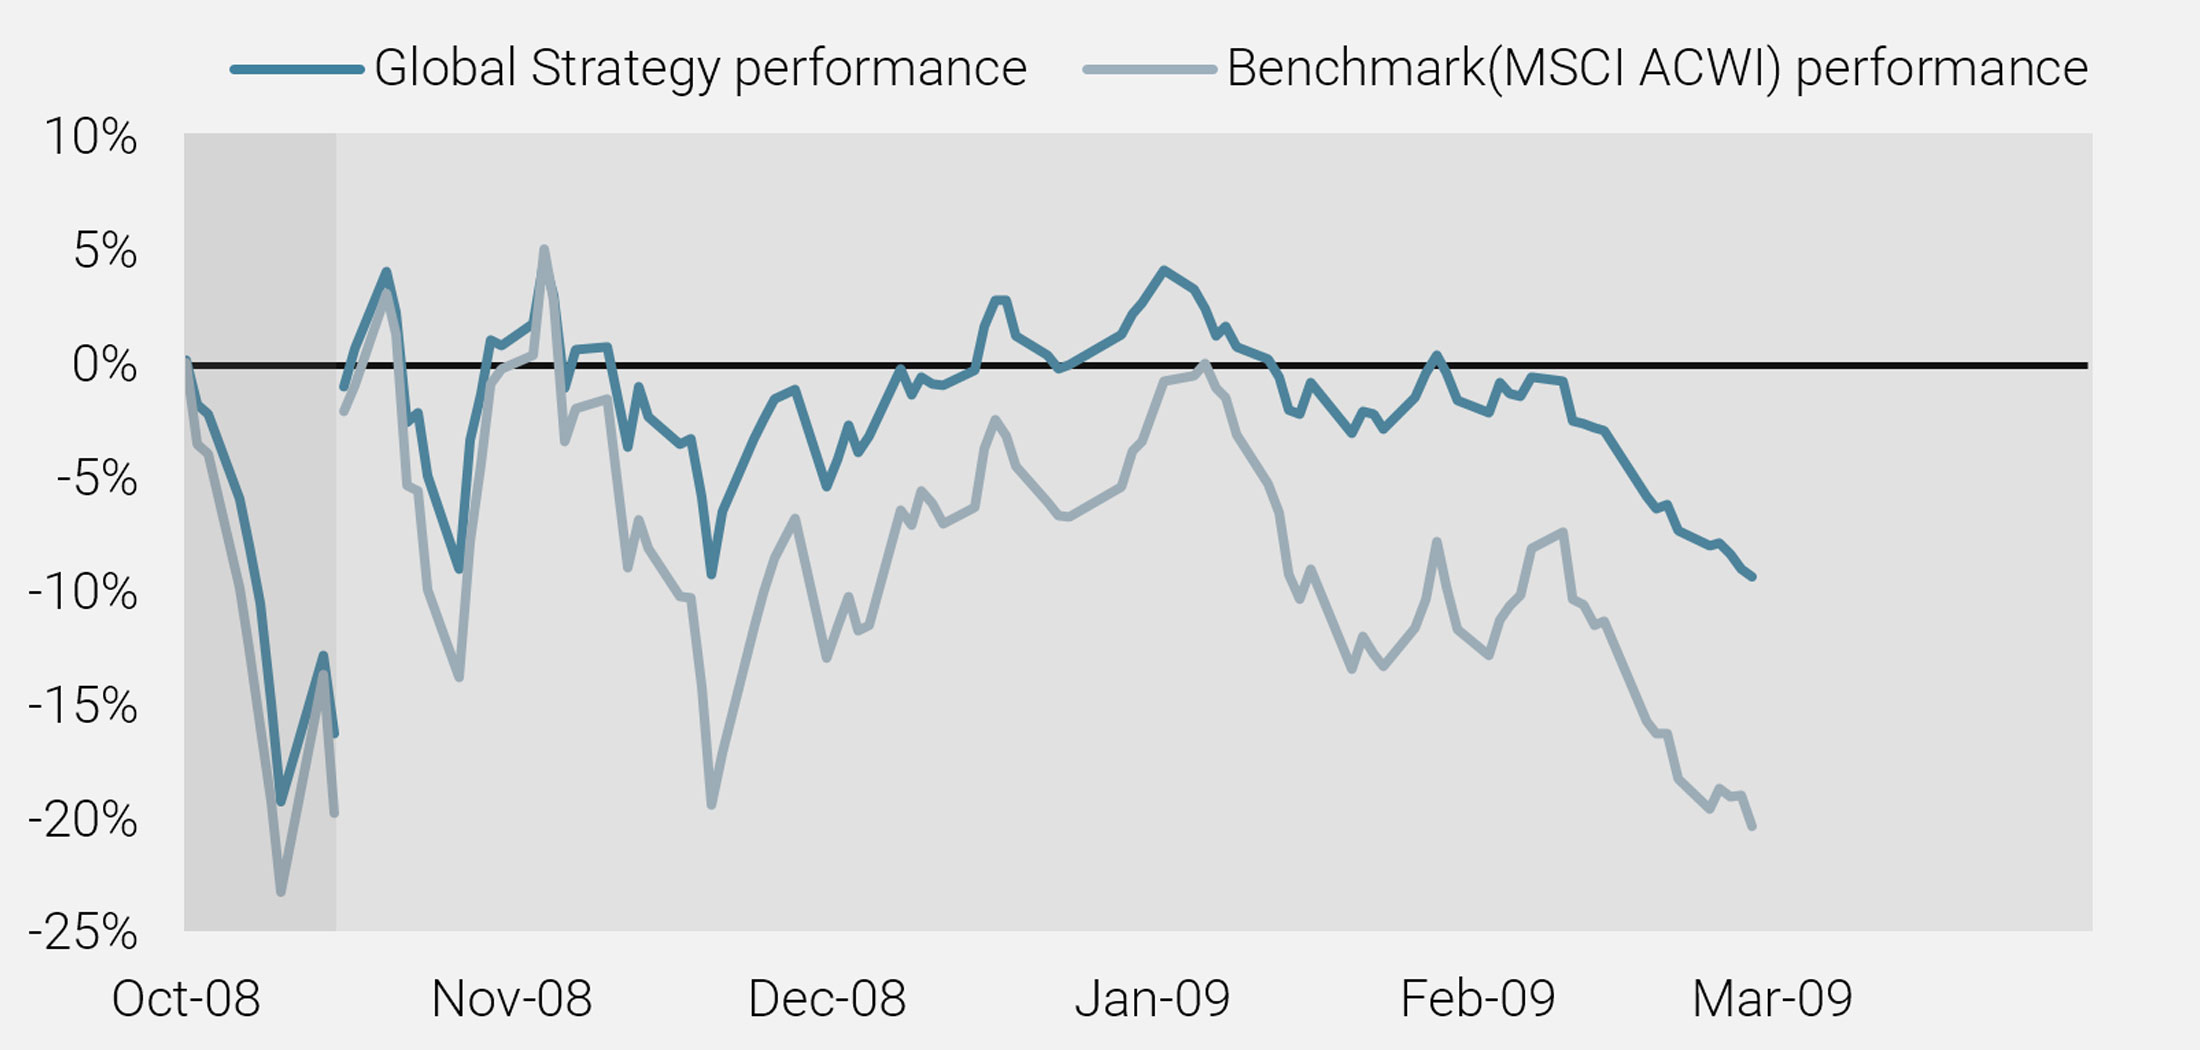
We witnessed similar behaviour in October 2008 from our global portfolio, when the strategy posted an initial downside capture above 85% while the market was losing more than 20%. The second leg of the drawdown, once market dispersion increased between winners and laggards, saw our strategy protect significantly on the downside, as shown in Figure 18. We expect equity markets to behave in a similar manner as the world moves into a general lockdown period.
Figure 18: Performance of our Global Risk-Managed Strategy During the 2008 Crisis
Within our equity portfolios, we are consistently implementing our risk-managed investment process, applying both quantitative and fundamental analysis to continuously monitor the risk from a stock, sector and country basis.
From a quantitative perspective, we make sure that our forward-looking volatility and correlation forecasts remain robust in the current environment. In particular: a) our in-house risk model is relying on a dynamic look-back period based on the current implied volatility level (VIX index) in order to best adapt to current market conditions. In the current environment, the look-back period tends to shorten which puts more emphasis on the current risk factors; b) we are closely monitoring our transaction cost model to make sure it accurately represents the current environment where spreads have increased dramatically.
From a fundamental perspective, we are focused on detecting stocks with new emerging risks linked to material exposure to international travel, oil, basic materials, discretionary consumption and growth. Another important risk indicator being monitored is the evolution of Credit Default Swap (CDS) spreads of countries and underlying portfolio stocks – these are indicative of the implied default probability.
Finally, yet just as importantly, we naturally pay high importance to valuation and the recent price dynamics of such stocks, in order to make sure that we can act before these risks are fully priced in.
Important Information
Past performance is no guide to the future, the value of investments, and the income from them change frequently, may fall as well as rise, there is no guarantee that your initial investment will be returned. This document has been prepared for your information only and must not be distributed, published, reproduced or disclosed (in whole or in part) by recipients to any other person without the prior written consent of Unigestion. It is neither directed to, nor intended for distribution or use by, any person or entity who is a citizen or resident of, or domiciled or located in, any locality, state, country or jurisdiction where such distribution, publication, availability or use would be contrary to law or regulation.
This is a promotional statement of our investment philosophy and services only in relation to the subject matter of this presentation. It constitutes neither investment advice nor recommendation. This document represents no offer, solicitation or suggestion of suitability to subscribe in either the investment vehicles to which it refers or to any securities or financial instruments described herein. Any such offer to sell or solicitation of an offer to purchase shall be made only by formal offering documents, which include, among others, a confidential offering memorandum, limited partnership agreement (if applicable), investment management agreement (if applicable), operating agreement (if applicable), and related subscription documents (if applicable). Such documentation contains additional information material to any decision to invest. Please contact your professional adviser/consultant before making an investment decision.
Where possible we aim to disclose the material risks pertinent to this document. The views expressed in this document do not purport to be a complete description of the securities, markets and developments referred to in it. Reference to specific securities should not be considered a recommendation to buy or sell. Unigestion maintains the right to delete or modify information without prior notice.
Investors shall conduct their own analysis of the risks (including any legal, regulatory, tax or other consequences) associated with an investment and should seek independent professional advice. Some of the investment strategies or financial instruments described or alluded to herein may be construed as high risk and not readily realisable investments, which may experience substantial and sudden losses including total loss of investment. These are not suitable for all types of investors. Unigestion has the ability in its sole discretion to change the strategies described herein.
To the extent that this report contains statements about the future, such statements are forward-looking and subject to a number of risks and uncertainties, including, but not limited to, the impact of competitive products, market acceptance risks and other risks. Actual results could differ materially from those in the forward-looking statements. As such, forward looking statements should not be relied upon for future returns. Targeted returns reflect subjective determinations by Unigestion based on a variety of factors, including, among others, internal modeling, investment strategy, prior performance of similar products (if any), volatility measures, risk tolerance and market conditions. Targeted returns are not intended to be actual performance and should not be relied upon as an indication of actual or future performance.
No separate verification has been made as to the accuracy or completeness of the information herein. Data and graphical information herein are for information only and may have been derived from third party sources. Unigestion takes reasonable steps to verify, but does not guarantee, the accuracy and completeness of information from third party sources. As a result, no representation or warranty, expressed or implied, is or will be made by Unigestion in this respect and no responsibility or liability is or will be accepted. All information provided here is subject to change without notice. It should only be considered current as of the date of publication without regard to the date on which you may access the information. Rates of exchange may cause the value of investments to go up or down. An investment with Unigestion, like all investments, contains risks, including total loss for the investor.
The performance figures are based on estimated fees and expenses as well as on the underlying strategy’s estimated performances given by fund managers, administrators, custodians and third party sources at a given date. Where performance is reflected gross of fees, potential investors should be aware that the inclusion of fees, costs and charges will reduce the overall value of performance. Unless otherwise stated, the performance data source are Unigestion, Bloomberg and Compustat.
This information is provided to you solely to give you background information relating to Unigestion, certain strategies it implements and currently offers. Before making an investment decision with respect to the strategy discussed herein, potential investors are advised to consult with their tax, legal, ERISA and financial advisors. Note that not all strategies may be available or suitable for investment by U.S. investors.
This document may contain forward-looking statements, including observations about markets and industry and regulatory trends as of the original date of this document. Forward-looking statements may be identified by, among other things, the use of words such as “expects,” “anticipates,” “believes,” or “estimates,” or the negatives of these terms, and similar expressions. Forward-looking statements reflect Unigestion’s views as of such date with respect to possible future events. Actual results could differ materially from those in the forward-looking statements as a result of factors beyond a strategy’s or Unigestion’s control. Readers are cautioned not to place undue reliance on such statements. No party has an obligation to update any of the forward-looking statements in this document.
Return targets or objectives, if any, are used for measurement or comparison purposes and only as a guideline for prospective investors to evaluate a particular investment program’s investment strategies and accompanying information. Performance may fluctuate, especially over short periods. Targeted returns should be evaluated over the time period indicated and not over shorter periods.
The past performance of Unigestion, its principals, shareholders, or employees is not indicative of future returns.
Except where otherwise specifically noted, the information contained herein, including performance data and assets under management, relates to the entire affiliated group of Unigestion entities over time including that of Unigestion UK. Such information is intended to provide the reader with background regarding the services, investment strategies and personnel of the Unigestion entities. No guarantee is made that all or any of the individuals involved in generating the performance on behalf the other Unigestion entities will be involved in managing any client account on behalf of Unigestion U.K. More specific information regarding Unigestion UK is set forth herein where indicated and is available on request.
There is no guarantee that Unigestion will be successful in achieving any investment objectives. An investment strategy contains risks, including the risk of complete loss.
The risk management practices and methods described herein are for illustrative purposes only and are subject to modification.