Investors are increasingly looking to incorporate ESG preferences into their investment strategies, yet the implications of doing so on portfolio efficiency and performance are not always clear. In this paper, we analyse the impact of integrating different ESG criteria within minimum variance strategies on their risk/return characteristics as well as country and sector allocation. While noting the limitations of backtesting in an ESG context, we show that incorporating both bottom-up and top-down ESG restrictions does not materially affect portfolio efficiency and can lead to improved risk-adjusted performance and downside protection. This means that investors can address their ESG preferences while still achieving their investment objectives.
Literature Review and General Theory
Unigestion has been an active proponent of responsible investing since 2004. We have introduced a number of initiatives and products, signed the United Nation’s Principles for Responsible Investment (UN PRI) in 2013 and significantly accelerated our SRI‑related activities since 2016. Today, socially responsible investment (SRI) is ingrained in everything we do, from the integration of the highest international standards into our investment processes for both standard and customised products, to the promotion of these practices internally and externally. As a UN PRI signatory, we are committed to adhering to the Principles as long as they are consistent with our fiduciary duties:
- We incorporate ESG criteria into our investment analysis and decision-making processes
- We are active owners and incorporate ESG issues into our ownership policies and practices
- We seek appropriate disclosure on ESG issues by the entities in which we invest
- We promote acceptance and implementation of the principles within the investment industry
- We work together to enhance our effectiveness in implementing the principles
- We report on our activities and progress towards implementing the principles
At Unigestion, we have performed long and detailed studies into the various ways ESG criteria could be integrated into investment strategies. We have researched the growing academic and industry literature on ESG investing and its effect on asset prices and asset allocation. For institutional investors looking to incorporate ESG considerations into their investment process and improve risk-adjusted returns, the recent literature suffers from several limitations that we note at the outset:
- First, the literature relies on historical data and historical relationships between asset prices and ESG metrics. To the extent that unanticipated technological and regulatory changes related to ESG will drive asset prices in the future, this implies that past empirical results are of limited use in the future.
- Second, most papers carry out correlation analyses between ESG ratings and stock returns or construction-optimised portfolios based on ESG ratings without explaining the economic transmission mechanisms that are behind the relationship between those ratings and future stock returns.
- Third, most institutional investors’ portfolios are global in nature, yet the majority of studies examine only US data. There are significant differences in ESG norms and preferences between different regions, such as the US and Scandinavia, for example, which make generalisations based on US data of limited use.
- Fourth, most studies consider ESG criteria at the stock level, whereas institutional investors typically also aim to arrive at aggregate portfolio-level ESG scores that account for a trade-off between ESG and other objectives.
- Finally, the portfolio rebalancing frequency of many institutional portfolio construction processes balances the timely use of new information and turnover costs, which implies that, in general, information is incorporated into the portfolio construction process quickly. Many ESG studies form portfolios at a relatively infrequent and, at times, annual frequency, which is not a good guide to how ESG metrics would affect portfolio construction in practice.
Many recent investor surveys show that the majority of institutional investors consider ESG criteria when constructing equity portfolios. Apart from ethical considerations, there are also strong commercial reasons for this. Hartzmark and Sussman (2019) show that ESG ratings have a statistically significant and causal effect on fund flows. They find that being categorised as low sustainability resulted in net fund outflows of more than USD 12 billion, while being categorised as high sustainability led to net inflows of more than USD 24 billion. However, the authors do not find evidence that high sustainability funds outperform low sustainability funds. The authors interpret their evidence as consistent with positive affect influencing expectations of sustainable fund performance and non-pecuniary motives influencing investment decisions.
As noted above, most papers on ESG focus on the correlation between ESG ratings and stock returns without explaining the economic transmission mechanisms behind the correlation. One exception is Giese et al (2017). The authors build on the notion of “transmission channels” within a standard discounted cash flow (DCF) model and distinguish a cash-flow channel, an idiosyncratic risk channel and a valuation channel. The authors find that for the two idiosyncratic transmission channels, high ESG-rated companies tended to show higher profitability, higher dividend yield and lower idiosyncratic tail risks. Moreover, high ESG-rated companies tended to show less systematic volatility, lower values for beta and higher valuations, which verifies the valuation channel.
Although the paper of Giese et al (2017) shows empirically the importance of different transmission channels from ESG ratings to stock performance, the authors do not provide a theoretical framework that helps to assess the costs and benefits of ESG investing. Pedersen, Fitzgibbons, and Pomorski (2019) develop just such a framework. The authors show that, theoretically, an investor optimally chooses a portfolio on the ESG-efficient frontier and that the portfolios that span the frontier are all combinations of the risk-free asset, the tangency portfolio, the minimum variance portfolio, and what we call the ESG-tangency portfolio (four-fund separation). Pedersen et al (2019) test the theory’s equilibrium predictions using four ESG proxies and offer a rationale for why certain ESG measures predict returns positively, while others predict returns negatively or close to zero.
In line with the theory of Giese et al (2017), Unigestion views ESG criteria as a source of risk. We believe that integrating ESG criteria into our investment processes is essential to better managing the risk of our investments. We approach ESG in the same way as all investment risk, carefully assessing the potential impacts and opportunities through a combination of systematic and discretionary analysis, research and monitoring. ESG criteria are naturally included in our 360° risk management process and therefore affect the way we select investments and build portfolios. In addition to traditional risk measures, such as fundamentals, volatility and liquidity, key considerations within our risk assessment also include ESG characteristics of companies, their carbon footprint as well as potential controversies.
ESG Integration: What are the Various Possibilities?
There are no official classifications of the ways in which ESG criteria may be incorporated into investment strategies. However, academic papers, such as Amel-Zadeh, and Serafeim (2018), CFA Institute (2015), and GSIA (2016), have identified six possible ESG applications, as follows:
- Norm-based Screening: The exclusion of instruments associated with key social or environmental issues. According to the European Sustainable Investment Forum, it is the “screening of investments according to their compliance with international standards and norms”.
- Negative or Exclusionary Screening: The exclusion of instruments from an investment universe based on our expectations regarding specific ESG-related risks.
- Positive or Best-in-Class Screening: Investment in sectors or instruments selected for positive ESG criteria.
- Integration: Systematic incorporation of ESG criteria within investment strategies, which usually appears as tilt to instrument allocations depending on the ESG criteria in comparison to peers.
- Impact or Thematic: Investing in assets related to sustainability themes (such as clean water projects and green energy).
- Active Ownership: Actively exercising shareholders’ rights to influence corporate behaviour in the following ways:
-
- Proxy voting on behalf of shareholders, which is one of the most important features in corporate governance.
- Individual Corporate Engagement: direct communication with a company’s board, on behalf of shareholders, regarding specific issues or activities.
- Collaborative Corporate Engagement: joint communication with a company’s board, on behalf of shareholders, regarding specific issues or activities, by a group of investors with mutual interests.
-
Unigestion’s Approach
We believe that applying a combination of the above is the most efficient way to manage broad strategies according to ESG criteria. However, we identify Best-in-Class screening and Impact-Investing to be more suitable for investments with a limited number of instruments and/or purpose-focused funds that serve a specific set of preferences.
We therefore incorporate the following ESG criteria into our standard equities investment process:
1. Norm-based Screening
-
- Controversial Weapons: we do not invest in companies that are involved in the production or distribution of controversial weapons (anti-personnel mines, cluster munitions, chemical and biological weapons, depleted uranium ammunitions and nuclear weapons), as defined by UN conventions. These weapons are recognised as illegal by international conventions such as the Ottawa Treaty, which prohibits landmines.
We also believe that the following companies represent high financial, compliance and reputational risks and therefore exclude them from our investment universe across the firm: - Tobacco Producers: We view the sector as unethical because it profits from harmful activities. There is growing pressure from the World Health Organisation Framework Convention on Tobacco Control and other institutions to develop legislation to reduce the number of smokers. The UN Global Compact excluded tobacco companies in 2017. From a business point of view, tobacco is suffering from declining sales in combustibles (traditional cigarettes). Next-generation products are failing to offset this trend despite lower margins and they carry potential health risks as well. Given high reputational and litigation risk, and acknowledging that engagement is not likely to lead to any changes, we exclude all tobacco producers from our investment universe.
- Adult Entertainment Producers: We recognise that this sector is deemed unethical in many instances and it may profit from harmful activities.
- Thermal Coal: We exclude these companies in line with the aims of the Paris Agreement in an effort to reduce greenhouse gas emissions.
- Controversial Weapons: we do not invest in companies that are involved in the production or distribution of controversial weapons (anti-personnel mines, cluster munitions, chemical and biological weapons, depleted uranium ammunitions and nuclear weapons), as defined by UN conventions. These weapons are recognised as illegal by international conventions such as the Ottawa Treaty, which prohibits landmines.
2. Negative or Exclusionary Screening
-
- Non-covered Companies: We exclude from the investment universe companies that are not covered by ESG scores.
- Worst-in-class Companies: We favour companies with good or improving ESG scores. In general, we aim to exclude companies with ESG scores ranked in the worst decile of the universe. However, we value the efforts made by companies in the worst decile of the universe to improve their ESG score and so we do not exclude companies that show improvements over the last three years.
- High Carbon Emitters: We recognise climate-related risks as part of each company’s risk profile and exclude any company with a carbon footprint of more than 3,000 tonnes of CO2/USD million in revenues.
3. Integration
-
- ESG Risk Control: We require our portfolios to maintain an ESG score that is at least 10 points higher than the market reference on an ongoing basis. This is achieved through a positive tilt to equities with better ESG scores and a negative tilt to the ones with the worst ESG scores.
- Carbon Footprint Risk Control: We require our portfolios to maintain a carbon footprint at most 20% less than the market reference on an ongoing basis.
4. Active Ownership
We believe that active ownership is one of the most important fiduciary duties of any investment manager. Although these efforts may not directly affect the quantified ESG score of the investment, ultimately they are likely to influence corporate governance issues and therefore have an indirect influence on the investment. We exercise our shareholders’ rights through proxy voting carried out by ISS. We also directly engage with companies on a variety of issues relating to directorship, reorganisation and mergers, health and environment, and social and corporate governance. Moreover, as we believe collective action by investors with mutual interests can enhance engagement efforts, we participate in various collaborative corporate engagements, such as:
- PRI’s Investor Expectations Statement on Climate Change for Airlines and Aerospace Companies in 2019
- PRI-led Oil & Gas Collaborative Engagement in 2018
- Climate Action 100+ in 2017
- Corporate Carbon Footprint Disclosure Engagement in 2016
Empirical Results in a Generic Minimum Variance Set-up
In this section, we investigate the impact of integrating ESG criteria within minimum variance strategies, how they can affect the risk/return profile and the potential trade-offs. In order to do so, we start with a base case generic minimum variance portfolio (MVP BC) and we study the incorporation of ESG criteria in the form of the following three different steps:
1. Bottom-up exclusions: Norm-based and exclusionary screenings, as explained above (MVP BU)
2. Top-down guidelines (MVP TD x):
-
- Carbon footprint maximum 20% below the market reference
- ESG risk control x points above the market reference
3. Bottom-up exclusions (1) and top-down guidelines (2) combined (MVP ESG x)
To construct the minimum variance portfolio, a range of assumptions are required including the investment universe, the period and the constraints that the optimisation is subject to. For our study, the investment universe, as well as the reference index is the MSCI AC World (ACWI). The sample period is from 31 December 2010 to 31 March 2020. We note that the choice of sample period may imply a bias regarding topics that were not in the scope of exclusions in the past and were presented as having material ESG risk later on, such as tobacco producers..
For the purpose of these analyses, we have employed our internal ESG score, which is composed of a combination of indicators and methodologies from various external data providers, such as Sustainalytics, Vigeo Eiris and Trucost. Moreover, we incorporate our global views in terms of ESG criteria allocation, our fundamental analysts’ views regarding stocks (where applicable), as well as specific considerations when dealing with controversies. Hereafter, ‘ESG score’ refers to Unigestion’s internal score, which is expressed in rank format ranging from 0 to 100. As an example, for the MPV TD 10 portfolio, the top-down risk control x is set to 10, which means that, if the market reference has an overall weighted average score of 50, the portfolio is required to have a score of at least 60 (50+x=50+10=60). In addition, the carbon footprint guideline is based on the carbon intensity direct and first tier indirect (tonnes CO2/USD million) metrics provided by Trucost. For example, if the market reference has an overall weighted average footprint of 200, the portfolio is required to have a score of at most 160 (200×(1-20%)=160).
Finally, we impose a further set of realistic constraints as part of our backtest assumptions. To avoid small immaterial positions and control transaction costs, we require the minimum position threshold to be 10 basis points. To ensure diversification, we set the maximum weight per stock to 5% and the maximum GICS Level 1 (sector) allocation to 30%. For liquidity and transaction cost model calculations, we assume that the size of the portfolio is USD 3 billion in terms of assets under management (AUM). Lastly, to allow for comparability between countries, performance is calculated in USD.
Figure 1 shows summary statistics for the out-of-sample performance of the portfolios under different ESG criteria implementation assumptions (1–3) described above.
Figure 1: Statistics (Annualised) of Various Minimum Variance Portfolios with Different ESG Criteria
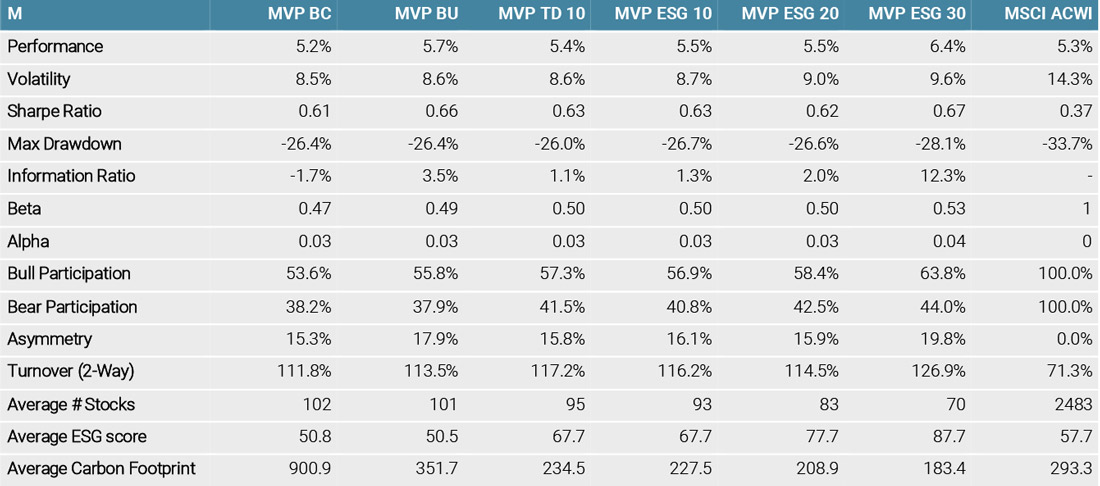
Figure 1 shows that the bottom-up exclusions (BU), the top-down control (TD) and the combination of the two (ESG x) up to x = 30 do not change the overall risk/return profile of the minimum variance portfolios (MVPs) materially. In fact, there is evidence that compared to the base case (BC), ESG x reduces maximum drawdown and improves both information ratios and the asymmetry characteristics. We note that the beta of the portfolio increases slightly with the addition of ESG criteria from 0.47 in the base case to 0.50 for the ESG 10 case that we currently implement in our standard portfolios. As we would expect, the realised portfolio turnover increases as we raise the threshold of the ESG criteria x. Similarly, consistent with our expectations, the average number of stocks falls as we tighten the guidelines and reduce the set of admissible investments. The asymmetry metric measures the difference between the bull and bear market participation. It improves mainly due to bottom-up restrictions. The participation in both bull and bear markets increases by introducing both bottom-up and top-down exclusions. However, the improvement in bull participation is more than the deterioration due to bear participation.
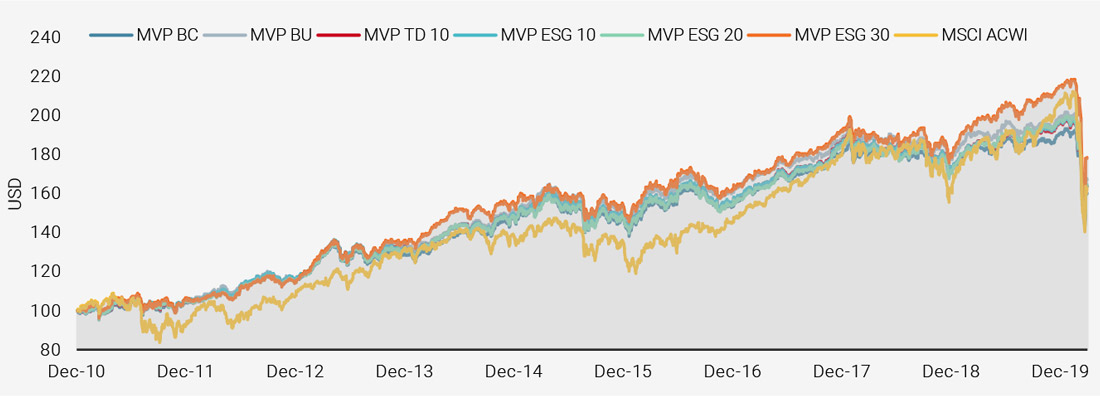
Figure 2 shows the historical performance of the different MVPs in terms of cumulative growth of USD 100, starting in December 2010. We observe that the base line portfolio (MVP BC) is at the bottom of the chart most of the time. This suggests that the inclusion of ESG preferences does not sacrifice portfolio performance. In fact, the portfolio with the strictest ESG criteria (ESG x=30) generates the strongest performance. At Unigestion, we chose to implement the lighter ESG x=10 approach as a first step in implementing the new ESG methodology. Based on our quantitative analysis and experience with the ratings, we may consider increasing the ESG threshold further in the future since portfolio efficiency does not seem to deteriorate, while the ESG characteristics of the portfolio improve.
Figure 2: Historical Track Records of Various Minimum Variance Portfolios with Different ESG Criteria
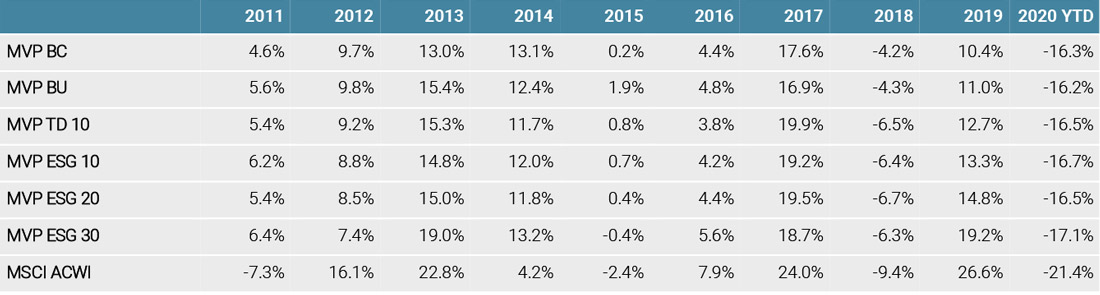
To examine the robustness of our conclusions, we carry out a sub-sample analysis below. Figure 3 reports the annual performance of the different ESG implementations (1–3). We see that the minimum variance portfolios generally move in lock step and provide downside protection with either positive or smaller negative performance than the market capitalisation benchmark in years when the MSCI ACWI declines (2011, 2015, and 2018). Overall, the addition of ESG preferences does not lead to a deterioration in performance.
Figure 3: Annual Performance of Various Minimum Variance Portfolios with Different ESG Criteria
The realised annualised performance and volatility in Figure 1 and 3 are stable, with a slight increase with implementing each layer of ESG criteria up to level 30 versus the market reference. However, the relationship between ESG principles, performance and risk needs to be interpreted with caution. This is because many of the negative ESG criteria known and commonly used today were developed with the benefit of hindsight and the knowledge of their historical impact in terms of environmental, social or governance risks. While their impact on performance is positive in the backtests, some of these ESG definitions have been backfilled in the past, thus potentially overestimating their impact in the future. In general, for the reasons mentioned in earlier, we do not expect ESG criteria to be a source of return. Rather, we expect controlling ESG risk to aid us in reducing overall portfolio risk over the long term.
To better understand the impact of ESG considerations on the portfolios, Figure 4 shows the average country allocation for the different minimum variance portfolios as well as the benchmark. We note that the average country allocation is relatively stable. It is only at an ESG threshold level x=30 that some allocation changes become apparent.
Figure 4: Average Country Allocation of Various Minimum Variance Portfolios with Different ESG Criteria
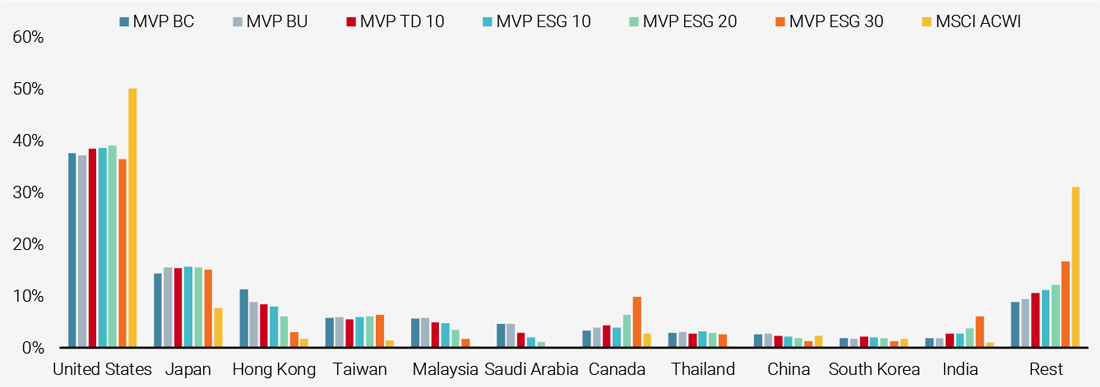
The above suggests that each country has stocks with relatively similar risk-adjusted return and ESG criteria so that tightening the ESG preferences does not have a significant effect on the country allocations. We would, however, not expect the same conclusion when we move from an analysis of country allocations to sector allocations. Some sectors, such as Utilities for example, have very significant environmental risks compared to others.
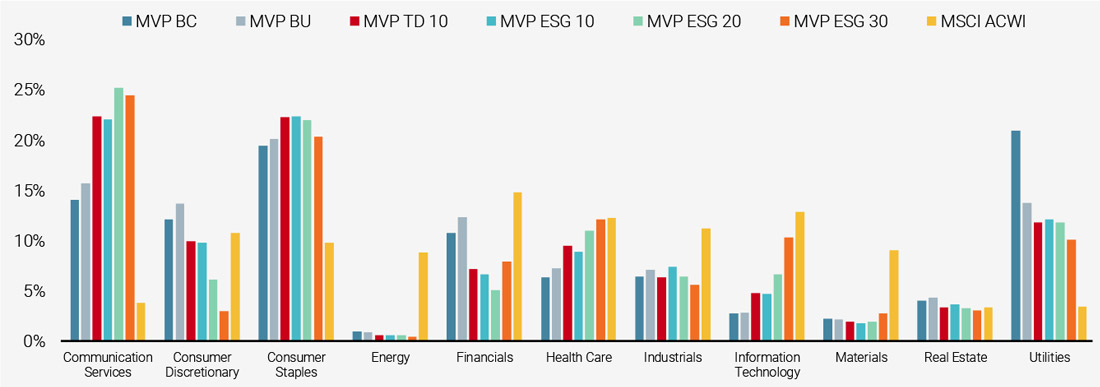
Figure 5 reports the sector allocations for the different minimum variance portfolios as well as the benchmark. Average sector allocation over time is relatively stable. The biggest change in sector allocation comes from bottom-up filtering, which has a significant impact on Utilities. In addition, we observe major changes due to tightening the top-down criteria in the reduction in Consumer Discretionary versus an increase in Communication Services and Information Technology.
Figure 5: Average Sector Allocation of Various Minimum Variance Portfolios with Different ESG Criteria
Conclusion
In this study, we have examined the impact of the implementation of different ESG criteria on the portfolio construction process of so-called low risk or minimum variance portfolios. We noted the limitations of such backtests from the outset in terms of their ability to forecast future performance. We again stress that our analysis of the economic mechanism governing the effect of ESG criteria on portfolios would indicate that ESG integration can be beneficial for long-term risk, but we do not support a positive or negative relationship between ESG criteria and performance in theory. Our analysis shows that adding both bottom-up and top‑down ESG restrictions into the portfolio construction process under realistic transaction costs and liquidity assumptions does not change the efficiency of the portfolio in an economically significant way. On the contrary, there is evidence of a slight improvement of the risk-adjusted performance and downside protection offered by minimum variance portfolios with additional ESG risk considerations. This means that investors can achieve their objectives in terms of both risk and performance, while at the same time addressing their ESG preferences.
References
Amel-Zadeh, A. and G. Serafeim, Why and How Investors Use ESG Information: Evidence from a Global Survey, Financial Analysts Journal, 2018, Volume 74 Issue 3, pp. 87–103.
CFA Institute, 2015, Environmental, Social, and Governance Issues in Investing: A Guide for Investment Professionals, 1–43.
Hartzmark, S.M. and A. B. Sussman, Do Investors Value Sustainability? A Natural Experiment Examining Ranking and Fund Flows, Journal of Finance, Forthcoming.
Giese, G., Lee, L.-E., Melas, D., Nagy, Z and L. Nishikawa, Foundations of ESG Investing, Part 1: How ESG Affects Equity Valuation, Risk and Performance, 2017, MSCI.
Global Sustainable Investment Alliance (GSIA), 2016, Global Sustainable Investment Review 2016.
Pedersen, L. H., Fitzgibbons, S. and Pomorski, L., Responsible Investing: The ESG-Efficient Frontier (October 1, 2019). Available at SSRN: https://ssrn.com/abstract=3466417 or http://dx.doi.org/10.2139/ssrn.3466417
Berg, Florian, Julian F. Koelbel, and Roberto Rigobon, Aggregate Confusion: The Divergence of ESG Ratings, MIT Sloan Working Paper 5822-19. Cambridge, MA: MIT Sloan School of Management, August 2019.
Cao, Jie and Titman, Sheridan and Zhan, Xintong and Zhang, Weiming Elaine, ESG Preference and Market Efficiency: Evidence from Mispricing and Institutional Trading (March 12, 2019). Available at SSRN: https://ssrn.com/abstract=3353623
Chan, Ying and Hogan, Ked and Schwaiger, Katharina and Ang, Andrew, ESG in Factors (January 19, 2020). Available at SSRN: https://ssrn.com/abstract=3522354 or http://dx.doi.org/10.2139/ssrn.3522354
Chaudhry, Hanif, Summer, Shah and Kolanovic (2019) ESG– Environmental, Social & Governance Investing What’s the best way to invest in ESG?
Li, F. and A. Polychronopoulos, 2020, What a Difference an ESG Ratings Provider Makes!, available at www.researchaffiliates.com/esg
Important Information
Past performance is no guide to the future, the value of investments, and the income from them change frequently, may fall as well as rise, there is no guarantee that your initial investment will be returned. This document has been prepared for your information only and must not be distributed, published, reproduced or disclosed (in whole or in part) by recipients to any other person without the prior written consent of Unigestion. It is neither directed to, nor intended for distribution or use by, any person or entity who is a citizen or resident of, or domiciled or located in, any locality, state, country or jurisdiction where such distribution, publication, availability or use would be contrary to law or regulation. This is a promotional statement of our investment philosophy and services only in relation to the subject matter of this presentation. It constitutes neither investment advice nor recommendation. This document represents no offer, solicitation or suggestion of suitability to subscribe in either the investment vehicles to which it refers or to any securities or financial instruments described herein. Any such offer to sell or solicitation of an offer to purchase shall be made only by formal offering documents, which include, among others, a confidential offering memorandum, limited partnership agreement (if applicable), investment management agreement (if applicable), operating agreement (if applicable), and related subscription documents (if applicable). Such documentation contains additional information material to any decision to invest. Please contact your professional adviser/consultant before making an investment decision.
Where possible we aim to disclose the material risks pertinent to this document. The views expressed in this document do not purport to be a complete description of the securities, markets and developments referred to in it. Reference to specific securities should not be considered a recommendation to buy or sell. Unigestion maintains the right to delete or modify information without prior notice.
Investors shall conduct their own analysis of the risks (including any legal, regulatory, tax or other consequences) associated with an investment and should seek independent professional advice. Some of the investment strategies or financial instruments described or alluded to herein may be construed as high risk and not readily realisable investments, which may experience substantial and sudden losses including total loss of investment. These are not suitable for all types of investors. Unigestion has the ability in its sole discretion to change the strategies described herein.
To the extent that this report contains statements about the future, such statements are forward-looking and subject to a number of risks and uncertainties, including, but not limited to, the impact of competitive products, market acceptance risks and other risks. Actual results could differ materially from those in the forward-looking statements. As such, forward looking statements should not be relied upon for future returns. Targeted returns reflect subjective determinations by Unigestion based on a variety of factors, including, among others, internal modeling, investment strategy, prior performance of similar products (if any), volatility measures, risk tolerance and market conditions. Targeted returns are not intended to be actual performance and should not be relied upon as an indication of actual or future performance. No separate verification has been made as to the accuracy or completeness of the information herein.
Data and graphical information herein are for information only and may have been derived from third party sources. Unigestion takes reasonable steps to verify, but does not guarantee, the accuracy and completeness of information from third party sources. As a result, no representation or warranty, expressed or implied, is or will be made by Unigestion in this respect and no responsibility or liability is or will be accepted. All information provided here is subject to change without notice. It should only be considered current as of the date of publication without regard to the date on which you may access the information. Rates of exchange may cause the value of investments to go up or down. An investment with Unigestion, like all investments, contains risks, including total loss for the investor.
Backtested or simulated performance is not an indicator of future actual results. The results reflect performance of a strategy not currently offered to any investor and do not represent returns that any investor actually attained. Backtested results are calculated by the retroactive application of a model constructed on the basis of historical data and based on assumptions integral to the model which may or may not be testable and are subject to losses.
Changes in these assumptions may have a material impact on the backtested returns presented. Certain assumptions have been made for modeling purposes and are unlikely to be realized. No representations and warranties are made as to the reasonableness of the assumptions. This information is provided for illustrative purposes only. Backtested performance is developed with the benefit of hindsight and has inherent limitations. Specifically, backtested results do not reflect actual trading or the effect of material economic and market factors on the decision-making process. Since trades have not actually been executed, results may have under- or over-compensated for the impact, if any, of certain market factors, such as lack of liquidity, and may not reflect the impact that certain economic or market factors may have had on the decision-making process. Further, backtesting allows the security selection methodology to be adjusted until past returns are maximized. Actual performance may differ significantly from backtested performance.
Additional Information for U.S. Investors
The performance figures are based on estimated fees and expenses as well as on the underlying strategy’s estimated performances given by fund managers, administrators, custodians and third party sources at a given date. Where performance is reflected gross of fees, potential investors should be aware that the inclusion of fees, costs and charges will reduce the overall value of performance. Unless otherwise stated, the performance data source are Unigestion, Bloomberg and Compustat.
This information is provided to you solely to give you background information relating to Unigestion, certain strategies it implements and currently offers. Before making an investment decision with respect to the strategy discussed herein, potential investors are advised to consult with their tax, legal, ERISA and financial advisors. Note that not all strategies may be available or suitable for investment by U.S. investors.
This document may contain forward-looking statements, including observations about markets and industry and regulatory trends as of the original date of this document. Forward-looking statements may be identified by, among other things, the use of words such as “expects,” “anticipates,” “believes,” or “estimates,” or the negatives of these terms, and similar expressions. Forward-looking statements reflect Unigestion’s views as of such date with respect to possible future events. Actual results could differ materially from those in the forward-looking statements as a result of factors beyond a strategy’s or Unigestion’s control. Readers are cautioned not to place undue reliance on such statements. No party has an obligation to update any of the forward-looking statements in this document Return targets or objectives, if any, are used for measurement or comparison purposes and only as a guideline for prospective investors to evaluate a particular investment program’s investment strategies and accompanying information. Performance may fluctuate, especially over short periods. Targeted returns should be evaluated over the time period indicated and not over shorter periods.
The past performance of Unigestion, its principals, shareholders, or employees is not indicative of future returns. Except where otherwise specifically noted, the information contained herein, including performance data and assets under management, relates to the entire affiliated group of Unigestion entities over time including that of Unigestion UK. Such information is intended to provide the reader with background regarding the services, investment strategies and personnel of the Unigestion entities. No guarantee is made that all or any of the individuals involved in generating the performance on behalf the other Unigestion entities will be involved in managing any client account on behalf of Unigestion U.K. More specific information regarding Unigestion UK is set forth herein where indicated and is available on request.
There is no guarantee that Unigestion will be successful in achieving any investment objectives. An investment strategy contains risks, including the risk of complete loss. The risk management practices and methods described herein are for illustrative purposes only and are subject to modification.
Legal entities disseminating this document: UNITED KINGDOM This material is disseminated in the United Kingdom by Unigestion (UK) Ltd., which is authorized and regulated by the Financial Conduct Authority („FCA“). This information is intended only for professional clients and eligible counterparties, as defined in MiFID directive and has therefore not been adapted to retail clients. UNITED STATES This material is disseminated in the U.S. by Unigestion (UK) Ltd., which is registered as an investment adviser with the U.S. Securities and Exchange Commission (“SEC”). This information is intended only for institutional clients and qualified purchasers as defined by the SEC and has therefore not been adapted to retail clients. EUROPEAN UNION This material is disseminated in the European Union by Unigestion Asset Management (France) SA which is authorized and regulated by the French “Autorité des Marchés Financiers” („AMF“). This information is intended only for professional clients and eligible counterparties, as defined in the MiFID directive and has therefore not been adapted to retail clients. CANADA This material is disseminated in Canada by Unigestion Asset Management (Canada) Inc. which is registered as a portfolio manager and/or exempt market dealer in nine provinces across Canada and also as an investment fund manager in Ontario and Quebec. Its principal regulator is the Ontario Securities Commission („OSC“). This material may also be distributed by Unigestion SA which has an international advisor exemption in Quebec, Saskatchewan and Ontario. Unigestion SA’s assets are situated outside of Canada and, as such, there may be difficulty enforcing legal rights against it. SWITZERLAND This material is disseminated in Switzerland by Unigestion SA which is authorized and regulated by the Swiss Financial Market Supervisory Authority („FINMA“). SINGAPORE This material is disseminated in Singapore by Unigestion Asia Pte Ltd. which is regulated by the Monetary Authority of Singapore („MAS“).