– The scale of government and central bank intervention in the face of COVID-19 has raised questions around the risk of inflation in the medium term.
– It is possible that inflation will resurface in the coming months, but we believe it will be cyclical and temporary.
– Given increased levels of government debt, controlled inflation above 2% remains desirable, but we do not expect to see a decade of inflation above 3%.
– In our opinion, inflation risk remains just that – a risk and not a scenario.
Overview
As a result of the COVID-19 crisis, the global economy experienced an unprecedented activity shock, plunging manufacturing and services into uncharted territory. In order to limit the recessionary effects generated by this sudden halt in human activity, governments and central banks around the world initiated monetary and fiscal support of an unprecedented scale. Therefore, while economic activity declined by an average of 10% in the first half of 2020, the balance sheets of central banks increased by an average of 10% of GDP and public spending increased by 5% to 10% of GDP depending on the country.
While this massive level of support has been essential for the financial and social stability of the global economy, it has also raised questions around the risk of inflation that the scale of this stimulus could trigger in the medium term. The conclusion of our analysis points more to a normalisation of inflation towards the target levels of the central banks (around 2%) over the next 12 months, rather than an upward explosion of it. In our opinion, the risk of an inflation shock linked to an excessive growth of debt, as we saw in the aftermath of the Second World War, appears to be low for cyclical and structural macroeconomic reasons.
Inflation Expectations Have Risen Sharply…
The concerted actions of central banks, whose primary objective was to reduce liquidity risk and limit the number of corporate bankruptcies, had a significant impact on risky assets, which have rebounded sharply since March due to the reduction in the risk of a lasting recession. This monetary action has also had a positive impact on inflation expectations (Figure 1). Our composite of breakevens, which tracks the inflation premium contained in bond yields in the main developed countries, increased by 80 bps between March and August 2020. This repricing is also reflected in the performance of our „macro-baskets“. Since March 23, the basket made up of assets positively correlated to inflation has delivered a return of 23%, compared to 38% for the „growth“ basket, -12% for the „market stress“ basket and 1% for the „recession“ basket.
Figure 1: Inflation Breakeven Composite
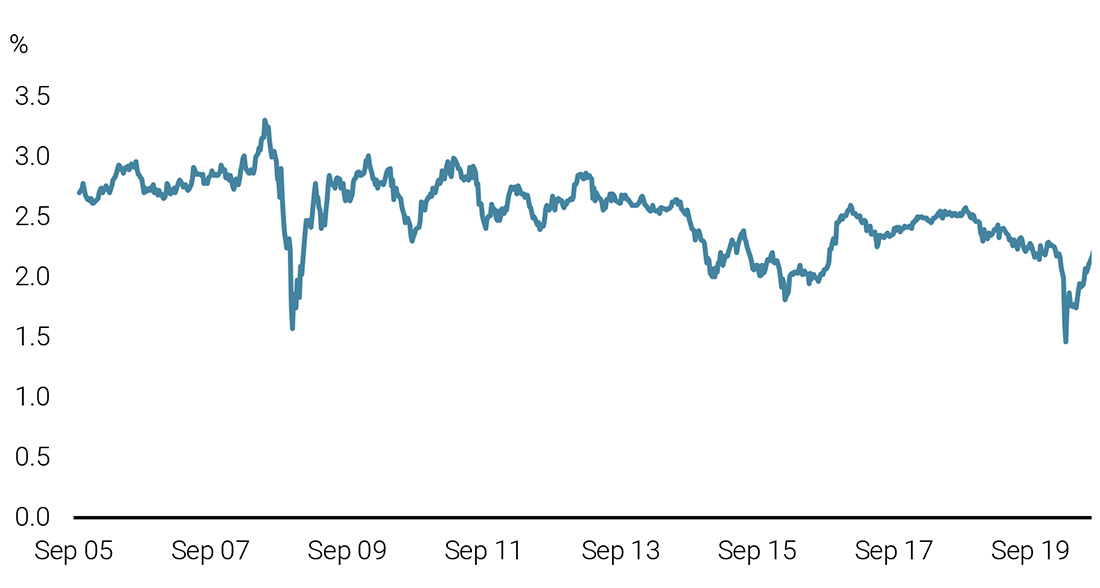
The inflation composite is computed using 50% of US B/E 5y, 30% of UK B/E 5y, 10% of France B/E 5y and 10% of Italy B/E 5y.
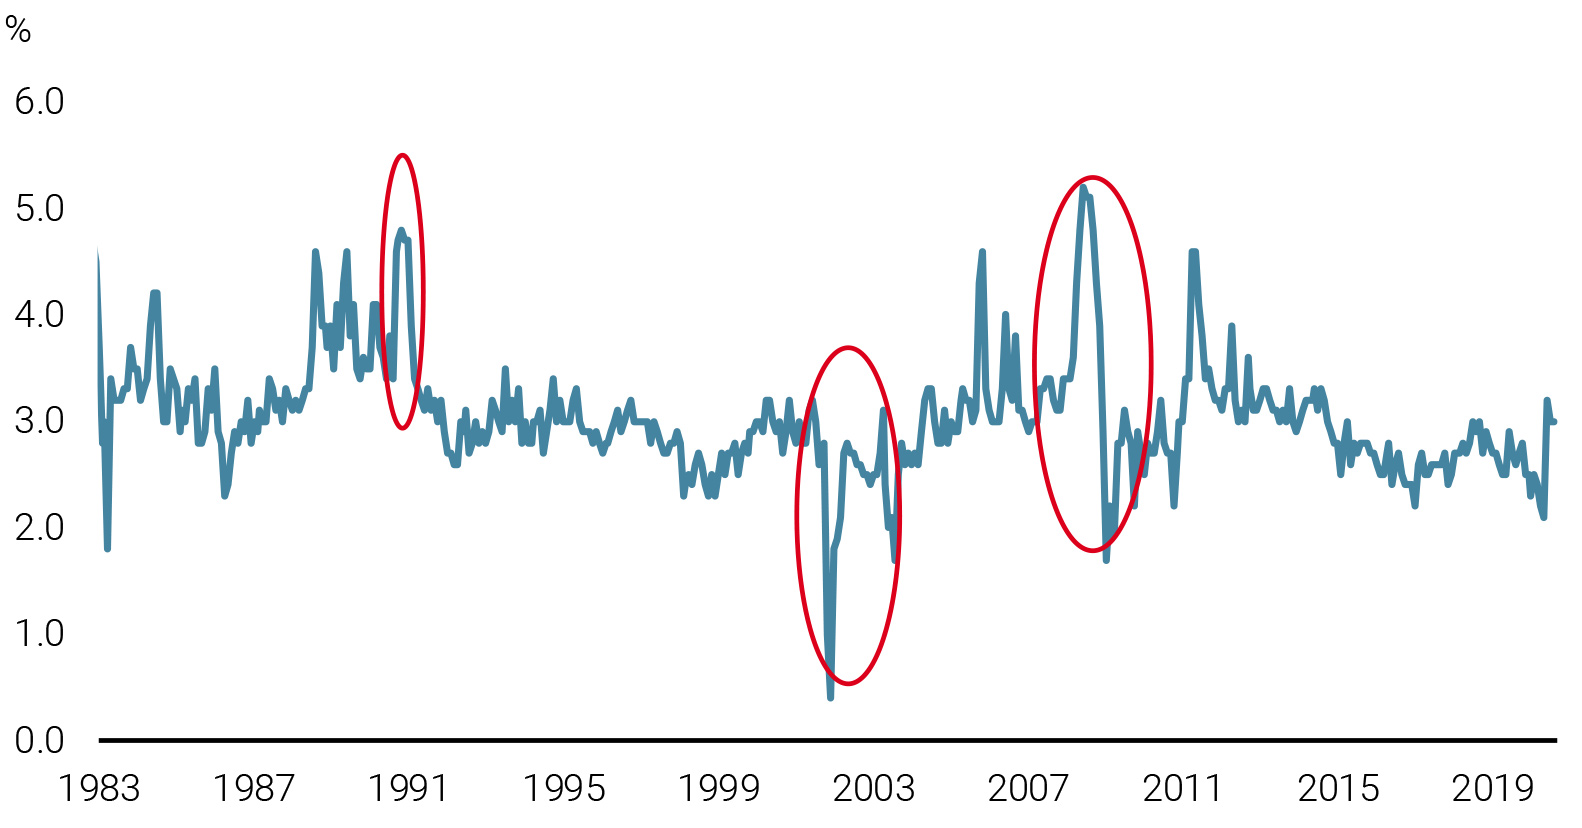
This normalisation of inflation premiums is important but not historically unusual. When analysing the changes in inflation expectations over a long period following an economic shock, 2020 stands out for the stability of expectations. Data provided by the University of Michigan, which goes back to 1978, illustrates two important elements. First, the risk of deflation associated with this recession has been more contained than for previous recessions (1991/2001/2008). Second, the impact of monetary and fiscal policies on the risk of future inflation has also been contained, contrary to 2009 when the introduction of quantitative easing by the US Federal Reserve (the Fed) led to a significant rise in inflation expectations (Figure 2).
Figure 2: Inflation Expectation from University of Michigan

This current economic rebound appears to be solid and sustainable because it is both global and transversal.

In our view, there are two main elements underlying this normalisation of inflation:
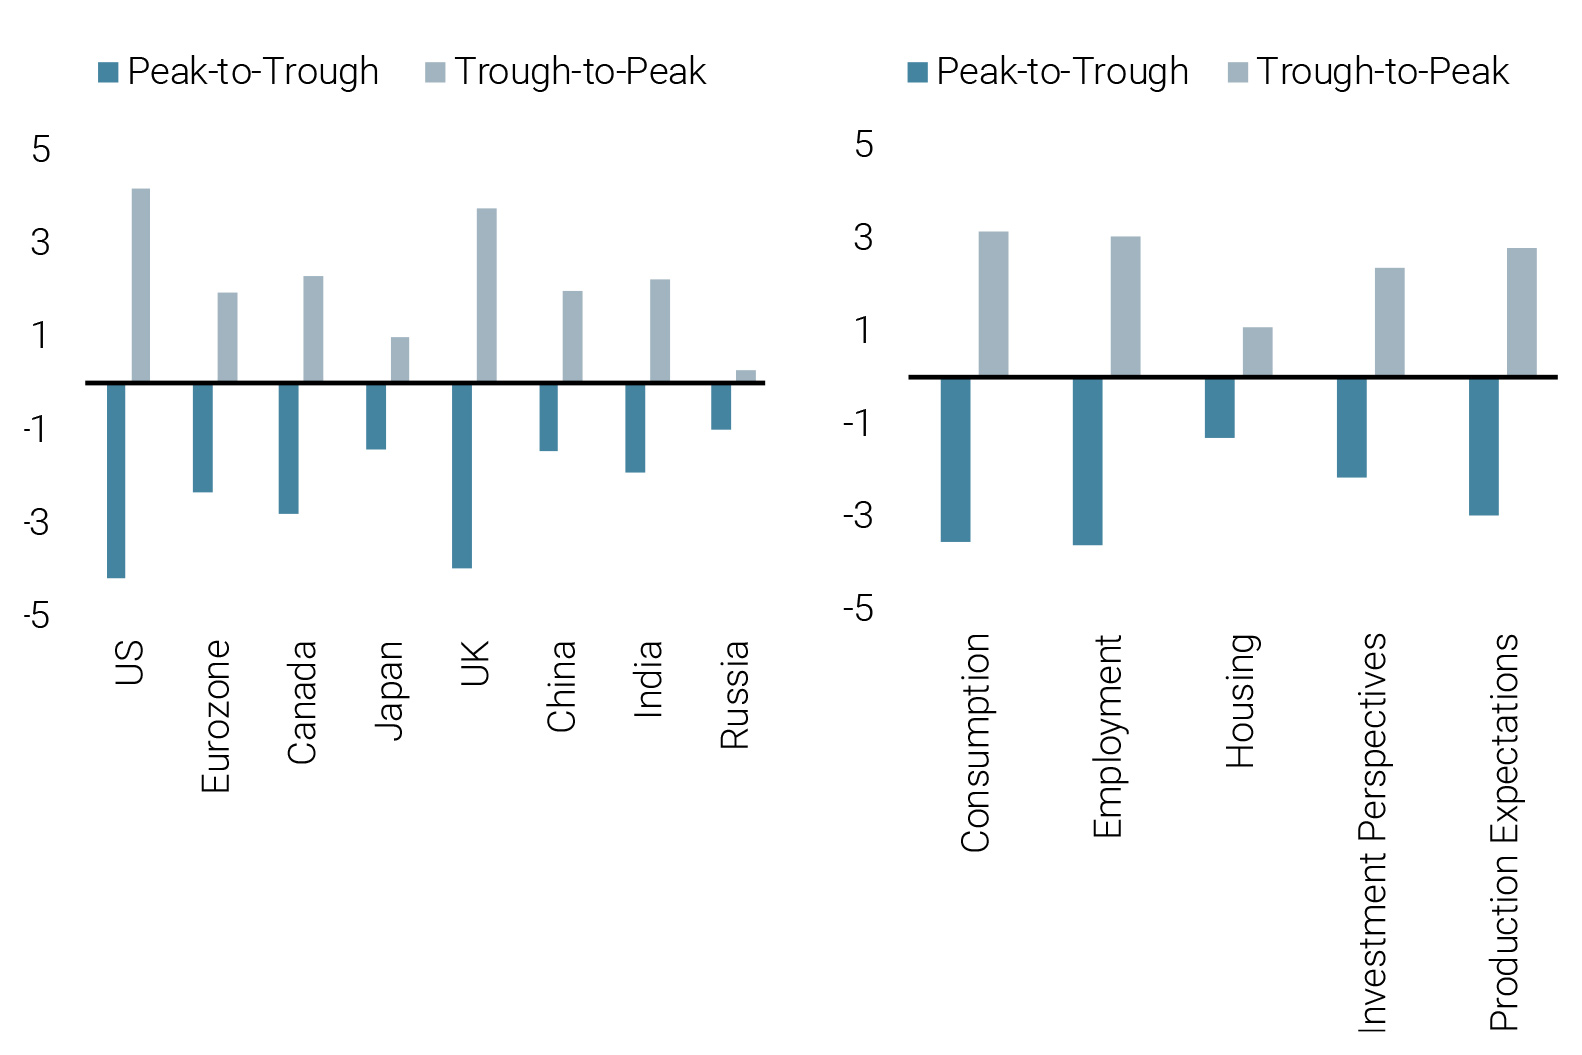
- Cyclical improvement: all of our Nowcaster indicators point to a strong recovery in activity. This economic rebound appears to us to be solid and sustainable because it is both global (it affects all economic zones) and transversal (it occurs in both industry and services). Figure 3, which shows the change in our country indices and in the components of the global index, highlights these elements.
Figure 3: Nowcaster Changes (Peak to Trough and Trough to Peak)
- A change in the objective of central banks: the objective of all central banks is to maintain price stability. Explicitly or implicitly, this objective generally corresponds to maintaining core inflation close to 2%. Figure 4 shows the average gap over two years between core inflation and the 2% target. Since the 2008 crisis, and despite the massive expansion of their balance sheets through the purchase of assets, few central banks have achieved their objective.
Since the 2008 crisis, few central banks have met their core inflation targets.
Figure 4: Core Inflation Less The Central Bank Inflation Target
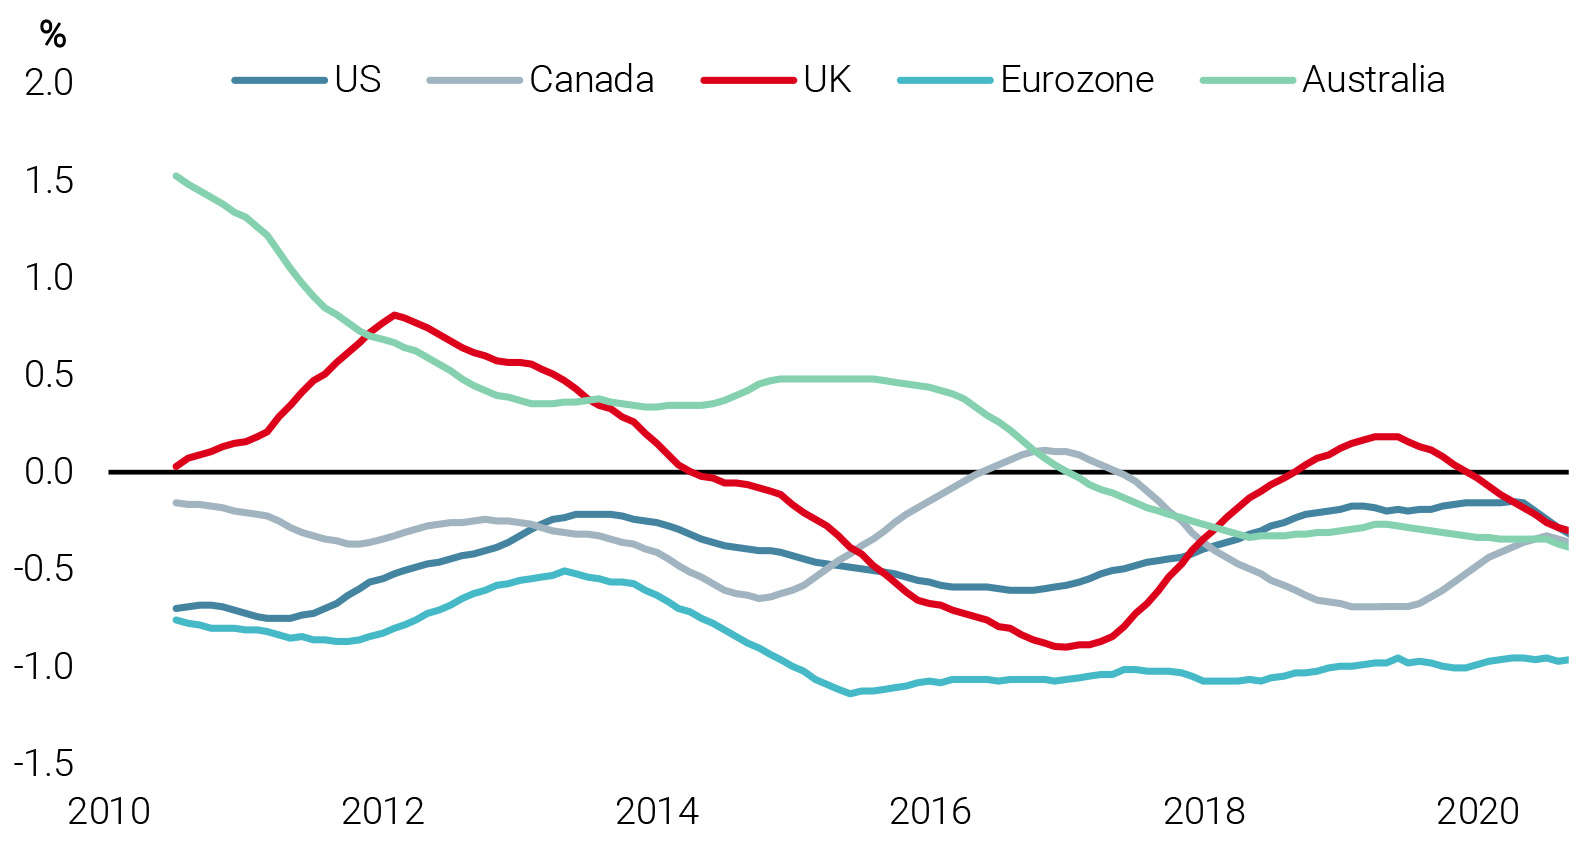
US core PCE for US, Eurozone and UK, HICP Core, Core CPI for Canada and CPI trimmed for Australia. Average 2-year rolling for core inflation; 2% central bank target.
This „shortfall“ led the Fed to change its framework from „Inflation Targeting“ to an „Average Inflation Targeting“. Several academic studies have analysed the extent to which average inflation targeting, which aims to compensate for a lower inflation target by accepting temporarily higher inflation, could enable central banks to achieve the inflation targets contained in their mandates. The results show that it takes several years of above-target inflation to compensate for the shortfall accumulated over the previous years. Figure 4 also underlines that over the next two to three years, a core inflation rate of 2.5% would be necessary to offset the recent period of below-target inflation. The longer or the lower the shortfall, the higher the expected inflation and the longer the accommodative stance required. In this context, it would be normal to expect a repricing in inflation breakevens, leading to an increase of around 50 bps in the inflation expectations curve. Given the key role of the Fed among central banks, we can imagine others, such as the European Central Bank, could follow suit and adapt their inflation target in a similar fashion.
Over the next two to three years, a core inflation rate of 2.5% would be necessary to offset the recent period of below-target inflation.
Central banks around the world are therefore likely to encourage inflation rather than fight it. Are we on the verge of a period with much higher inflation?
…Is This the Beginning of an Inflationary Shock?
In the US, 1944 to 1946 saw an increase in government debt and in the central bank’s balance sheet. At that time, the Fed’s balance sheet had grown from 17% to 20% of GDP, while the US Treasury issued around 20% of GDP in new debt. During this period, inflation peaked at more than 18% year-on-year, as seen in Figure 5. The argument for the proponents of a future inflationary shock is as follows: the debt issued finances stimulus plans that will support demand; at the same time, this debt is bought back by central banks, leading to an increase in the currency in circulation – the combination of stronger demand and more money should therefore create a breeding ground for sustained higher inflation.
Figure 5: Debt to GDP Ratio in the US vs. Inflation (left) and Scatterplot (right)
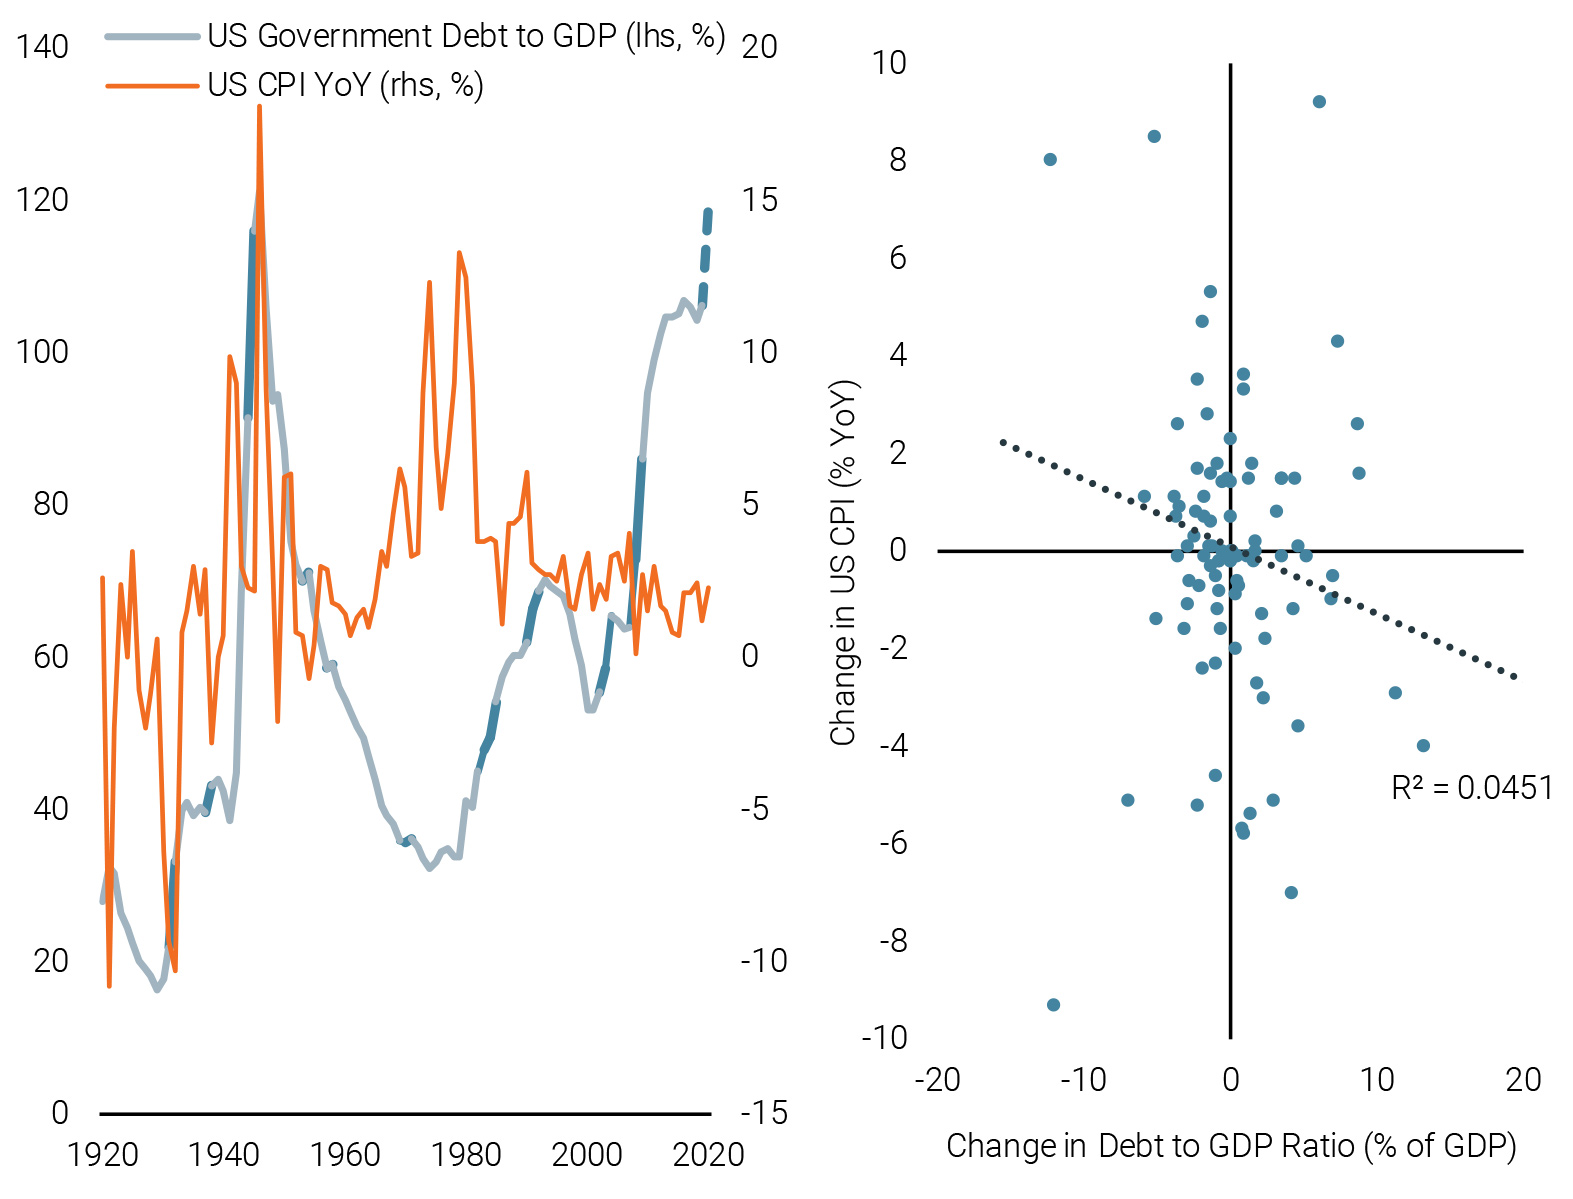
The current activism of countries and central banks is clearly comparable to this period, yet we doubt that inflation will increase structurally or dramatically in the future. First of all, there is historically no statistical relationship between the level of a country’s debt and inflation. While a recent Bank of England report highlights this lack of link, our analysis for the US over the last 100 years indicates a different outcome: an increase in debt has historically implied lower inflation, though this relationship has not necessarily been strong (with an R2 of 0.04). The situation in 1944 to 1946 was therefore more of an anomaly than a statistical regularity.
Despite the current activism of many countries and central banks, we do not expect inflation to increase structurally or dramatically.
More fundamentally, we believe that three important factors will continue to weigh on inflation:
- First, current growth lacks the dynamism of the 1938 to 1945 period, and the intense underutilisation of current labour and capital resources is expected to weigh on price dynamics. The speed of the current recovery reflects the intensity of the fiscal stimulus deployed in many countries: growth in the second half of the year should be positive and strong, coming in at 5.3% in the US and 10.6% in the Eurozone, according to the Bloomberg consensus. The scale of this recovery may be reminiscent of US growth between 1939 and 1945 (11% real growth per year), but we believe that this is not the case. Confinement has created a period of technical recession, which can easily be read in the employment figures as well as in the rates of productive capacity utilisation. Apart from Switzerland and China, the world is not running at full speed and remains far from it. The US has an unemployment rate of 8%, while in Europe it is 7.8%. The productive capacity utilisation rate in the US is around 70% (compared to 78% at the end of last year) and 68% in the Eurozone (compared to 82%). While there is no doubt about the recovery, the output gap remains wide and it is necessary to see it close before hoping to see inflation flourish again.
While the recovery is not in doubt, the output gap remains wide and will need to narrow before inflation picks up markedly.
The famous Philips Curve is a parsimonious way of linking this economic overcapacity to future inflation prospects. This curve arises from the intersection of unemployment and inflation. Figure 6 shows it over the period 1985 to 2020 (in blue), after adjusting for trend effects. The red indicates what this relationship assumes given our scenario for US unemployment over the next two months (5.6%). Inflation should thus oscillate around 1.5% in the long term – not enough to set off the alarm bells. It will take several quarters to see these overcapacities completely eliminated, an essential first step to a rise in inflation. This conclusion is similar to the analysis of the San Francisco Fed: in a recently published paper, their decomposition of inflation between cyclical and non-cyclical factors is a pledge for lower inflation now given the spare capacities1 .To the proponents of an inflation rate of 10% over the next few years, the Philips Curve shows that it would be necessary to reach an unemployment rate of almost 0% for this to happen: a utopia.
Figure 6: Philipps Curve in the US
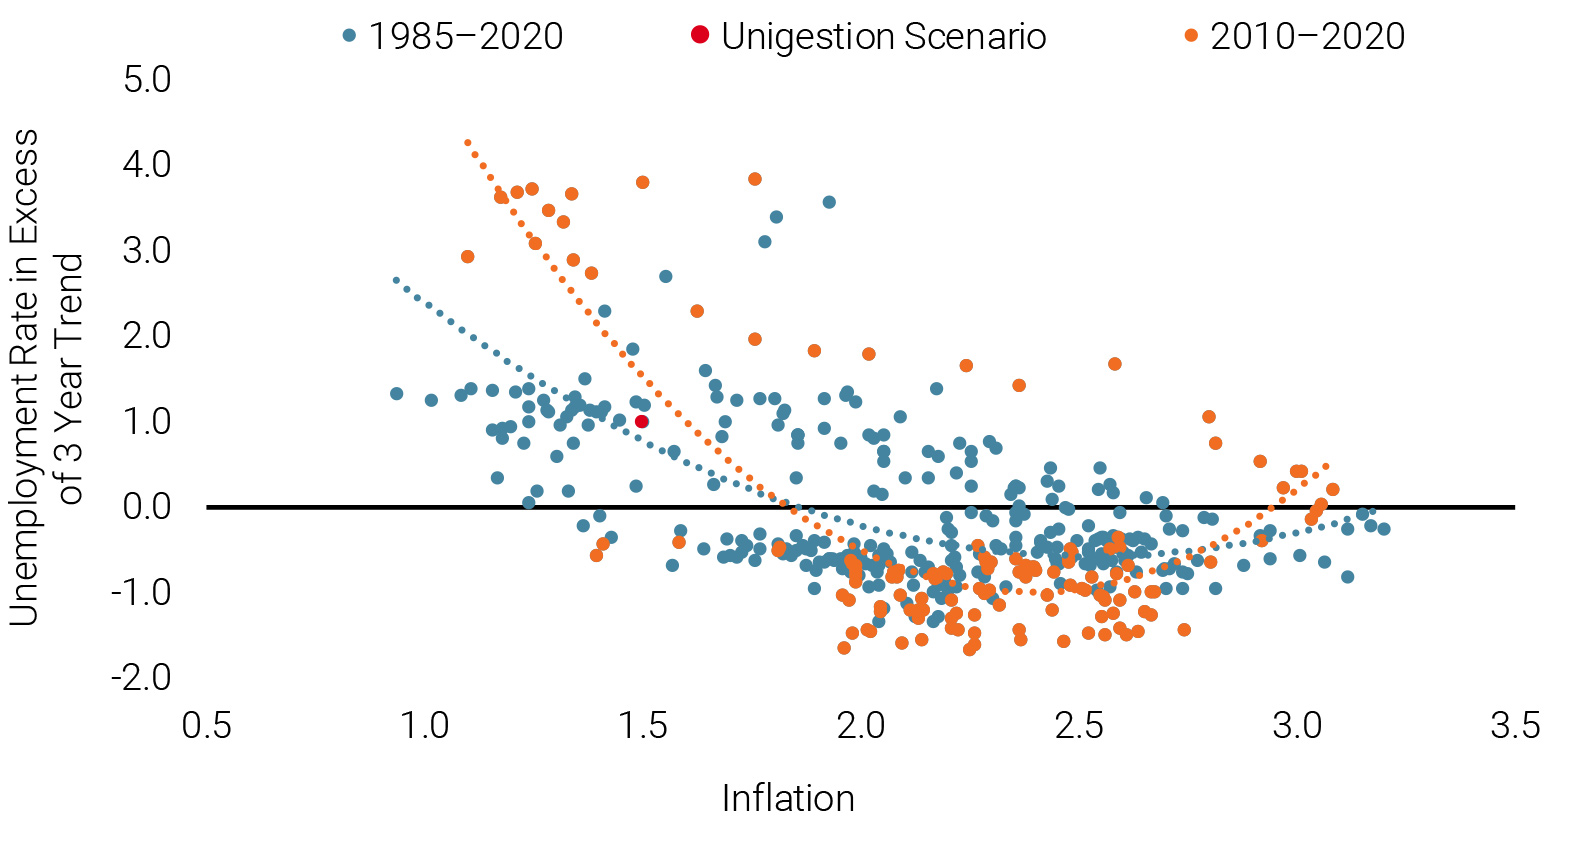
Reading note: the red point indicates the level of inflation consistent with our scenario in terms of unemployment in the US (5.6% in the next 12 months, or 1% above the trend of the last three years).
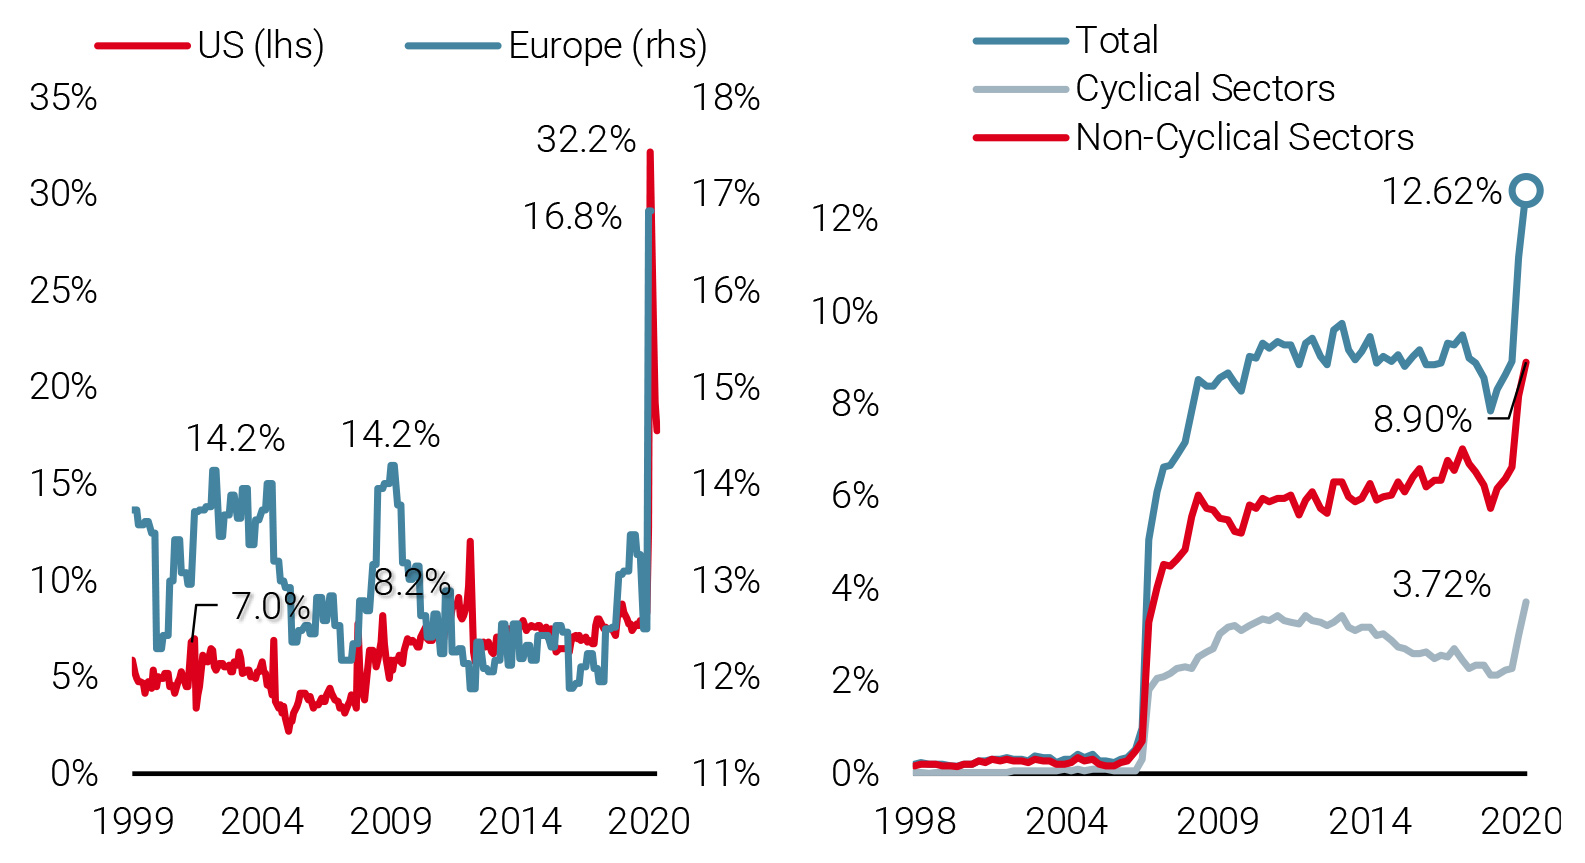
- Then there are a number of channels that reduce the effectiveness of monetary and fiscal policies. The rapid rise in savings rates and in corporate cash holdings hampers the relay of public aid to the economy itself. The COVID-19 crisis has increased economic uncertainty and households and businesses have not failed to respond to this tense climate. As shown in Figure 7, during the first part of the year, household savings reached 32% in the US and 17% in Europe. These figures have since fallen, but have not yet returned to their 2019 levels. The right-hand side of Figure 7 also shows the liquidity held by companies in the US expressed as a percentage of GDP. This liquidity was already high before the crisis but it has since increased by an average of 2% of GDP. These two elements limit the overall impact of public spending, negating a large part of it.
The rapid rise in savings rates and in the level of corporate cash holdings hampers the relay of public aid to the economy itself.
The action of central banks is penalised by a similar mechanism: while the money supply is growing, the speed of money circulation has been decreasing since the start of unconventional monetary policies. Between the 1990s and today, the speed of money circulation measured from M2 has halved. In other words, each dollar injected by the Fed today circulates half as fast as 30 years ago. Here again, the relay of these liquidity injections into the economy is clearly altered. The 8% of GDP of budgetary expenditure and 10% of GDP of monetary stimulation should therefore be put into perspective: a dollar or a euro injected is not a dollar or a euro active in the economy. These delayed effects thus counteract an acceleration of inflation and are likely to last. According to the famous „Ricardo-Barro“ equivalence, there is a good chance of households and companies saving more in the coming quarters to cope with the expected increase in fiscal pressure, again cancelling out part of the stimulus effect.
Figure 7: Households Savings (left) and US Companies’ Cash Level as a Ratio to GDP (right)
The acceleration of the digitalisation of industry is likely to increasingly weigh on the prices of goods and services.
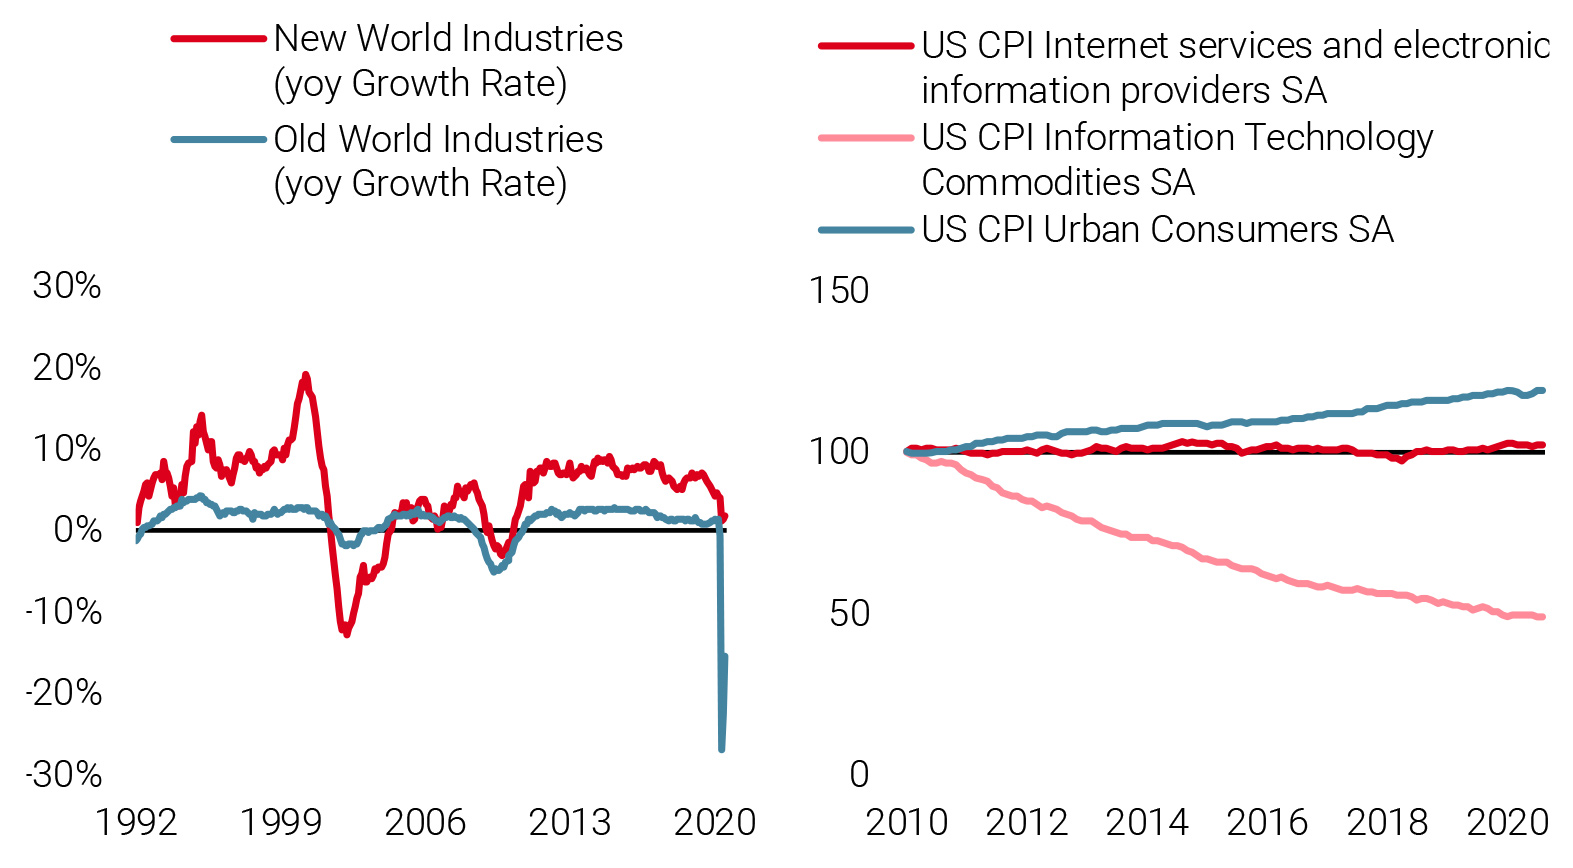
- Beyond these two cyclical elements, a final, more structural element needs to be taken into account: the acceleration of the digitalisation of industry, which is likely to weigh durably on the prices of goods and services. While this trend was latent in recent years, it has been greatly accelerated by lockdowns. Figure 8 shows the evolution of the employment growth rate by sector in the US, comparing the „old“ sectors to those of the „new“ digitized economy. While the traditional employment sectors have suffered greatly from containment and are expected to take time to fully recover from the shock, the new economy has suffered without really faltering, with the year-on-year growth rate of employment remaining positive. This accelerating digitalisation is a long-term phenomenon that should also limit the rise in inflation. These sectors are in essence extremely competitive and in constant search for efficiency while creating disruptive effects in the old economy, weighing on price dynamics. The right-hand side of Figure 8 shows an illustration of this: the IT price index in the US CPI has been the only one declining, while the overall price index has continued to rise. These sectors will continue to grow in importance in the coming decade and will infiltrate many sectors that have not yet experienced the full impact of information technology. These changes – „creative destruction“ dear to J.A. Schumpeter – should in turn lead to two developments: a structural reorganisation of the working population, which is a source of temporary unemployment, and a limitation of the pricing power of companies due to the transparency of tariffs. None of this is conducive to a wave of inflation exceeding 3% in the long term.
Figure 8: Growth Rate of the Employed Labor Force in the US by Industry (left) and Consumer Price Indices (right)
These last three factors, when taken together, do not allow us to anticipate a real and lasting inflation shock in the medium term: controlled inflation above 2% remains desirable in this context of increased debt, but we do not believe in a decade of inflation above 3%.
Conclusion
It is possible that inflation will resurface in the coming months. But this will be cyclical, temporary inflation, which should barely exceed 3%. The still existing overcapacity of the global economy, the savings rates of households and companies, the low velocity of money and the advanced digitalisation of the world economy are all factors that should not be disregarded. We therefore find it difficult to anticipate lasting inflation shocks for the coming quarters.
This is actually rather fortunate. As we have already mentioned in previous publications, inflation hedging has become extremely expensive, whether it be inflation breakevens or contango-prone commodity markets. Between a lack of realism based on our analysis and an excessive cost, the inflation risk remains, in our view, a risk and not a scenario.
1Hale Shapiro, Adam. 2020. “A Simple Framework to Monitor Inflation,” Federal Reserve Bank of San Francisco Working Paper 2020-29.
Important Information
Past performance is no guide to the future, the value of investments, and the income from them change frequently, may fall as well as rise, there is no guarantee that your initial investment will be returned. This document has been prepared for your information only and must not be distributed, published, reproduced or disclosed by recipients to any other person. It is neither directed to, nor intended for distribution or use by, any person or entity who is a citizen or resident of, or domiciled or located in, any locality, state, country or jurisdiction where such distribution, publication, availability or use would be contrary to law or regulation.
This is a promotional statement of our investment philosophy and services only in relation to the subject matter of this presentation. It constitutes neither investment advice nor recommendation. This document represents no offer, solicitation or suggestion of suitability to subscribe in the investment vehicles to which it refers. Any such offer to sell or solicitation of an offer to purchase shall be made only by formal offering documents, which include, among others, a confidential offering memorandum, limited partnership agreement (if applicable), investment management agreement (if applicable), operating agreement (if applicable), and related subscription documents (if applicable). Please contact your professional adviser/consultant before making an investment decision.
Where possible we aim to disclose the material risks pertinent to this document, and as such these should be noted on the individual document pages. The views expressed in this document do not purport to be a complete description of the securities, markets and developments referred to in it. Reference to specific securities should not be considered a recommendation to buy or sell. Unigestion maintains the right to delete or modify information without prior notice. Unigestion has the ability in its sole discretion to change the strategies described herein.
Investors shall conduct their own analysis of the risks (including any legal, regulatory, tax or other consequences) associated with an investment and should seek independent professional advice. Some of the investment strategies described or alluded to herein may be construed as high risk and not readily realisable investments, which may experience substantial and sudden losses including total loss of investment. These are not suitable for all types of investors.
To the extent that this report contains statements about the future, such statements are forward-looking and subject to a number of risks and uncertainties, including, but not limited to, the impact of competitive products, market acceptance risks and other risks. Actual results could differ materially from those in the forward-looking statements. As such, forward looking statements should not be relied upon for future returns. Targeted returns reflect subjective determinations by Unigestion based on a variety of factors, including, among others, internal modeling, investment strategy, prior performance of similar products (if any), volatility measures, risk tolerance and market conditions. Targeted returns are not intended to be actual performance and should not be relied upon as an indication of actual or future performance.
No separate verification has been made as to the accuracy or completeness of the information herein. Data and graphical information herein are for information only and may have been derived from third party sources. Unigestion takes reasonable steps to verify, but does not guarantee, the accuracy and completeness of information from third party sources. As a result, no representation or warranty, expressed or implied, is or will be made by Unigestion in this respect and no responsibility or liability is or will be accepted. All information provided here is subject to change without notice. It should only be considered current as of the date of publication without regard to the date on which you may access the information. Rates of exchange may cause the value of investments to go up or down. An investment with Unigestion, like all investments, contains risks, including total loss for the investor.
Legal Entities Disseminating This Document
UNITED KINGDOM
This material is disseminated in the United Kingdom by Unigestion (UK) Ltd., which is authorized and regulated by the Financial Conduct Authority („FCA“). This information is intended only for professional clients and eligible counterparties, as defined in MiFID directive and has therefore not been adapted to retail clients.
UNITED STATES
This material is disseminated in the U.S. by Unigestion (UK) Ltd., which is registered as an investment adviser with the U.S. Securities and Exchange Commission (“SEC”). This information is intended only for institutional clients and qualified purchasers as defined by the SEC and has therefore not been adapted to retail clients.
EUROPEAN UNION
This material is disseminated in the European Union by Unigestion Asset Management (France) SA which is authorized and regulated by the French “Autorité des Marchés Financiers” („AMF“).
This information is intended only for professional clients and eligible counterparties, as defined in the MiFID directive and has therefore not been adapted to retail clients.
CANADA
This material is disseminated in Canada by Unigestion Asset Management (Canada) Inc. which is registered as a portfolio manager and/or exempt market dealer in nine provinces across Canada and also as an investment fund manager in Ontario, Quebec and Newfoundland & Labrador. Its principal regulator is the Ontario Securities Commission („OSC“). This material may also be distributed by Unigestion SA which has an international advisor exemption in Quebec, Saskatchewan and Ontario. Unigestion SA’s assets are situated outside of Canada and, as such, there may be difficulty enforcing legal rights against it.
SWITZERLAND
This material is disseminated in Switzerland by Unigestion SA which is authorized and regulated by the Swiss Financial Market Supervisory Authority („FINMA“).
SINGAPORE
This material is disseminated in Singapore by Unigestion Asia Pte Ltd. which is regulated by the Monetary Authority of Singapore („MAS“).
Document issued September 2020.