MiViews Q1 2022: The Great Normalisation
Head of Macro and Dynamic Allocation Cross Asset Solutions
- Although inflationary pressures remain high, easing supply constraints should help it to cool in the coming months.
- Despite increasing hawkishness and aggressive rate hike pricing by the Fed and the market, calmer heads should prevail. History shows that the “end of easy money” does not mean the end for equities.
- Current expectations incorporate too much “inflation premium” and too little “growth premium”. We expect a rebalancing across these two key risk premia embedded in assets, which should benefit risk assets in general, and US equities and the US dollar in particular.
Overview
After two turbulent years of deep recession and extreme recovery, we expect 2022 to be the year of normalisation with regards to policy mix, economic activity and inflation. The New Year should see slowing growth and inflation as inventories turn from headwinds to tailwinds. There is also a genuine chance of hitting a fiscal cliff, while major central banks simultaneously engage in a new cycle of hikes. All of these factors will likely provoke volatility in the markets and trigger large dispersions across and within assets. Against this backdrop, flexibility in views and positioning are key to navigating a world where any incremental change could dramatically affect market sentiment. The good news, in our view, is that current expectations for monetary policy and earnings growth incorporate too much inflation and too little growth.
This year we therefore prefer equities at the expense of fixed income assets, secular growth stocks with a large bias toward US corporates as opposed to value ones, and defensive assets such as sovereign long term bonds. Moreover, contrary to 2021, where real assets outperformed thanks to rising inflation pressures from depressed levels, we think that current inflation expectations are priced for “perfection”, i.e. anticipating too much of a continuation of recent trends, which realistically could only prevail with the help of exogenous forces, such as a geopolitical shock.
Did Somebody Say – Just Hike?
The terminal rate for US Fed funds (the level at which policy rates will stop going up) is currently priced between 1.8% and 2.0%. Putting this into perspective, a complete, sub-2% rate hike cycle would be a mere drop in the ocean when seen over a 50-year period, as illustrated in Figure 1. This would be the lowest rate hike cycle in history, even smaller than the one that started in 2016, when Yellen engineered a gentle, well-telegraphed upward cycle, where employment mattered much more than inflation. Granted, the direction for rates is upwards, but the distance is relatively small, and as such, terminal rates matter more than the path of tightening.
Figure 1: Historical Fed Funds Rates and Expectations
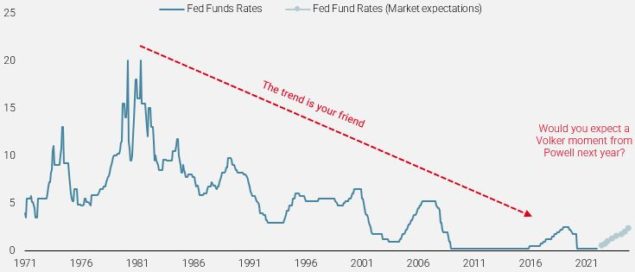
Sources: Bloomberg, Unigestion. Data as at 31.12.2021.
When it comes to the duration of a complete rate-hiking cycle, the Fed usually ends or even reverses that cycle after less than 24 months (Figure 2). In contrast, current pricing implies that the Fed will maintain the upcoming cycle for three years, which in our view – and historically – seems a little far-fetched.
In addition, if the Fed were truly hawkish, it would have pulled the trigger by now. Given the recent shift in trend in its balance sheet expansion, announcing the end of its asset-purchasing programme, it could have already hiked rates twice, but chose not to.
Figure 2: Previous and Current Expected Fed Rate-Hike Cycles
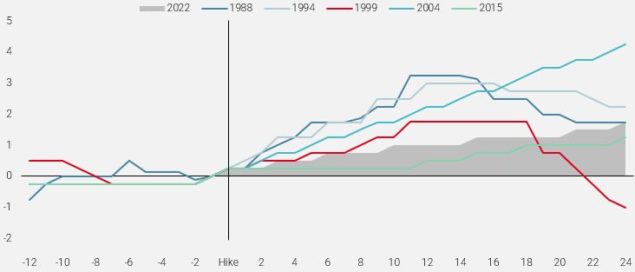
Sources: Bloomberg, Unigestion. Data as at 31.12.2021.
Even if the rate-hike cycle were to materialise as broadly anticipated until 2024 and suggested by the Fed dot plots and various forecasts made in December 2021, real short-term rates would stay slightly negative, something that has never happened since 1970 (Figure 3).
Figure 3: Real Fed Fund Rates Based on Fed Dot Plots and Forecasts (December Fed Meeting)
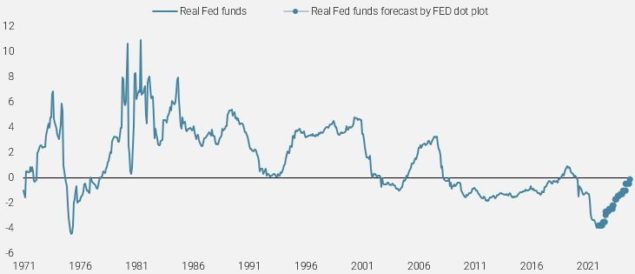
Sources: Bloomberg, Unigestion. Data as at 31.12.2021.
In the end, we are far less sanguine about the magnitude and duration of the upcoming Fed rate-cycle than what the market is currently pricing, given the potential pitfalls awaiting in 2022 and our belief that the Fed will much rather err on the side of caution than aggressively hike rates. If history is any guide, the path to normalisation will be shorter and shallower than most – including the Fed – currently expect. This in turn should be beneficial for growth-oriented assets in general and equities in particular.
The End of Easy Money Is Not the End for Equities…
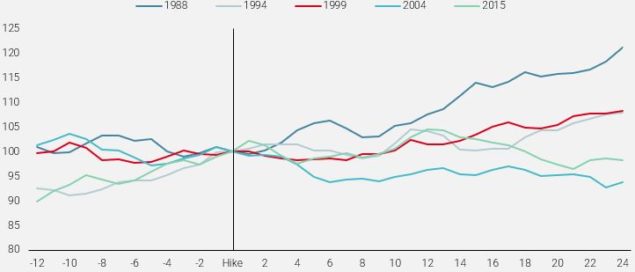
An analysis of the last five hiking cycles by the Fed reveals that the S&P 500 rose every single time in the 12 months that followed the initial rate hike. On average, the index rose by 7.6% a year after the Fed first pulled the trigger (Figure 4).
Figure 4: S&P 500 Before and After the First Fed Hike (Months)
Sources: Bloomberg, Unigestion. Data as at 15.12.2021.
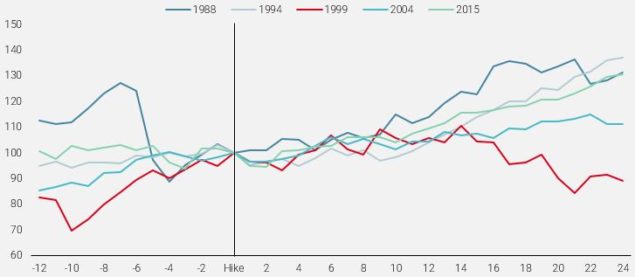
Past hiking cycles were also positive for the US trade-weighted dollar, as depicted lower in Figure 5. With the exception of the 2004-2006 cycle, the greenback strengthened every time, returning 3% on average after 12 months, as money increasingly flowed into the US capital markets, which in turn maintained downward pressure on imported inflation.
Figure 5: USD Fed Broad Trade-weighted Dollar Before and After First Fed Hike (Months)
Sources: Bloomberg, Unigestion. Data as at 15.12.2021.
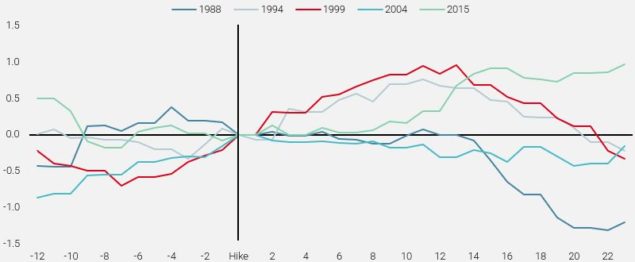
What about bond yields and curves? The evidence shows that US 10-year Treasury yields rise more in anticipation of rate hikes than when the cycle actually kicks in. Over the last five cycles, 10-year yields rose 100% of the time in the 12 months preceding the first hike, by an average of 52 basis points. In the following 12 months, bond yields rose as well but not as much, by 31 basis points on average after the initial lift-off. If we ignore the earlier 1988 and 1994 cycles and solely focus on the 1999, 2004 and 2015 periods, 10-year bond yields actually declined by an average 5 basis points following the first hike (Figure 6).
Figure 6: US 10-year Bond Yields Before and After the First Fed Hike (Months)
Sources: Bloomberg, Unigestion. Data as at 15.12.2021.
As for the slope of the US yield curve, it flattened by an average of 96 basis points 12 months after the first hike of the cycle, as shown in figure 7. This in stark contrast to the current level of pricing, which anticipates a curve flattening between 2 and 10-year yields of only 35 basis points.
Figure 7: US 2yr/10yr Slope Before and After First Fed Hike (Months)
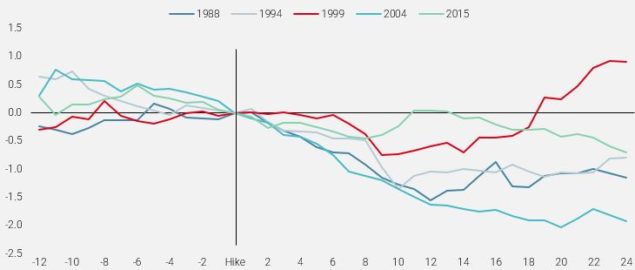
Sources: Bloomberg, Unigestion. Data as at 15.12.2021.
… But Weighs on Activity and Worsens Inflation
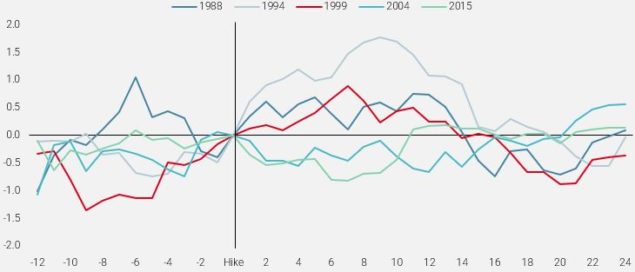
In what may come as a surprise considering the Fed’s dual mandate of stable prices and maximum employment, the past tightening cycles had more adverse effects on economic activity and inflation than on financial assets. Our proprietary US Growth Nowcaster, which tracks and synthesises US growth in real time through a large spectrum of economic data, tends to decline on average by 0.35 in the 12 months following the first hike, as shown below in Figure 8.
Figure 8: US Growth Nowcaster Before and After First Fed Hike (Months)
Sources: Bloomberg, Unigestion. Data as at 15.12.2021.
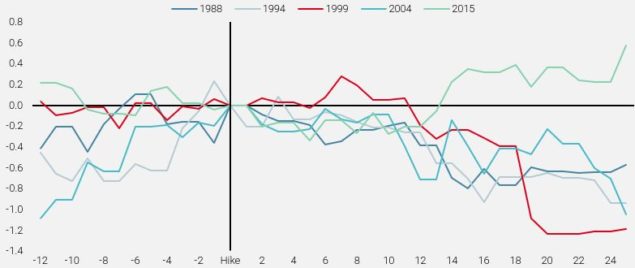
Even more surprisingly, despite the tightening of financial conditions, inflation pressures continue to grow significantly in the year that follows the first Fed hike. Figure 9 clearly shows the general upwards trend of our US Inflation Nowcaster once the cycle commences.
Figure 9: US Inflation Nowcasters before and after first Fed Hike (Months)
Sources: Bloomberg, Unigestion. Data as at 15.12.2021.
Asset Allocation 2022
While 2021 was the year of reflation morphing into full-fledged inflation, we doubt that 2022 will cascade into stagflation, as many market observers and participants may fear. Rather, we see a gradual deceleration of growth and inflation, induced by easing supply constraints, which in turn should lessen the pressure on central banks to hike as aggressively as currently anticipated. History also shows that US equities and the US dollar generally benefit in the first 12 months of a new rate hiking cycle by the Fed, and we believe that this time around will be no exception, especially in light of the very short and shallow upwards path that Fed funds are likely to take.
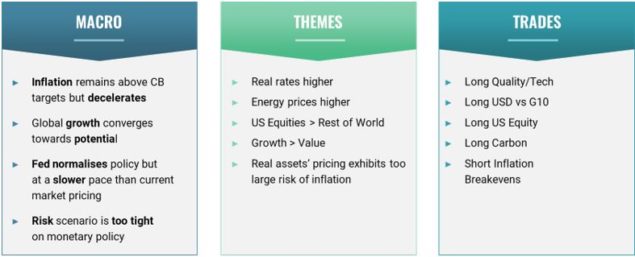
Against that backdrop, we would prefer:
- Quality segments in equities that offer solid earnings growth and higher visibility in terms of profitability
- US equities versus the rest of the world thanks to higher flexibility in the US policy mix and its corporate leadership in key sectors
- A US dollar that should benefit from stronger US GDP and higher liquidity in its capital markets, both of which should drive flows into US assets
- We would also be less exposed to real assets than we were in 2021, as current pricing in both inflation breakevens and energy prices reflect a durable expansion period in the global cycle, which in our view, given the potential headwinds identified for next year, is now too optimistic.
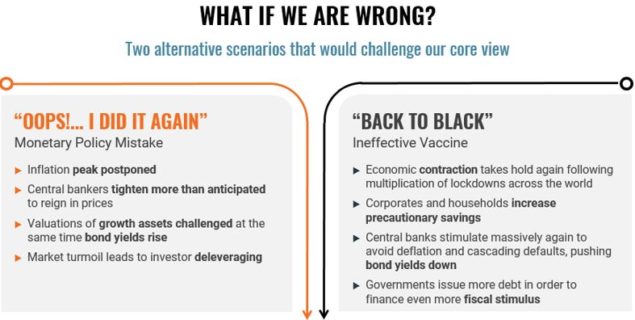
While the risk of the dreaded “policy mistake” is not to be discounted, where central banks would hike too fast and too far – triggering higher bond yields and a general meltdown as investors deleverage – we are much more likely to witness a gentle, Yellen like rate hike cycle, than the “massacre” engineered by Volcker in the 1970s.
Likewise, Covid may continue to linger and spawn even more dangerous variants than the ones we have so far experienced, which would put us back to square one, with lockdowns and restrictions regenerating massive fiscal and monetary stimulus to combat deflation and massive defaults.
However, after the tumultuous rollercoaster ride of the past two years we believe the time has come for a “great normalisation”, where both growth and inflation should decelerate and converge toward their long-term levels. In that context, macro volatility should decline and normalise after two years of spikes and extreme swings.
Important information
This document is provided to you on a confidential basis and must not be distributed, published, reproduced or disclosed, in whole or part, to any other person.
The information and data presented in this document may discuss general market activity or industry trends but is not intended to be relied upon as a forecast, research or investment advice. It is not a financial promotion and represents no offer, solicitation or recommendation of any kind, to invest in the strategies or in the investment vehicles it refers to. Some of the investment strategies described or alluded to herein may be construed as high risk and not readily realisable investments, which may experience substantial and sudden losses including total loss of investment.
The investment views, economic and market opinions or analysis expressed in this document present Unigestion’s judgement as at the date of publication without regard to the date on which you may access the information. There is no guarantee that these views and opinions expressed will be correct nor do they purport to be a complete description of the securities, markets and developments referred to in it. All information provided here is subject to change without notice. To the extent that this report contains statements about the future, such statements are forward-looking and subject to a number of risks and uncertainties, including, but not limited to, the impact of competitive products, market acceptance risks and other risks.
Data and graphical information herein are for information only and may have been derived from third party sources. Although we believe that the information obtained from public and third party sources to be reliable, we have not independently verified it and we therefore cannot guarantee its accuracy or completeness. As a result, no representation or warranty, expressed or implied, is or will be made by Unigestion in this respect and no responsibility or liability is or will be accepted. Unless otherwise stated, source is Unigestion. Past performance is not a guide to future performance. All investments contain risks, including total loss for the investor.
Unigestion (UK) Ltd. is authorised and regulated by the UK Financial Conduct Authority (FCA) and is registered with the Securities and Exchange Commission (SEC). Unigestion Asset Management (France) S.A. is authorised and regulated by the French “Autorité des Marchés Financiers” (AMF). Unigestion Asset Management (Canada) Inc., with offices in Toronto and Montreal, is registered as a portfolio manager and/or exempt market dealer in nine provinces across Canada and also as an investment fund manager in Ontario, Quebec and Newfoundland & Labrador. Its principal regulator is the Ontario Securities Commission. Unigestion Asset Management (Düsseldorf) SA is co-regulated by the “Autorité des Marchés Financiers” (AMF) and the “Bundesanstalt für Finanzdienstleistungsaufsicht” (BAFIN). Unigestion SA has an international advisor exemption in Quebec, Saskatchewan and Ontario. Unigestion SA is authorised and regulated by the Swiss Financial Market Supervisory Authority (FINMA). Unigestion SA’s assets are situated outside of Canada and, as such, there may be difficulty enforcing legal rights against Unigestion SA.
Document issued: October 2021.