- Supply and demand imbalances and stronger consumption will drive inflation over the coming quarters.
- We expect inflation to be more than just a short-term phenomenon and for markets to start adjusting to this reality.
- A rising rates environment will weigh more on the beta side of markets, opening the door for an alpha comeback.
- Our preference is for Trend and Carry positions, the USD, and cyclical equities and commodities.
Overview
If, like us, you are convinced that inflation is likely to overshoot expectations this year, then this quarter is going to be key. And it will be from two different perspectives: a short-term one, answering the question “How high will inflation rise in 2021?” and a long-term one, answering the question “Will inflation be sustained beyond 2021?” Answering these two questions now will be essential to navigating macro forces in the quarter ahead.
Here’s what we expect in the coming months:
- Q2 should see stronger growth and inflation numbers materialise worldwide.
- More importantly, this quarter should also see an increased probability of stronger growth and inflation in the medium term, for which investors are currently poorly prepared.
- With this in mind, Q2 could be volatile from a beta perspective but it could also throw open interesting alpha opportunities. We remain cautious with regard to duration and retain a preference for cyclical commodities and currencies, and anything value, carry or cyclical-related.
Part 1 – Don’t Underestimate Inflation in the Short-Term
In the US, Q2 will be the quarter with the strongest basis effect in terms of inflation. US inflation indices bottomed in May 2020 after a 1% decline since February. Therefore, even a standard 2% annual rate of increase could push inflation between this May and June to reach 3% plus in year-over-year terms. This, in our opinion, could unsettle market observers. Without any strong fundamental reasons, inflation numbers could already look too high to many investors. So, what is the fundamental picture now?
Figure 1: Base Effects for US Inflation
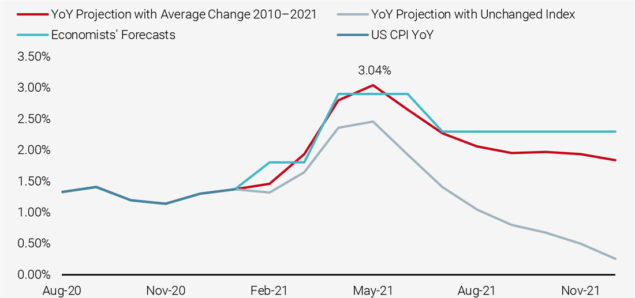
Source: Bloomberg, Unigestion. Data as at 31.03.2021.
Growing Supply and Demand Imbalances Will Drive Inflation
As we have already alluded to in previous publications, inflation is the result of a confrontation between rising demand and limited supply.
The supply situation is quite clear from the data: in the US, production capacity is reported to run at 73.8%, while in Europe it is at 77.6%. Both levels are much lower than their historical averages of around 80%. What does this mean in terms of inflation? It means that a substantial part of production capacities have not been used for more than 12 months. Typically, this leads to mounting obsolescence and deteriorating human capital, which in turn creates further constraints when an industry tries to meet rising demand1. While capacity utilisation rates seem to hint at a significant slack in the economy, the actual underutilisation is probably much lower than the numbers suggest, not to mention the bottlenecks generated by the disruption from repeated lockdowns. With economists expecting about 10% to 15% investment growth in 2021, which is historically low, this constrained supply is likely to remain.
In the meantime, demand is showing signs of a rapid recovery. This growing demand reflects various tailwinds. First, the levels of savings remain high and wage growth has barely retreated, which implies that the revenue of the representative household in the US and in Europe favours consumption. Second, interest rates remain low, which could further support higher disposable income as mortgages get refinanced, while consumer credit should also give consumption a boost. Third, although global vaccination campaigns are unfolding unevenly, they are still unfolding and we are well and truly heading towards an improving situation. Finally, the recovery is gaining momentum worldwide. The Fed made this quite clear as it revised its US growth forecast from 4.5% to 6.2% for 2021, a magnitude of revision rarely seen before. The Atlanta Fed Nowcaster now expects growth of around 5.7% for Q1, while the New York Fed is even more optimistic, expecting 6.3% growth over the same period. Private economists are also starting to agree with these numbers, with expectations of 5.6% growth in global GDP in 2021, largely supported by consumption. This momentum in itself is creating a self-sustained period of rising demand.
As Figure 2 demonstrates, the message from our Growth Nowcasters and Newscasters is very much consistent with this optimism: recession risk is currently low and we are struggling to find reasons why it could rise.
Figure 2: Growth Nowcasters (left) and Newcasters (right)
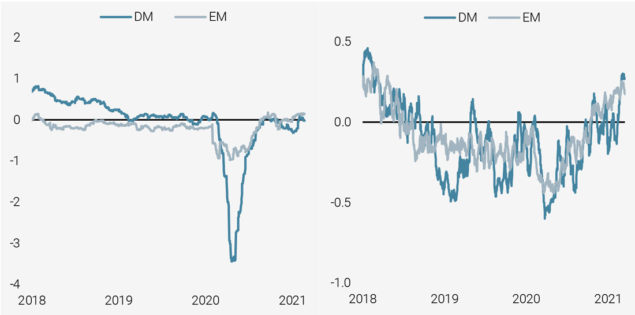
Reading note: Nowcasters and Newscaster are z-scores resulting from the combination of respectively macro data and media news flow. Positive (resp. negative) values indicate the underlying phenomenon should be stronger (resp. weaker) than usual.
Source: Bloomberg, Ravenpack, Unigestion. Data as at 31.03.2021.
Economic Growth: It’s All About Consumption
Where we think we could see a further rise in our growth indicators would probably be in consumption. Looking at durable goods consumption highlights an interesting case. As shown in Figure 3, our US Growth Nowcaster has seen a large recovery but remains anchored around the zero level. This is partially explained by its Durable Goods Order component: Michigan University produces a compelling survey on the willingness of consumers to undertake purchases of large household durable goods. So far, and in spite of the global recovery and very low interest rates, households have shown reluctance to invest in durable goods. The lack of future visibility can explain this, but Figure 3 makes clear that this is a common feature of most recoveries. Therefore, as this consumption starts to take place, we are likely to see even higher growth than that expected by many forecasters.
Figure 3: US Growth Nowcaster, Durable Goods Consumption Components
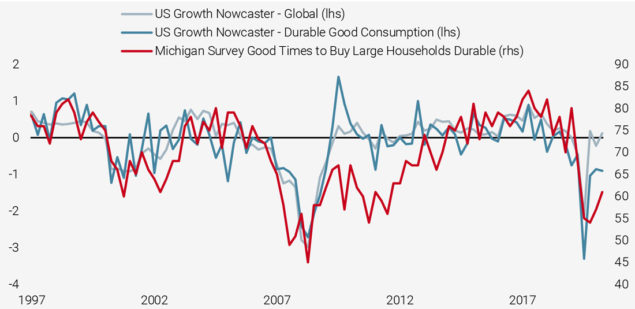
Source: Bloomberg, Unigestion. Data as at 31.03.2021.
Inflation Surprise a Near Certainty
To summarise, disrupted supply will meet recovering demand in Q2, creating additional pressure on prices. Producer prices are already on the rise worldwide and the consumption push will be the match lighting up the inflation fire over the quarter. The consensus expects inflation this year to reach 2.9% in the US and 1.4% in the Eurozone. We think these numbers are on the low side and understate the reality: our Inflation Nowcasters have been consistently pointing towards a risk of seeing a large and positive inflation surprise. Our World Inflation Nowcaster has reached the symbolic level of 0.5 standard deviations, which usually implies an average surprise of 38bps. This would see the current consensus forecast of 2.8% for global inflation in 2021 revised up to 3.2%. What is more, there is not a single component of our Inflation Nowcasters that is not pointing in that direction. Digging into history, the last times we saw readings this high were May 1995, March 2000 and January 2011. All of these episodes were followed by inflation beating expectations by an average of 0.6%: +0.5% in 1995, +0.5% in 2000 and +1.0% in 2011. If this was to happen again, then the US CPI would reach a yearly growth rate of 3.6% – levels we have not seen since 2011 and the peak of oil prices, or since 2008 and the aftermath of the strong growth momentum of 2005-2007. Whichever way we look at it, we still see inflation as more likely to surprise investors this quarter than to disappoint. The recent evolution of oil prices suggests the same thing and, to us, that is the short-term risk of Q2.
Figure 4: World Inflation Surprise as a Function of the World Inflation Nowcaster (latest value in red)
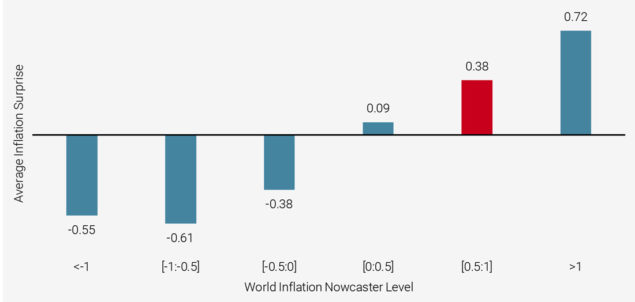
Source: Bloomberg, Unigestion. Data as at 31.03.2021.
Part 2 – What Matters Now is the Longer Run
The second important topic that investors need to understand to help them sail through Q2 is the longer-term perspective. If inflation does make a strong comeback over the quarter, will it be a “transient” inflation shock as the Fed suggested during its March meeting or something more significant, with longer term consequences? This question is not only essential with regard to the performance of risk premia, it also has relevance for the currently ongoing rotation. To answer the question, we think it is essential to clearly lay out our expectations in terms of (1) growth, (2) inflation and (3) interest rates as these three variables are likely to shape the performance of many assets over the coming quarters.
Stronger for Longer
Two key factors could explain why the current higher nominal growth situation that the Fed only foresees for this year could expand into 2022 and 2023. The first lies on the government spending side. As we have explained many times, especially in the US, the negative growth shock coming from the lockdowns has been more than offset by the various fiscal packages deployed jointly in North America, Europe and Asia. There are two telling signs of this excess stimulation. First, saving rates are still towering above their own history while GDP growth surpasses all recovery periods for the past 30 years. In 2009, the recession ended in Q1, but it wasn’t until Q4 of that year that GDP growth hit 2%. In 1991, the US economy had to wait until Q1 1992 to see a quarter of above-potential growth. This time, US GDP growth already hit 4.1% in Q4 of last year for a much lower potential growth (1.8% according to the Fed and the IMF). We expect the Q2 number to be just shy of 5%, with the strong momentum maintained into the following quarters (6.9% and 7% respectively for Q3 and Q4). The Fed also acknowledged that the positive growth shock should continue in 2022 and 2023, with both forecasts above potential growth.
The second telling sign that the growth situation should remain strong for the foreseeable future lies in the employment market, where the evolution of unemployment rates leaves little doubt. The US unemployment rate stands at 6.2%, a level reached in 1994, four years after the end of the 1990s recession and in 2014, five years after the end of the 2008 recession. This coordinated action of major governments is currently impacting economic activity, but we have not yet seen its full extent and there is more to come. The IMF expects a primary deficit of -5.7% of GDP this year in the case of advanced economies, after last year’s -13%. In other words, the stimulation will continue globally. As highlighted in Figure 5, a 4% to 5% growth scenario over the next two years would open the door to inflation beating its “potential” level of 1.8% in the US by more than 1% for the next two years. We could therefore see inflation that regularly exceeds 3% on the pace of growth alone.
Figure 5: Excess Growth vs. Excess Inflation until 2022
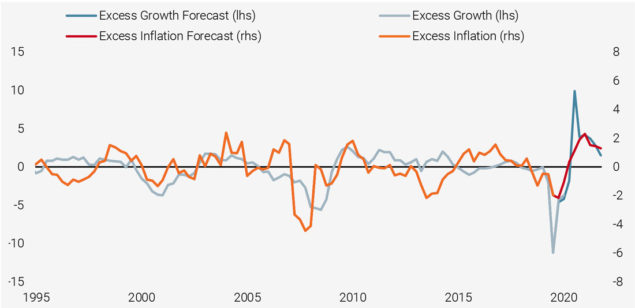
Reading note: “excess growth” and “excess inflation” stand for the difference between recent values and their recent average. The red and dark blue lines extrapolate recent numbers based on private economists’ forecasts.
Source: Bloomberg, Unigestion. Data as at 31.03.2021.
Has the Fed Got It Wrong?
Usually, when rapid economic growth translates into rapid inflation, central banks raise rates to slow down activity and counter the mounting inflationary pressures. However, this time the Fed has made it clear that it is now ready to tolerate more inflation in the years to come. It has stated a target inflation rate of 2% to 2.5% “on average” over a given three-year period. This clearly means that inflation in the US could overshoot the 2% level without the Fed doing a thing about it. As Figure 6 shows, the Fed’s dot plot sees an unchanged median of no rate hikes until 2023. This is in spite of the previously mentioned significant upward revision to its macro scenario. It is hard to know if the Fed will be behind the curve this time around.
Figure 6: Fed’s Dot Plot from Their March 2021 Meeting
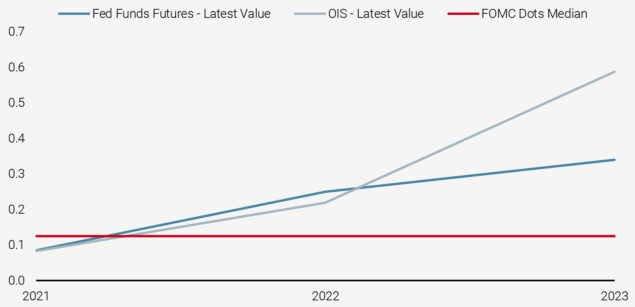
Source: Bloomberg, Unigestion. Data as at 31.03.2021.
Is the Beta Party Over?
What does this higher growth/higher inflation situation mean for financial markets? In our opinion, the main logical outcome should be higher long-term rates. This rise in long-term rates is not necessarily a negative phenomenon for assets globally, but at the moment it is poorly priced in. Private economists expect rates to reach 2.2% in 2022 and 2023, an unrealistic hypothesis from the perspective of the scenario we have just detailed. While investors are usually conscious of the duration attached to fixed income products, it is less the case when it comes to the duration of equities. Although coupons are fixed, dividends offer an exposure to nominal growth that can offset a part of the negative impact of rising rates. Yet, balancing earnings growth with rate rises is essential to understanding that the beta party will probably be muted for some time now.
Figure 7 details an estimation of the impact on the performance of the MSCI World index of (1) changes in 10-years rates and (2) earnings progressions, based on the Gordon and Shapiro formula. From the current level of 1.6% for 10-year US rates, a 1% rate increase, with all other things being equal, should lead to a -8% return for the MSCI World index. Such a rising yield environment would occur as earnings get revised up. Should 10-year rates reach 2.6%, it would take about 25% of earnings growth to offset that impact. Earnings target are already ambitious, but the macro situation is strong. We could see slightly negative returns from equities over the quarter, but it all depends on the pace at which this combination of forces hits the market. In short, the rising rates environment that we expect is more likely to weigh on the beta side of markets. As regional equity indices and factors do not all have the same sensitivity to rates or the same exposure to the growth recovery, this should open the door to a comeback of alpha over beta.
Figure 7: MSCI World Return as a Function of Earnings Progression and Rates Variation
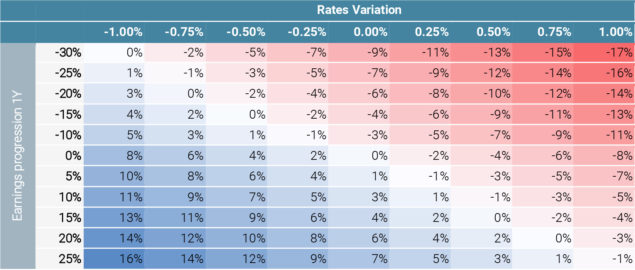
Reading note: this table shows estimated impacts of changing longer-term rates and earnings growth on the returns of the MSCI World index. It uses the Gordon and Shapiro formula to which the differential operator is applied to derive sensitivities to two factors: rates and dividend growth rate. Dividend payout ratio is assumed to remain unchanged.
Source: Bloomberg, Unigestion. Data as at 31.03.2021.
Part 3 – Trend is Your Friend, Momentum Your Enemy
With inflation and growth revisions leading to higher rates and given the above conclusion about alpha over beta, where is it that investors need to focus their attention?
First and foremost, there is a large dispersion already taking place beneath the beta surface. Figure 8 illustrates this: the differences between the lowest and the highest return for each month between the S&P 500’s sectors have rarely been as high as they currently are. The last time we saw such dispersion was in January 2000 and March 2009. In 2009, the US 10-year rate had increased from 2.2% to 3.8%, as the growth and inflation environment was getting distilled into asset prices. This time the differences could become even more exacerbated given the scale of the stimulation at play.
However, equity sectors are not the only place where we can find such dispersions. As Figure 8 also highlights, there is a larger asset rotation currently taking place, agitating geographical indices across the equity and bond spaces alike. To better grasp how the dispersion trades could prosper through Q2, we think it is essential to assess the contribution of the sentiment and valuation elements and their influence over equity factors and alternative risk premia. In other words, the extent to which higher growth and higher inflation impact rates should guide the performance of styles and factors and, by extension, decide the fate of sectors and geographic indices.
Figure 8: Equity Sectors Returns Dispersion (left) and Equity and Bonds Geographical Dispersion (right)
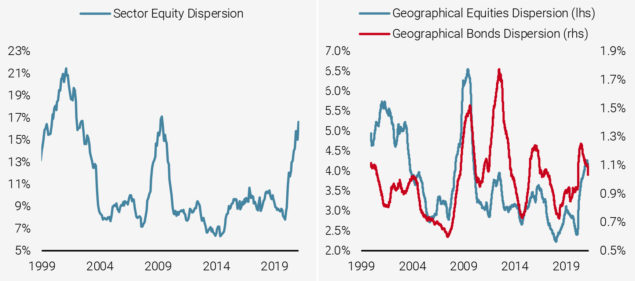
Reading note: these charts show the difference between the higher and lower returns across the S&P 500 sectors for each month (left) and geographical indices for bonds and equities (right).
Source: Bloomberg, Unigestion. Data as at 31.03.2021.
Bye-Bye Momentum…
In terms of sentiment, last quarter saw dramatic changes in the positioning of the representative investor that partially explains the increased dispersion that we are now seeing. Entering into Q1, the most rewarded investment theme was that of Growth, by which we mean the outperformance of any asset profiting from a recovery period. What had started to happen since the beginning of the year was more of a beta-neutral rotation than anything else: the MSCI World index finished the quarter with a return of 3%, while more regional indices or factor-based combinations of stocks showed a lot more dispersion. The Euro Stoxx 50 returned more than 7% and the FTSE MIB, 8%, while the Nasdaq only rose by 3%, explaining in part the aforementioned dispersion within the sectors of the S&P 500. All of this price action says a lot about what has been happening in the equity space: Momentum has been lagging while Value and Growth have been recovering. We see traces of this in the Trend Following signals presented in Figure 9, which shows the overall development of selected trends since May 2020. The most profound change is in investor sentiment towards duration, which reflects well the macro elements detailed earlier. As at the end of March, duration was the least followed trend. In contrast, cyclical equities have benefited from a sentiment recovery, which now leaves them ahead of defensive equities in terms of trend signal. Despite the lag that they are now experiencing, defensive equities have been the only ones to show positive sentiment throughout the period. A final observation to note concerns the USD momentum recovery that started earlier this year and against which commodity currencies are fighting hard.
Over Q2, we expect a continuation and an accentuation of these trends:
- Higher growth and inflation should lead to higher rates, and the defensive sentiment regarding duration should remain firmly in place.
- Within this context, cyclical equities should maintain a positive trend, outperforming momentum-related stocks, which tend to be more sensitive to duration.
- With stronger growth feeding into an increased consumption of commodities, anything commodity-related will grab the attention of investors. The backwarded curves here are another reason to invest more in this trend, bearing in mind that we could see some volatility.
- The recovery in the USD is likely to be maintained as it continues to benefit from the strong US growth and inflation signals, especially when compared to the rest of the developed world. This early trend should continue unfolding over the course of Q2.
Figure 9: Momentum by Asset Type
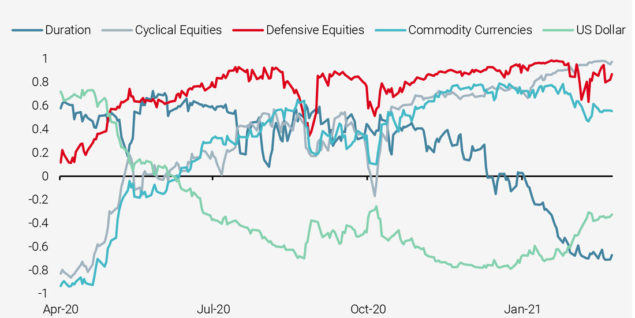
Reading note: this chart shows the average trend signal across different types of assets. Duration stands for the average signals for bonds futures; Cyclical Equities for the average across the Russell 2000, Euro Stoxx 50 and Topix futures, Defensive is Nasdaq, S&P 500 and SMI futures; Commodity Currencies is for AUD, NZD, NOK, SEK and CAD vs. the USD; US Dollar stands for an equal -weighted basket of developed market and emerging market currencies vs. the USD.
Source: Bloomberg, Unigestion. Data as at 31.03.2021.
…Hello More Dispersion
We think that the short and medium-term macro situation we are expecting opens the door to two phenomena: first, a domination of dispersion over beta trades and second, an amplification of the recently observed trades. We disagree with those who expect a rapid return to the pre-Covid-19 situation. In our opinion, Figure 10 justifies this belief: the Covid-19 crisis at the start of 2020 led Momentum to outperform while anything Trend, Carry or Value-related collapsed. Trend has recovered to some extent while Carry and Value are still clearly lagging in their feeble recovery. Over the next quarter we expect this factor/style rotation to keep unfolding.
Figure 10: Rebased Performance of Key Market Factors
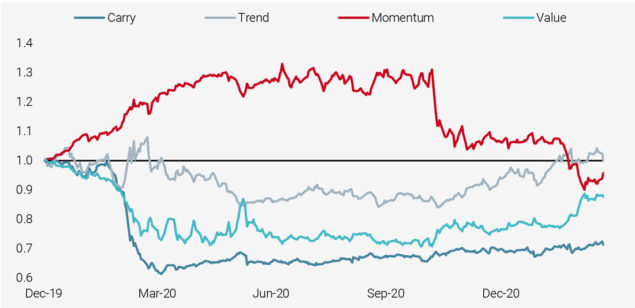
Reading note: Trend here stands for “cross-asset trend following”, Momentum for “equity momentum factor”, Carry is an average across different types of carry strategies (forex, credit, volatility and commodities) and Value stands for “equity value factor”.
Source: Bloomberg, Unigestion. Data as at 31.03.2021.
Carry strategies have historically been solid diversifiers during periods of rising inflation. The present situation could very well be comparable: carry spreads will increase on the back of central banks increasingly disagreeing on the right way to combat rising inflation, while increases in global rates will replenishing the overall level of the carry. In short, with rising rates reflecting the nominal recovery, our view for the coming quarter is the following: Trend (and Carry) is your friend, Momentum your enemy.
Naturally, the question that then arises is where to look in terms of securities and markets. Figure 11 shows the top and bottom five correlations between securities and the four factors (Trend, Carry, Momentum and Value). Currently, the INR is an interesting Value play, while commodity currencies are decently correlated to both Trend and Carry. The Topix and the Euro Stoxx 50 are also correlated with Trend. Finally, the Nasdaq and bonds are positively correlated to Value – and this is where we do not want to be overweight. Later this quarter, cyclical equities, relative bond positioning, the USD and cyclical commodities should profit even more from this situation. The expensive and rate-sensitive assets that profited from the pandemic will be in a weaker position as rates will increase and pre-Covid-19 habits will resurface. As the economic recovery gathers pace, Momentum will be a world that is left behind. It may be hard to fully comprehend now, but this quarter will be pivotal and will deliver a stark warning for investors: inflation is the risk, not recession.
Figure 11: Top and Bottom 5 Correlations between Carry, Trend, Momentum, Value and Individual Securities
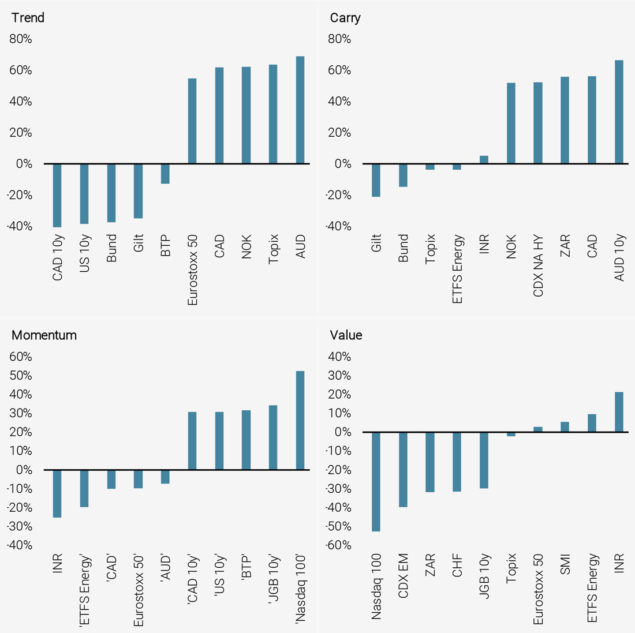
Source: Bloomberg, Unigestion. Data as at 31.03.2021.
Conclusion
As Q2 and the rest of the year progresses, growth and inflation should keep surprising to the upside, justifying higher rates. Rising rates are a reflection of a better macro situation and are not usually an issue for markets. However, given the overall market positioning, it should lead to a further rebalancing both between and within markets. This quarter should see beta poorly rewarding investors, while alpha should take centre stage. In this context, we are negative on anything Momentum-related and prefer to invest in the continuation of the great rotation, favouring the USD, Trend and Carry positions, as well as anything tied to cyclical commodities.
1Notably see the “putty-clay” model of Gilchrist, S., & Williams, J. C. (2000). Putty-clay and investment: a business cycle analysis. Journal of Political Economy, 108(5), 928-960.
Important information
This document is provided to you on a confidential basis and must not be distributed, published, reproduced or disclosed, in whole or part, to any other person.
The information and data presented in this document may discuss general market activity or industry trends but is not intended to be relied upon as a forecast, research or investment advice. It is not a financial promotion and represents no offer, solicitation or recommendation of any kind, to invest in the strategies or in the investment vehicles it refers to. Some of the investment strategies described or alluded to herein may be construed as high risk and not readily realisable investments, which may experience substantial and sudden losses including total loss of investment.
The investment views, economic and market opinions or analysis expressed in this document present Unigestion’s judgement as at the date of publication without regard to the date on which you may access the information. There is no guarantee that these views and opinions expressed will be correct nor do they purport to be a complete description of the securities, markets and developments referred to in it. All information provided here is subject to change without notice. To the extent that this report contains statements about the future, such statements are forward-looking and subject to a number of risks and uncertainties, including, but not limited to, the impact of competitive products, market acceptance risks and other risks.
Data and graphical information herein are for information only and may have been derived from third party sources. Although we believe that the information obtained from public and third party sources to be reliable, we have not independently verified it and we therefore cannot guarantee its accuracy or completeness. As a result, no representation or warranty, expressed or implied, is or will be made by Unigestion in this respect and no responsibility or liability is or will be accepted. Unless otherwise stated, source is Unigestion. Past performance is not a guide to future performance. All investments contain risks, including total loss for the investor.
Unigestion (UK) Ltd. is authorised and regulated by the UK Financial Conduct Authority (FCA) and is registered with the Securities and Exchange Commission (SEC). Unigestion Asset Management (France) S.A. is authorised and regulated by the French “Autorité des Marchés Financiers” (AMF). Unigestion Asset Management (Canada) Inc., with offices in Toronto and Montreal, is registered as a portfolio manager and/or exempt market dealer in nine provinces across Canada and also as an investment fund manager in Ontario, Quebec and Newfoundland & Labrador. Its principal regulator is the Ontario Securities Commission. Unigestion Asset Management (Düsseldorf) SA is co-regulated by the “Autorité des Marchés Financiers” (AMF) and the “Bundesanstalt für Finanzdienstleistungsaufsicht” (BAFIN). Unigestion SA has an international advisor exemption in Quebec, Saskatchewan and Ontario. Unigestion SA is authorised and regulated by the Swiss Financial Market Supervisory Authority (FINMA). Unigestion SA’s assets are situated outside of Canada and, as such, there may be difficulty enforcing legal rights against Unigestion SA.
Document issued: April 2021.