MiViews Q4 2021: Diverging growth and inflation: is stagflation a real possibility?
Overview
After a strong global economic recovery in the first half of the year, the events of the third quarter – weakening growth and continuing inflation – have become concerning and raise the potential risk of stagflation. Stagflation is rare and the opposite of the macroeconomic environment we have experienced over the last decade. While it would be a nightmare outcome for the economy, for monetary policy and for investors, it is not our core scenario over the coming months. For this, we would need to see a more intense continuation of the current dynamic and a significant stalling in the reopening of economies.
Our near-term macro scenario therefore remains positive and our portfolios are positioned accordingly – towards both growth-oriented and real assets. We expect to favour the latter for some time while reducing the former if growth continues to fade.
A Decoupling of Growth and Inflation
An emerging theme at the start of this year was the pro-cyclical recovery in demand and prices as economies began to reopen following the distribution of coronavirus vaccines and waning uncertainty. This theme stalled in Q3 with the spread of the Delta variant and a fading fiscal impulse. As the left chart in Figure 1 demonstrates, our proprietary Growth Nowcaster and Newscaster indicators, which respectively synthesise traditional macro fundamental and alternative news sentiment data, turned at the end of Q2 and have since been steadily declining to long-term levels. This dynamic is seen in both of the two largest economies, the US and China, whereas the Eurozone has thus far remained resilient to the broader slowdown (Figure 1, right chart). However, given a deterioration in the latest Eurozone data (only 40% of which is improving) and its linkages to the slowing Chinese economy, it is probable that the situation in Europe will soon follow the path of its global peers. It is noteworthy that global consumption has failed to catch-up to the broader expansion, as its recovery would have placed growth on a more sustainable basis.
Figure 1: Global Growth Nowcaster and Newscaster (left) and Regional Growth Nowcasters (right)
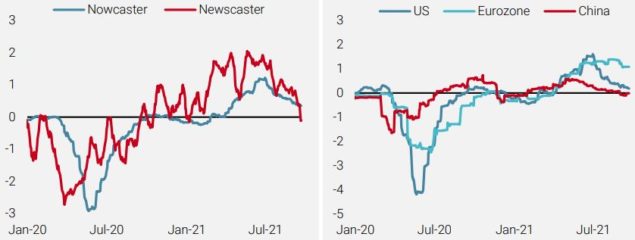
Sources: Bloomberg, Unigestion. Data as at 22.09.2021.
Demand is one driver of the prices of goods and services, and while this factor has been fading, supply continues to support the inflationary pressures that began building at the end of last year. Figure 2 presents a long-term history of our Global Inflation Nowcaster and its underlying components, showing how the indicator is finding broad support, especially from Input Prices, Wage Inflation, and Expected Inflation. Importantly, despite the growth impulse turning over, inflationary pressures have so far remained stable at these levels, with half of underlying data continuing to point toward a high inflationary regime.
Figures 2: Global Inflation Nowcaster and Underlying Components
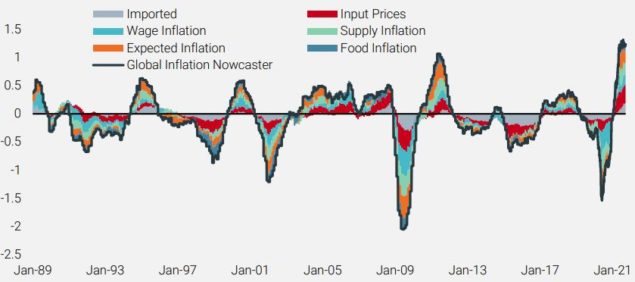
Source: Bloomberg, Unigestion. Data as at 22.09.2021.
Central bankers have continued to insist that these inflationary pressures are transitory, viewing the run-up in prices as driven by transient supply shocks. Supply constraints should ease but may take longer than expected as producers warn of issues persisting into next year. Furthermore, the ingredients for persistent inflation are brewing: inflation expectations have been rising and nominal wage growth has been strong and consistent despite unemployment falling from pandemic peaks. It is through these channels – pockets of price increases leading to an inflationary mindset that sees a broader rise in prices from firms as well as employees asking for higher wages – that a transitory supply shock transforms into a challenging problem for policymakers. Finally, the secular forces pushing inflationary pressures and costs down for the last few decades – an ageing population, globalisation, and technological innovation – will have, at best, a weaker impact going forward and possibly reverse (e.g., repatriation of certain supply chains). It is due to these factors that we believe inflation is not a transitory phenomenon but rather will be with us well into next year.
The What and Why of Stagflation
Indeed, the combination of weakening growth and continuing inflation has become quite concerning to us, as it raises the potential risk of stagflation. Stagflation is, in many ways, a nightmare scenario for the economy, monetary policy, and investors: real economic growth is low or even negative at the same time that prices move ever higher, leading to lower standards of living and high unemployment. While it is unlikely that growth falls and concurrently inflation rises given the linkages between these macroeconomic forces, it is not impossible. Bruno and Sachs1 presented a framework for stagflation that rests on two key conditions: (1) a large and unexpected increase in prices for inputs produced externally requiring a reduction in the standard of living for importing countries, and (2) wage inflexibility that reduces demand for labour and thereby increases unemployment. They argue that these elements are critical to understanding the rare cases of stagflation in the recent past: OECD countries in the 1970s. Figure 3 shows the price of oil in the local currency of four key economies (the US, UK, Germany, and France) as the oil embargo of 1973 hit prices and reverberated throughout the decade, meeting condition (1) of Bruno and Sachs’ framework.
Figures 3: Price of a Barrel of Crude Oil (WTI) in Local Currency
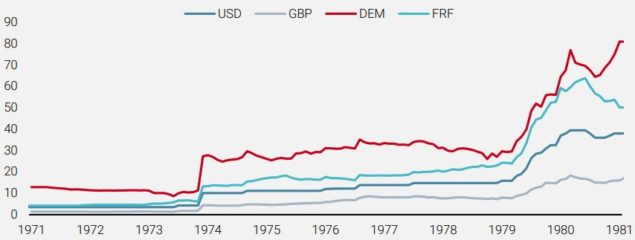
Source: Bloomberg, Federal Reserve Bank of St. Louis, Unigestion. Data as at 28.09.2021.
Figure 4 charts growth versus inflation for each of these four economies, indicating how they followed a similar pattern in response to the impact of the oil shock. The 1970s began with a cyclical recovery, as growth and inflation moved up together until the oil crisis (gray vertical line). After that point, growth and inflation decoupled with growth collapsing and inflation persisting or even surging in the case of the UK.
Figure 4: Growth and Inflation (1960-1985)
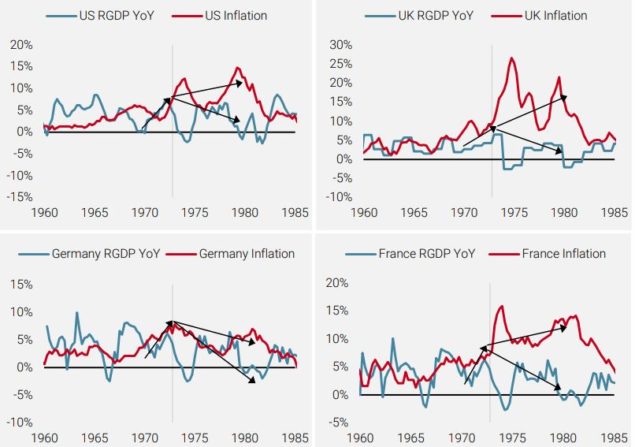
Reading note: Pre-reunification German RGDP growth based on GDP-weighted growth of East and West Germany; pre-reunification German inflation based on West German inflation.
Source: Bloomberg, Unigestion. Data as at 28.09.2021.
As Bruno and Sachs discuss, the downward inflexibility of wages feeds into the price/wage spiral and can shift an economy from an inflationary expansion to stagflation. The chart on the left in Figure 5 shows how US nominal wages during the 1970s continued to grow steadily, as employees demanded higher wages in the face of higher consumption prices. However, this nominal wage growth was out of line with deteriorating economic conditions and lower productivity, leading to layoffs and higher unemployment (Figure 5, right chart). Importantly, real wage growth collapsed as nominal wages could not keep up with goods inflation, leading to lower real incomes and standards of living.
Figure 5: Wages vs Productivity in the US (left) and Unemployment Rates (right)
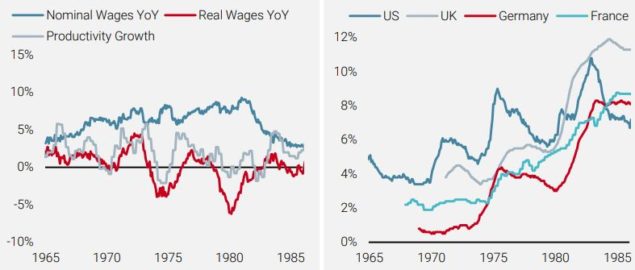
Reading note: Productivity Growth is the year-over-year change in the output per hour of labour in the non-farm business sector. Pre-reunification German unemployment rate based on West German unemployment rate.
Source: Bloomberg, Federal Reserve Bank of St. Louis, Unigestion. Data as at 28.09.2021.
Monetary policy is very challenging during stagflation: as Bank of England Governor Bailey recently discussed, the monetary response to inflationary pressures should involve higher target rates (and not lower asset purchases). Unfortunately, policy tightening in the face of declining growth is likely to worsen the economic downturn and lead to severe pain for many. At the same time, stimulation via lower target rates or additional asset purchases is likely to add further fuel to the inflation fire. Caught between Scylla and Charybdis, central bankers have to navigate a treacherous path. In the US, it took Fed Chairman Volcker hiking the Fed Funds Rate to its highest levels in modern times to break the back of inflation and expectedly push the economy into recession.
Where Are We Today?
Let us be clear: stagflation is not our near-term core scenario but rather a growing tail risk. We would need to see a continuation of the current dynamic, in particular economies stalling in their reopening, to change our view. It is also important to point out that the example of the 1970s is not a perfect analogy for today: the global economy is coming out of an historic period of lockdowns, the price of oil has less of an impact on individuals as the source of today’s supply shock is more varied, and monetary policy has gained the experience of the last period of stagflation. However, given the dramatic impact of stagflation on markets, we continue to assess the situation closely. For instance, input prices for many goods – oil, lumber, copper for example – have been rising dramatically since the trough of the pandemic. As Figure 6 shows, producer prices have risen faster than consumption prices, providing further upward pressure on inflation if firms pass on these additional higher costs to consumers.
Figure 6: PPI vs CPI
Reading note: UK is based on RPI growth.
Source: Bloomberg, Unigestion. Data as at 28.09.2021.
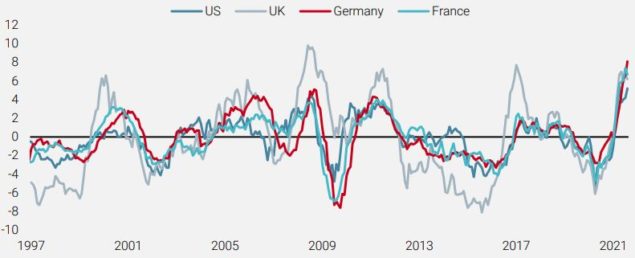
At the same time, nominal wage growth has remained relatively constant despite unemployment figures receding. Figure 7 compares the growth in hourly wages in the US against the unemployment rate, the (in )famous Phillips curve. While we do not intend to make a case for or against the curve or its variations, it is useful to put the current situation into the context of the 1970s (dark blue) as well as the last couple of decades (light blue). While the number of data points remains low, thus far wages have not exhibited the inverse relationship typically expected over the short run. A persistence of this dynamic would signal that the economy is heading into a price/wage spiral and stagflation.
Figure 7: US Wage Growth vs Unemployment Rate
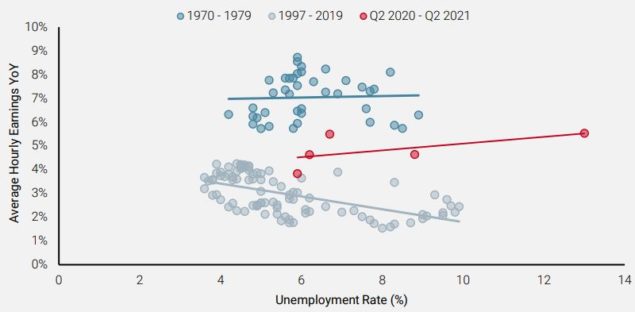
Source: Bloomberg, Federal Reserve Bank of St. Louis, Unigestion. Data as at 28.09.2021.
Few Shelters in the Stagflation Storm
Stagflation is, by and large, the opposite of the macroeconomic environment we have had for most of the last decade: decent growth and muted inflation pressures. Thus, investors have moved into positions that benefited the most over the last decade: nominal bonds (where yields continued to grind lower and have offered diversification) and equities (especially those with long-term growth prospects that have benefited from falling discount rates). However, the reversal of the macro environment to a period of stagflation would lead to a significant reversal in these markets. Indeed, asset performance of the 1970s reveals the challenge stagflation poses to the fixed nominal cash flows provided by bonds as well as the growth-sensitive cash flows of equities. The left chart in Figure 8 shows the yield on 10-year bonds across the four economies discussed above, which provided little diversification to equities over the period and challenged traditional 60/40 (or 50/50) equity/bond portfolios. The right chart in Figure 8 also shows how even though equity markets may have provided some positive nominal returns over the period, their real returns were strongly negative.
Figure 8: 10-year Bond Yields (left) and Cumulative Equity Price Returns from 1970 to 1979 (right)
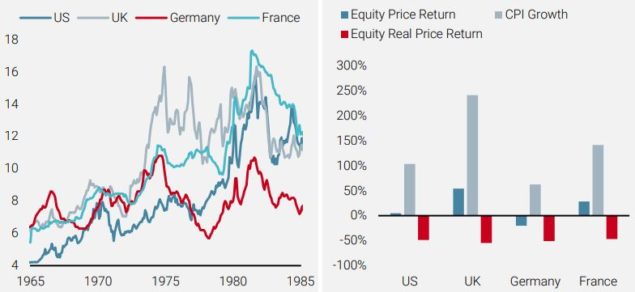
Reading note: Equity market price performance based on Dow Jones Industrial Average/FTSE All-Shares/DAX for US/UK/Germany. France equity market performance based on total share price for all shares. UK CPI Growth based on RPI.
Source: Bloomberg, Federal Reserve Bank of St. Louis, Unigestion. Data as at 28.09.2021.
On the other hand, real assets, which have largely been under-owned for the last decade, should strongly outperform. Breakeven inflation, either directly via swaps or synthetically via long/short exposures in inflation-linked/nominal bonds, should benefit from rising inflation expectations and a potential price/wage spiral. Cyclical commodities, such as energy and industrial metals, should also see further price appreciation as supply remains constrained. Precious metals, like gold, would also stand to benefit as a store hold of wealth and falling real yields. Figure 9 shows the average monthly performance of growth (credit spreads and equities), defensive (government bonds), and real assets (inflation breakeven and commodities) since 1999 and compares that to their performance in “Goldilocks” and “Stagflation” months2. As the chart demonstrates, the dispersion between these two regimes is significant, making the transition from a Goldilocks scenario (as arguably we had at the beginning of this year) to an inflation shock with depressed growth a challenging one for investors.
Figure 9: Average Monthly Asset Performance
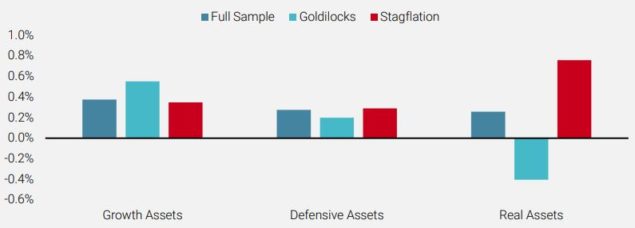
Source: Bloomberg, Unigestion. Data from 31 December 1998 to 30 June 2019.
Conclusion
Before the 1970s, the concept of stagflation – falling growth and concurrent rising inflation – was thought to be impossible. Indeed, the combination of circumstances that give rise to stagflation are quite rare, and so many investors have not had the experience of managing portfolios during such tumultuous times. In our view, it remains too early to sound the alarm on stagflation and our near-term macro scenario remains positive: a subsiding of coronavirus fears and continued economic reopening. Thus, our dynamic portfolio exposures are tilted towards both growth-oriented assets, such as equities and credit, and real assets, in particular inflation breakevens and cyclical commodities. We expect the real asset exposure will be with us for some time, but if the risk of stagflation rises, we will progressively reduce our growth exposure to ride out the difficult storm.
1Michael Bruno and Jeffrey Sachs, Economics of Worldwide Stagflation. Cambridge, MA.Harvard University Press, 1985.
2 “Goldilocks” months are defined as those where our Global Growth and Inflation Nowcasters signalled low to very low risk of recession or an inflation shock. “Stagflation” months are defined as those where our Inflation Nowcater signalled high to very high risk of an inflation shock but our Growth Nowcaster signalled the economy was not in a strong expansion (low to very high recession risk). Unsurprisingly, periods of concurrent high to very high recession and inflation shock risk have been very rare in the past twenty years and so do not provide enough data to make reasonable empirical conclusions.
Important information
This document is provided to you on a confidential basis and must not be distributed, published, reproduced or disclosed, in whole or part, to any other person.
The information and data presented in this document may discuss general market activity or industry trends but is not intended to be relied upon as a forecast, research or investment advice. It is not a financial promotion and represents no offer, solicitation or recommendation of any kind, to invest in the strategies or in the investment vehicles it refers to. Some of the investment strategies described or alluded to herein may be construed as high risk and not readily realisable investments, which may experience substantial and sudden losses including total loss of investment.
The investment views, economic and market opinions or analysis expressed in this document present Unigestion’s judgement as at the date of publication without regard to the date on which you may access the information. There is no guarantee that these views and opinions expressed will be correct nor do they purport to be a complete description of the securities, markets and developments referred to in it. All information provided here is subject to change without notice. To the extent that this report contains statements about the future, such statements are forward-looking and subject to a number of risks and uncertainties, including, but not limited to, the impact of competitive products, market acceptance risks and other risks.
Data and graphical information herein are for information only and may have been derived from third party sources. Although we believe that the information obtained from public and third party sources to be reliable, we have not independently verified it and we therefore cannot guarantee its accuracy or completeness. As a result, no representation or warranty, expressed or implied, is or will be made by Unigestion in this respect and no responsibility or liability is or will be accepted. Unless otherwise stated, source is Unigestion. Past performance is not a guide to future performance. All investments contain risks, including total loss for the investor.
Unigestion (UK) Ltd. is authorised and regulated by the UK Financial Conduct Authority (FCA) and is registered with the Securities and Exchange Commission (SEC). Unigestion Asset Management (France) S.A. is authorised and regulated by the French “Autorité des Marchés Financiers” (AMF). Unigestion Asset Management (Canada) Inc., with offices in Toronto and Montreal, is registered as a portfolio manager and/or exempt market dealer in nine provinces across Canada and also as an investment fund manager in Ontario, Quebec and Newfoundland & Labrador. Its principal regulator is the Ontario Securities Commission. Unigestion Asset Management (Düsseldorf) SA is co-regulated by the “Autorité des Marchés Financiers” (AMF) and the “Bundesanstalt für Finanzdienstleistungsaufsicht” (BAFIN). Unigestion SA has an international advisor exemption in Quebec, Saskatchewan and Ontario. Unigestion SA is authorised and regulated by the Swiss Financial Market Supervisory Authority (FINMA). Unigestion SA’s assets are situated outside of Canada and, as such, there may be difficulty enforcing legal rights against Unigestion SA.
Document issued: October 2021.