Corporate earnings season for the second quarter of 2019 has begun and will kick into high gear over the next two weeks. Following a significant turn in monetary policy and continuing geopolitical risks such as a trade war and tensions with Iran, investors seem to have a fairly subdued assessment of earnings results. The mood has changed notably since the 3Q 2018 earnings season, when aggregate earnings-per-share (EPS) growth for firms in the S&P 500 was 27% year-on-year, beating lofty expectations. Despite the current dour mood, with Q2 2019 EPS growth for US firms expected to decline by 2% compared to a year ago, this earnings season is an important one to follow, and we are closely monitoring this moment of truth for an indication of the likely direction ahead for the economy and asset returns. As investors know, the global economy has slowed significantly from its highs in early 2018. By our measures, growth hit potential levels in the early part of this year and over the last few months has shown signs of stabilisation. However, any coincident measure of economic activity is imperfect, and the earnings season provides an additional point of triangulation to confirm how deep the slowdown has been and its future direction. Looking at sales growth, we see a clear peak for US and Eurozone firms in mid-2018. Since that time, sales growth has slowed for S&P 500 companies toward the post-2009 average of 5%, while sales for firms in the Euro Stoxx 50 have fallen from their 2017-2018 levels. Given this context, a key question is to what extent the stabilisation in growth has helped to support corporate sales growth. For much of 2018, firms in the US and, to a lesser extent, Europe had been able to combat slowing sales growth with margin expansion. But margins are showing signs of flattening in the US and contraction in Europe as many of the tailwinds that had supported margin growth – globalisation, consolidation, moderate wage pressures, and lower taxes to name a few – are fading. The logical result is that firms’ bottom lines have been under pressure, and earnings growth has declined meaningfully. Firms in the S&P 500 are now seeing EPS expand by about 7% in aggregate, whereas EPS for firms in the Euro Stoxx 50 is contracting. Will this trend continue, or will we see a stabilisation and perhaps a modest recovery in earnings growth?„MOMENT OF TRUTH“ – Earth, Wind & Fire, 1971
What’s Next?
Corporate profitability reveals much about the economy
Declining profitability is a useful presage of oncoming recession: as firms contend with lower income and pressures on their free cash, they typically cut back spending and hiring. These cutbacks, in turn, negatively impact other businesses, whose sales take the hit, and households, who lose their jobs or see their take-home pay reduced. And the cycle continues, with sales and profitability falling further, causing the slowdown to deepen and transform into a recession. Indeed, declining profitability preceded nearly every US recession. To be clear, we do not believe we are at this point now, but we will be tracking this earnings season closely to see how resilient profits have been in the face of the economic slowdown thus far.
Importantly, the reporting season should also give a clearer picture into how tariffs and the trade war more broadly are impacting corporates. We have seen the impact of trade tensions on global trade, but so far it seems much of the increase in imported goods’ prices has been absorbed by margins (see “You Spin Me Round”, 28 May 2019). Can firms continue to bear these costs, and how are they adapting their investment plans given the uncertainty they face? These and other second-round impacts of tariffs and trade tensions are very difficult to quantify, but we should get a better sense when firms hold earnings calls over the next couple of weeks.

There is a lagged affect in financial markets to a turn in earnings growth. Typically, equities continue to rally higher as investors extrapolate the recent past forward. And even though earnings growth moderates, it remains strong, supporting valuations and the case for a long equities bias. Corporate credit also reaps these benefits with attractive yields relative to sovereign bonds and de minimis probability of default given strong earnings. Once the turn in earnings growth becomes clearer and its decline becomes more entrenched, investors reprice their expectations for future earnings growth, typically from much too optimistic levels to much too pessimistic. They reduce the growth bias of their portfolios and increase their allocation to defensive sectors and hedging assets, such as sovereign nominal bonds that have typically underperformed equities and credit and now offer relatively attractive yields (though in the current context, nominal yields are already quite low). This shift aligns yields closer to the “Fed model,” narrows the relative performance gap between equities/credit and bonds, and eventually reverses it months after the turn in earnings growth. Clearly, easier monetary policy can stimulate demand and ease financing costs, supporting earnings growth and outperformance of growth assets, but lower yields are not always a panacea for a deteriorating operating environment. Thus, declining earnings growth has an important bearing on the relative performance of equities and credit versus nominal bonds. Credit tends to have a longer lag than equities since earnings growth needs to decline sufficiently to cause investors to reassess their assessment of firms’ probability of default. But historically this relationship takes between six to twelve months to transpire. As EPS growth in the US peaked in late 2018 and valuations there are high, the forward guidance will be important. If it is poor, then a quick recovery in earnings becomes less likely, as does the prospect of a continuation in the outperformance of equities/credit since the beginning of the year. And if the negative guidance extends beyond export-focused firms to the broader universe, concerns about trade contagion and a deeper slowdown will grow. We do not believe these risks are sufficient to adapt the portfolio to a more defensive posture, but it does motivate our relatively light overweight in equities and more positive view on credit.Pay close attention to forward guidance

Moment of Truth by Earth

Our medium-term views remain cautious, and we prefer to get exposure to growth via high yield corporate credit. We are also complementing our modest equity exposure with options to protect the portfolio in the case of equity drawdowns. Over the month of July thus far, the Multi Asset Risk Targeted Strategy is up 0.8% versus 0.8% for the MSCI AC World Index and 0.4% for the Barclays Global Aggregate (USD hedged). Year-to-date, the Multi Asset Risk Targeted Strategy has returned 8.0% versus 17.1% for the MSCI AC World index, while the Barclays Global Aggregate (USD hedged) index is up 6.4%. The Multi Asset Risk Targeted Strategy performance is shown in USD net of fees for the representative account of the Multi Asset Risk Targeted (Medium) USD Composite and reflects the deduction of advisory fees and brokerage commission and the reinvestment of all dividends and earnings. Past performance is not indicative of future performance. This information is presented as supplemental information only and complements the GIPS compliant presentation provided on the following page.Strategy Behaviour
Performance Review
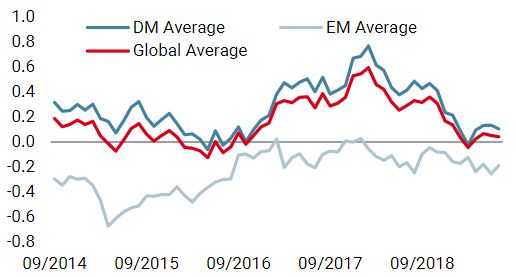
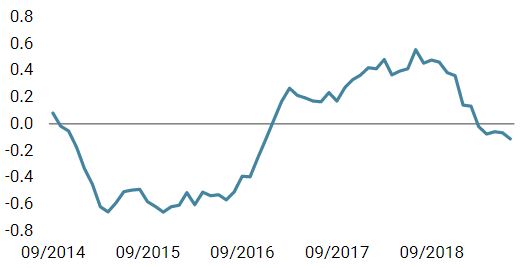
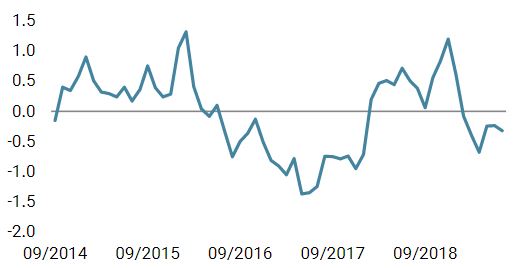
Unigestion Nowcasting
World Growth Nowcaster
World Inflation Nowcaster
Market Stress Nowcaster
Weekly Change
- Our world Growth Nowcaster remained unchanged this week, as an improvement in India was offset by broad weakness elsewhere, particularly Brazil.
- Our world Inflation Nowcaster decreased further this week, mainly driven by continued disinflationary prospects in the US.
- Market stress picked up modestly this week, as tighter liquidity conditions pushed up our indicator.
Sources: Unigestion. Bloomberg, as of 19 July 2019.
Important Information Past performance is no guide to the future, the value of investments can fall as well as rise, there is no guarantee that your initial investment will be returned. This document has been prepared for your information only and must not be distributed, published, reproduced or disclosed by recipients to any other person. This is a promotional statement of our investment philosophy and services only in relation to the subject matter of this presentation. It constitutes neither investment advice nor recommendation. This document represents no offer, solicitation or suggestion of suitability to subscribe in the investment vehicles it refers to. Please contact your professional adviser/consultant before making an investment decision. Where possible we aim to disclose the material risks pertinent to this document, and as such these should be noted on the individual document pages. Please contact Unigestion for a complete list of all the applicable risks. Some of the investment strategies described or alluded to herein may be construed as high risk and not readily realisable investments, which may experience substantial and sudden losses including total loss of investment. These are not suitable for all types of investors. To the extent that this report contains statements about the future, such statements are forward-looking and subject to a number of risks and uncertainties, including, but not limited to, the impact of competitive products, market acceptance risks and other risks. As such, forward looking statements should not be relied upon for future returns. Data and graphical information herein are for information only and may have been derived from third party sources. Unigestion takes reasonable steps to verify, but does not guarantee, the accuracy and completeness of this information. As a result, no representation or warranty, expressed or implied, is or will be made by Unigestion in this respect and no responsibility or liability is or will be accepted. All information provided here is subject to change without notice. It should only be considered current as of the date of publication without regard to the date on which you may access the information. Rates of exchange may cause the value of investments to go up or down. An investment with Unigestion, like all investments, contains risks, including total loss for the investor. This information is issued by Unigestion (UK) Ltd (“Unigestion”), which is authorised and regulated by the UK Financial Conduct Authority (“FCA”). Unigestion is also registered as an investment adviser with the U.S. Securities and Exchange Commission (“SEC”). This information is intended only for professional clients, institutional clients and eligible counterparties, as defined by the FCA, and qualified purchasers as defined by the SEC and has therefore not been adapted to retail clients. Unigestion Multi Asset Risk-Targeted (USD): 31 December 2014 to 31 March 2019 1: This year is incomplete, it stops in March. Special Disclosure: For presentations prior to 31.03.2018 the strategy was measured against the LIBOR 3M USD + 4%. Beginning April 2018 the firm determined that the benchmark did not accurately reflect the strategy mandate and the benchmark was removed. Definition of the Firm: For the purposes of applying the GIPS Standards, the firm is defined as Unigestion. Unigestion is responsible for managing assets on the behalf of institutional investors. Unigestion invests in several strategies for institutional clients: Equities, Hedge Funds, Private Assets and the solutions designed for the clients of our Cross Asset Solution department. The GIPS firm definition excludes the Fixed Income Strategy Funds, which started in January 2001 and closed in April 2008, and the accounts managed for private clients. Unigestion defines the private clients as High Net Worth Families and Individual investors. Policies: Unigestion policies for valuing portfolios, calculating performance, and preparing compliant presentations are available upon request. Composite Description: The Multi Risk Targeted (Medium) composite was defined on 15 December 2014. It consists of accounts which aim to deliver consistent smooth returns of cash + 5% gross of fees across all market conditions over a 3-year rolling period. It seeks to achieve this by capturing the upside during bull markets while protecting capital during market downturns. Benchmark: Because the composites strategy is absolute return and investments are permitted in all asset classes, no benchmark can reflect this strategy accurately. Fees: Returns are presented gross of management fees, administrative fees but net of all trading costs and withholding taxes. The maximum management fee schedule is 1.2% per annum. Net returns are net of model fees and are derived by deducting the highest applicable fee rate in effect for the respective time period from the gross returns each month. List of Composites: A list of all composite descriptions is available upon request. Minimum Account Size: The minimum account size for this composite is 5’000’000.- USD. Valuation: Valuations are computed in US dollars (USD). Performance results are reported in US dollars (USD). Internal Dispersion & 3YR Standard Deviation: The annual composite dispersion presented is an asset-weighted standard deviation calculated for the accounts in the composite the entire year. When internal dispersion is not presented it is as a result of an insufficient number of portfolios in the composite for the entire year. When the 3 Year Standard Deviation is not presented it is as a result of an insufficient period of time. Compliance Statement Unigestion claims compliance with the Global Investment Performance Standards(GIPS®) and has prepared and presented this report in compliance with the GIPS standards. Unigestion has been independently verified for the periods 1 January 2003 to 31 December 2016. The verification report(s) is/are available upon request. Verification assesses whether (1) the firm has complied with all the composite construction requirements of the GIPS standards on a firm-wide basis and(2) the firms policies and procedures are designed to calculate and present performance in compliance with the GIPS standards. Verification does not ensure the accuracy of any specific composite presentation.
Year
Composite
Return Gross
of FeesComposite Net Return
Benchmark Return
Number of Accounts
Internal Dispersion
Composite 3-Yr Std Dev
Benchmark 3-Yr Std Dev
Composite AUM (M)
Firm
AUM (M)
2015
-1.61%
-2.80%
–
1
–
–
–
127.24
15,550.31
2016
5.05%
3.79%
–
1
–
–
–
129.66
18,144.46
2017
11.16%
9.82%
–
1
–
–
–
169.51
22,340.80
2018
-2.91%
-4.08%
–
1
–
–
–
286.93
21,403.49
20191
5.06%
4.74%
–
1
–
–
–
278.23
21’266.46