- We have dynamically adjusted our riskmanaged portfolio in response to the recent factor rotation and its underlying inflationary drivers.
- Looking forward, we forecast a scenario of rising rates and a moderately inflationary environment, which is likely to provide a supportive macroeconomic environment for the Value factor.
- Our portfolio construction process applies additional interest rate sensitivity controls to protect the portfolio in periods of rising inflation.
Overview
Despite the dramatic market drop of early 2020 and the subsequent spectacular rally, global equity markets had not seen the last of major upheavals. Further disruption followed in Q4 2020, when we witnessed an unprecedented momentum reversal: a rotation out of the ‘Covid winners’ into stocks that had suffered the most since the outset of the pandemic.
The start of 2021 saw the continuation of this market rotation, as ‘reopening’ bets increased and inflation expectations rose. The latter produced its own upheavals in fixed income markets, underpinned by expectations of monetary tightening and rising US yields. While fixed income and equity markets can demonstrate good diversification, within equities, we see varying levels of interest rate sensitivity depending on sector and style.
From this turbulence we saw the re-emergence of the Value style. After several years of poor performance – with some commentators referring to a ‘lost decade’ – cheaper stocks finally started to outperform their more expensive counterparts.
We consider the management of valuation risks to be a long-term driver of performance in our risk-managed equity portfolios. In this paper we seek to uncover the underlying macroeconomic drivers of the recent Value rally. We then demonstrate how we have integrated systematic tools into our investment process that allow us to better protect the portfolio in periods of style rotation while fully exploiting upside potential.
The Story Starts with Momentum: Boost and Reversal
The last week of March 2020 saw developed markets bottoming from a pandemicinduced slump, with the MSCI World index closing almost 35% down from its peak only a month earlier. The subsequent market rally – superlative in its speed and intensity – concentrated on market heavyweights. These included many stocks that had already experienced a ‘good crisis,’ outperforming the index on both the downside and the upside and reaching high valuation levels, namely Technology and Software stocks.
This sustained performance benefitted a popular investment style known as Momentum investing (Figure 1). Investors following this style believe that recent winners will, on average, be future winners.
Figure 1: MSCI World vs MSCI World Momentum
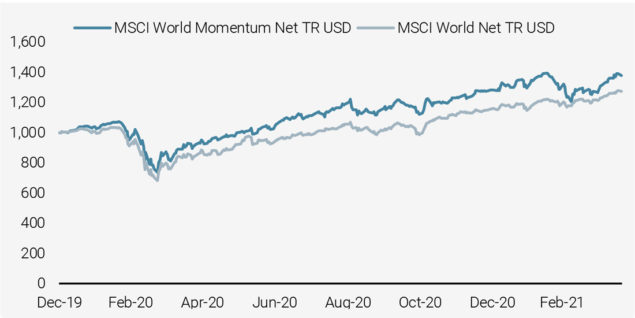
Source: Bloomberg, Unigestion

The tendency of Momentum to rapidly unwind is well observed. For this reason, we do not take a strong directional view on Momentum.

Figure 2: Cumulative Performance per Momentum Quintile of MSCI World (Q1 = Low Momentum, Q5 = High Momentum)
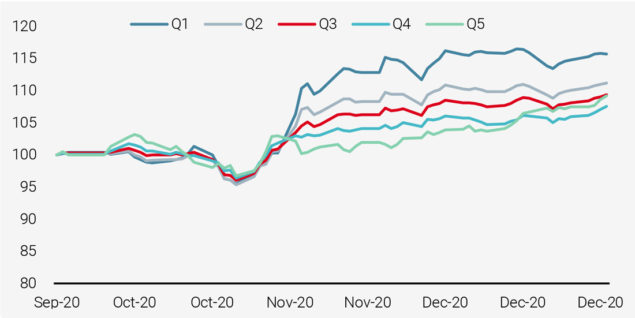
Source: Bloomberg, Unigestion
Low volatility stocks suffered in this exuberant environment as the high-momentum names driving the market until late 2020 were largely historically volatile stocks, often with undesirable valuation profiles.
As 2020 drew to a close, the Momentum style started to lose its grip on markets. Indeed, the so-called vaccine rally of November saw the style sharply reverse its performance (Figure 2) and the year-to-date gains for some popular Momentum implementations almost halved. Q1 2021 saw a continuation of this trend.
The tendency of Momentum to rapidly unwind is well observed. Indeed, for this reason, we do not take a strong directional view on Momentum in our risk-managed portfolios. The Momentum reversal coincided with a period of recovery for the Value style, leading many to question if this was the start of a more supportive market environment.
Value: End of a Lost Decade?
From Q4 2020, signs of a Value recovery began to appear as Momentum reversed. In Q1 2021, value stocks delivered their best quarterly performance since 2001.
The Value premium is generated by identifying stocks that trade at a discount relative to their fundamentals. The style has a long history of delivering robust returns but saw four consecutive years of negative performance between 2017 and 2020, and generally poor returns over the past decade.
Figure 3: Performance of the Value Factor Based on MSCI World Universe
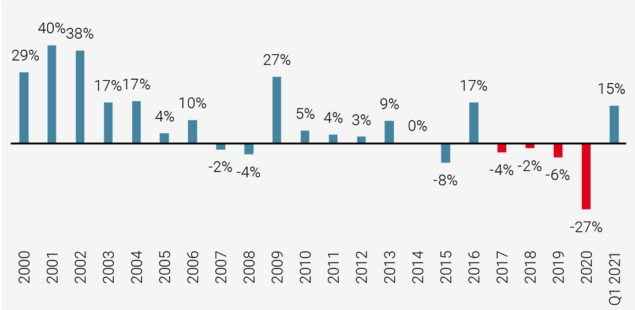
Source: Bloomberg, Unigestion
As part of our investment strategy, we manage valuation risk by favouring reasonably priced segments of the market. As we are witnessing the return of Value, the question arises as to whether the market and the macroeconomic environment are becoming more supportive for Value, or if its recent success is simply a short-lived trend correlated with the unwinding of Momentum.
From Momentum to Value – or Just Anti-Momentum?
Traditionally, Value and Momentum have a low correlation, exhibiting mutually diversifying behaviours. Generally, poor performing stocks tend to be cheap while high-performing stocks tend to be expensive. Short-term dynamics may be more nuanced, as demonstrated by the recent Momentum reversal.
The demise of the Momentum rally in November 2020 coincided with a strong month for Value.
The demise of the Momentum rally in November 2020 coincided with a strong month for Value. A closer look at Value’s performance revealed that it was driven by extremely cheap names that had delivered very poor performance (low Momentum) in the months prior to November. These stocks consisted mainly of the ‘cheap’ and ‘loser’ segments of both Value and Momentum universes, such as airlines and cyclical industrials. A similar dynamic also occurred in February 2021.
However, in March 2021, the Value rally was subtly different. It was very broad-based rather than concentrated in the extreme ‘deep value’ quintile. Cheaper stocks did better than the more expensive ones while Momentum losses were driven by the recent winners. This change is illustrated in Figures 4 and 5, where we plot the relative return of stocks sorted by Value and Momentum, compared with the average ‘neutral’ stock.
Figures 4 and 5: Momentum and Value Performance by Quintile, Expressed as Return Versus Average of Q3: February vs March 2021
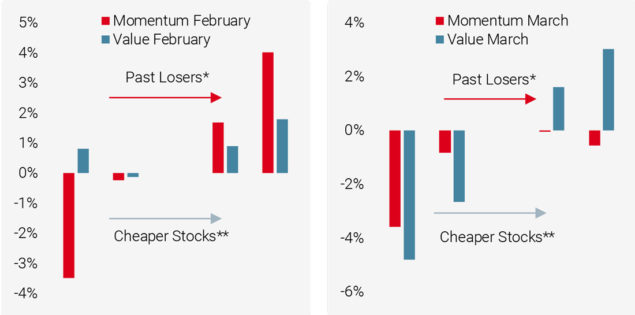
Source: Unigestion, Bloomberg.
*Horizontal axis (red bars): from quintile of highest Momentum (past winners) to quintile of lowest Momentum (past losers)
**Horizontal axis (blue bars): from quintile of most expensive stocks to quintile of cheapest stocks
Our risk-managed portfolios have been positively exposed to Value, but we have been absent from exposure to speculative, deep value stocks, favouring lower risk ‘quality at the right price’ type of companies. While this positioning was not profitable in November and February when performance was concentrated in deep value, our ‘reasonable value’ exposure benefitted from the broadening of performance in March.
While the Value rallies in November and February were a product of Momentum weakness, the one in March was indicative of a more established rotation towards Value.
This change in relationship suggests to us that, while the early Value rally in November and February was a product of Momentum weakness, the latter was much more broadly felt and indicative of a more established rotation towards Value. The key to understanding and responding to this change in relationship could lie in the shifting macroeconomic environment.
Interest Rates as Potential Catalysts for the Recent Factor Rotation
Last decade’s underperformance in Value corresponds to a period of low rates and low inflation while inflationary periods have historically been supportive for the Value factor. On the other hand, periods of higher inflation and rising interest rates tend to be unfavourable to Growth stocks, impacting the quality of earnings forecasts. This is because the valuations of these companies are more reliant on future earnings expectations, with the compounding effect that comes from the projection of their revenues well into the future. The Value companies preferred by our process have more stable and mature revenue streams, and are therefore less impacted.
To use fixed income terminology, Value stocks have lower duration than Growth stocks, and are therefore less affected by rising interest rates and inflation. This relationship can be illustrated by the long-term performance of the basic ‘High minus low’ value factor in periods with different levels of inflation, as shown in the Figure 6.
Figure 6: Annualised Inflation Rate (x) vs Annualised Value Factor (HmL,y) 1927 – 2018
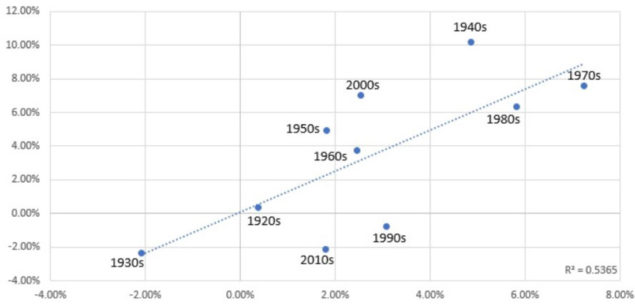
Source: Fama-French; inflationdata.com; L.Hamtil’s calculations
https://fortunefinancialadvisors.com/blog/how-inflation-makes-the-value-factor-a-sector-bet
Looking forward, we forecast a scenario of rising rates and a moderately inflationary environment, which would provide a supportive macroeconomic backdrop for the Value factor.
Managing Factor Rotation and Adapting to Inflation in Our Investment Process
Within our process we seek to ensure that we do not have a systematic negative bias to factors shown to provide long-term return – including both Momentum and Value. During periods of intense factor rotation, we ensure our portfolios are dynamically rebalanced – while managing turnover – to remain well positioned with regard to significant factor rotations. Simply using a slower, scheduled rebalancing approach would leave the portfolio exposed to a performance drag from style rotation.
However, this is not the end of the story, as we observe an important relationship between equity factors and macroeconomic regimes. In periods of rising inflationary pressures, we see meaningful divergences in factor performance as show in Figure 7. According to this analysis, Quality, Value and Size have a structural advantage in periods of persistent inflation, while Momentum can struggle.
Figure 7: Historical Sharpe Ratio During Inflation Surprise Regimes, by Equity Factor (1974 – 2020)
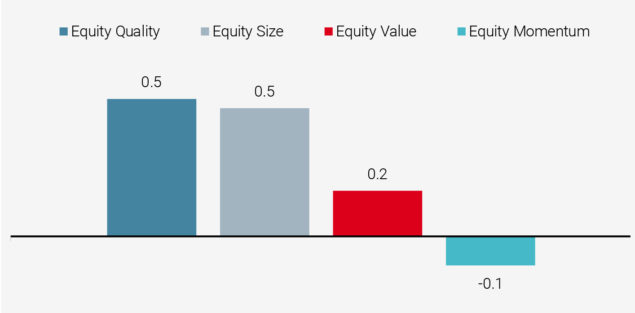
Source: Unigestion, Bloomberg.
According to our analysis, Quality, Value and Size have a structural advantage in periods of persistent inflation, while Momentum can struggle.
We therefore control our overall style factor exposure to match expected factor riskadjusted performance in different macroeconomic regimes. More specifically, as part of our Dynamic Risk Framework, we use proprietary Nowcaster indicators to determine where we currently stand in the macroeconomic cycle, with particular reference to inflation, growth and asset valuations. We then tilt our factor positioning (Quality, Value, and Momentum) in a way that is most suited to the current macro picture.
We control our overall style factor exposure to match expected factor riskadjusted performance in different macroeconomic regimes.
In addition to our control of the overall style factor exposure, during inflationary periods we also want to control for the interest rate risk in our portfolio construction process. Low volatility stocks are often called ‘bond proxies’ because of their stable cash flows and high dividend yields. They therefore tend to be disadvantaged by rising interest rates. While we remain true to our low volatility style, we want to control the sensitivity of our portfolio to rising rates.
We do so by introducing an extra constraint in our portfolio construction. We build interest rate sensitivity indicators for every low volatility stock, and filter or constrain the ones bearing too much risk in the current and future inflationary periods. Below is a representative example of these duration indicators applied to sectors.
Figure 8: Highest and Lowest Sensitivities To Interest Rates by Sector, European Investment Universe
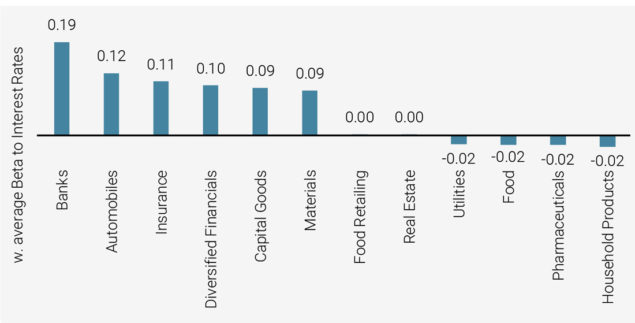
Source: Unigestion, Bloomberg. As at 31.03.21
We control the sensitivity of our risk-managed portfolios to rising rates by filtering or constraining the stocks that bear too much risk.
As a consequence of this analysis, during 2021 our European portfolios have increased their exposure to Materials, Capital Goods and Insurance. Our exposure to Household Products, Utilities and Food decreased.
In addition to these portfolio changes, we are also continuously monitoring the impact of other macro-related risks to our style allocation and will be consequently adjusting it in order to aim for both protective characteristics and favourable future performance.
Conclusion
We have experienced a dramatic rotation between Momentum and Value over the past quarter. We see compelling reasons to believe that the revival of Value was not simply driven by anti-Momentum, but has become a broad-based, sustainable Value rally supported by the macroeconomic environment. Our investment approach avoids directional exposure to mean-reverting Momentum, and controls for valuation risks to the extent justified by the macroeconomic environment.
Dynamically managing macroeconomic risks is crucial to capturing future risk-adjusted performance.
Assessing the catalysts of equity style reversals enables us to react to hidden macroeconomic sensitivities embedded in our risk-managed equity portfolios. As a result, we integrate these risks as features in our portfolio construction process. With increasing volatility in key macroeconomic variables – including interest rates and inflation – we believe dynamically managing these risks is crucial to capturing future risk-adjusted performance. This, in our view, should positively contribute to our future risk-adjusted performance.
Important Information
Past performance is no guide to the future, the value of investments, and the income from them change frequently, may fall as well as rise, there is no guarantee that your initial investment will be returned. This document has been prepared for your information only and must not be distributed, published, reproduced or disclosed by recipients to any other person. It is neither directed to, nor intended for distribution or use by, any person or entity who is a citizen or resident of, or domiciled or located in, any locality, state, country or jurisdiction where such distribution, publication, availability or use would be contrary to law or regulation.
This is a promotional statement of our investment philosophy and services only in relation to the subject matter of this presentation. It constitutes neither investment advice nor recommendation. This document represents no offer, solicitation or suggestion of suitability to subscribe in the investment vehicles to which it refers. Any such offer to sell or solicitation of an offer to purchase shall be made only by formal offering documents, which include, among others, a confidential offering memorandum, limited partnership agreement (if applicable), investment management agreement (if applicable), operating agreement (if applicable), and related subscription documents (if applicable). Please contact your professional adviser/consultant before making an investment decision.
Where possible we aim to disclose the material risks pertinent to this document, and as such these should be noted on the individual document pages. The views expressed in this document do not purport to be a complete description of the securities, markets and developments referred to in it. Reference to specific securities should not be considered a recommendation to buy or sell. Unigestion maintains the right to delete or modify information without prior notice. Unigestion has the ability in its sole discretion to change the strategies described herein.
Investors shall conduct their own analysis of the risks (including any legal, regulatory, tax or other consequences) associated with an investment and should seek independent professional advice. Some of the investment strategies described or alluded to herein may be construed as high risk and not readily realisable investments, which may experience substantial and sudden losses including total loss of investment. These are not suitable for all types of investors.
To the extent that this report contains statements about the future, such statements are forward-looking and subject to a number of risks and uncertainties, including, but not limited to, the impact of competitive products, market acceptance risks and other risks. Actual results could differ materially from those in the forward-looking statements. As such, forward looking statements should not be relied upon for future returns. Targeted returns reflect subjective determinations by Unigestion based on a variety of factors, including, among others, internal modeling, investment strategy, prior performance of similar products (if any), volatility measures, risk tolerance and market conditions. Targeted returns are not intended to be actual performance and should not be relied upon as an indication of actual or future performance.
No separate verification has been made as to the accuracy or completeness of the information herein. Data and graphical information herein are for information only and may have been derived from third party sources. Unigestion takes reasonable steps to verify, but does not guarantee, the accuracy and completeness of information from third party sources. As a result, no representation or warranty, expressed or implied, is or will be made by Unigestion in this respect and no responsibility or liability is or will be accepted. All information provided here is subject to change without notice. It should only be considered current as of the date of publication without regard to the date on which you may access the information. Rates of exchange may cause the value of investments to go up or down. An investment with Unigestion, like all investments, contains risks, including total loss for the investor.
Legal Entities Disseminating This Document
UNITED KINGDOM
This material is disseminated in the United Kingdom by Unigestion (UK) Ltd., which is authorized and regulated by the Financial Conduct Authority („FCA“). This information is intended only for professional clients and eligible counterparties, as defined in MiFID directive and has therefore not been adapted to retail clients.
UNITED STATES
This material is disseminated in the U.S. by Unigestion (UK) Ltd., which is registered as an investment adviser with the U.S. Securities and Exchange Commission (“SEC”). This information is intended only for institutional clients and qualified purchasers as defined by the SEC and has therefore not been adapted to retail clients.
EUROPEAN UNION
This material is disseminated in the European Union by Unigestion Asset Management (France) SA which is authorized and regulated by the French “Autorité des Marchés Financiers” („AMF“).
This information is intended only for professional clients and eligible counterparties, as defined in the MiFID directive and has therefore not been adapted to retail clients.
CANADA
This material is disseminated in Canada by Unigestion Asset Management (Canada) Inc. which is registered as a portfolio manager and/or exempt market dealer in nine provinces across Canada and also as an investment fund manager in Ontario, Quebec and Newfoundland & Labrador. Its principal regulator is the Ontario Securities Commission („OSC“). This material may also be distributed by Unigestion SA which has an international advisor exemption in Quebec, Saskatchewan and Ontario. Unigestion SA’s assets are situated outside of Canada and, as such, there may be difficulty enforcing legal rights against it.
SWITZERLAND
This material is disseminated in Switzerland by Unigestion SA which is authorized and regulated by the Swiss Financial Market Supervisory Authority („FINMA“).
Document issued May 2021.