In the research note that we published in Q4 20201 we showed how machine learning-based stock selection models can successfully enhance the performance of risk-managed portfolios. We found that machine learning (ML) algorithms, when properly controlled for over-fitting, can show substantial improvement over traditional linear methods. Since the first generation of our ML-based stock selection model was introduced in 2019, we have been constantly seeking improvements in the model’s performance and have been exploring different ways of integrating it into the portfolio construction process.
In this paper, we discuss the specifications that we considered, describing in detail the ones that allowed us to improve the model.
Enhancing Specifications
Forecast Horizon
The forecast horizon of stock selection models is one of the most important aspects when aligning a model’s design with portfolio construction. Models that aim to forecast shorter horizons typically have faster decay and higher turnover. Therefore, one has to find a balance between the horizon and the stability of the model, whilst avoiding excessive turnover. We primarily rebalance at monthly frequency and have been exploring models with 12 month, 6 month, 3 month and 1 month forecasting horizons. Models with a 3 month forecast horizon showed the highest information coefficient across all horizons and in all regions.
Feature Set
Our proprietary factor library consists of around 150 features that contain relevant information for stock returns, as confirmed by academics and practitioners. The feature set contains fundamental, price-related and sentiment data and can be separated into the following groups: Momentum, Quality (accounting quality, efficiency, growth, investment, profitability, solvency), Value, Risk, Size, Technical, Liquidity and Sentiment. We constantly explore uncorrelated sources of alpha and test their added value for stock selection. The relevance of features depends on the forecast horizon and the training sample. Whilst fundamental features are typically more important for long-term views, momentum and sentiment indicators appear more relevant for shorter horizons. We found an improvement in the forecasting power of shorter horizon models when expanding our feature set with additional price-related and sentiment indicators.
Training Window
Successful ML algorithms are typically ensemble models that combine several learners together. Training algorithms on different data samples helps identify alternative relationships between features and returns and allows to reduce the variance of the forecast. For our longer-term forecasting models, we performed training separately using 10-year rolling and expanding windows and we then produced an ensemble of the two forecasts. While an algorithm based on a shorter window looks for factor combinations that have worked well in a more recent period, longer windows account for different macroeconomic cycles. For shorter horizon models we adjusted the lookback period to a combination of 5-year rolling and 10-year rolling.
ML Algorithms
We explored alternative ML algorithms and their application for stock selection. We compared regularized linear algorithms (Lasso, Ridge, Elastic Net), tree-based ensemble models (Random Forest (RF), AdaBoost, XgBoost), feed-forward neural networks (FFNs) and long short-term memory (LSTM) recurrent networks. . Our stock selection models are based on the RF algorithm which proved to produce stable robust forecasts and dealt well with over-fitting to their training set. We have recently re-tested the XGBoost algorithm and compared it to the performance of RF across different regions and found no significant improvement in the forecasting power.
Interpretability
There are several alternative methods to identify the performance drivers of ML algorithms. While some methods only account for the degree of the importance, others allow to look at the sign. We aim to have as much transparency in our models as possible and we show that ML is not a ‘Black Box’. Since our first generation ML model was implemented, we have expanded the set of ways to look at the importance of the features. We believe that it is important to look at several measures simultaneously, accounting for both the rank and the sign.
Forecast Category
Instead of predicting stock returns on an absolute basis, we forecast stock returns relative to the investment universe. Features are also transformed on the cross-sectional basis. Alternative ways include forecasting returns relative to industry groups, which allows to smooth the representation of industry groups within the quintiles of model forecasts. We tested this approach but did not find significant improvements in the overall performance of the model.
Next Generation of ML-based Stock Selection Models
Having explored several avenues of research to see how the stock selection model could be improved, we have incorporated a number of promising changes to our algorithms that will further boost their accuracy and interpretability. The changes made relative to the first generation model are summarised in Table 1. Major changes relate to the shorter-term forecast horizon, shorter lookback period, expanded features set and alternative portfolio construction methods. In this paper, we present the comparison between the two versions for our European strategy. We have also checked the robustness of results across all regions, including the US, Emerging Markets, Japan, and Global and have confirmed our findings.
Table 1: Summary of the Changes to the First Generation Stock Selection Model
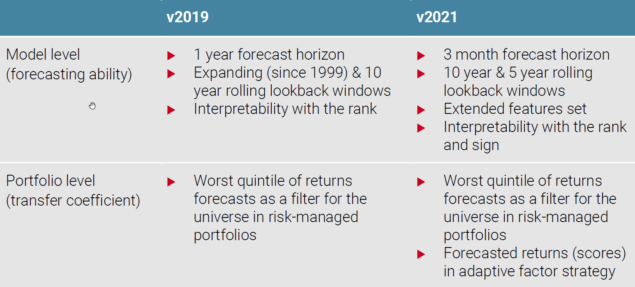
Source: Unigestion. As at 31 October 2021.
We train our model each month for the period from November 2009 to October 2021 using the RF algorithm. In order to estimate the parameters of ML algorithms and evaluate their performance, every month we split the data into the training, cross-validation and test sets. We apply walk-forward purged cross-validation suitable for the time-series setting. Standard k-fold cross-validation fails in finance because we cannot assume that observations are drawn from an iid process. In addition, we have to make sure no leakage of information occurs between each of these sets. We avoid leakage by purging from the training (cross-validation) set all observations whose labels overlap in time with labels included in the cross-validation (test) set.
We evaluate the performance of the model via the out-of-sample information coefficient which captures the cross-sectional correlation between the forecasted rank of a stock and its actual realised performance at a particular horizon. Figure 1 shows the comparison between information coefficients of two models across 12 month, 6 month and 3 month horizons. Average information coefficients are economically and statistically significant at 1% significance level. We observe an improvement in the information coefficient for the ML v2021 model across all horizons. To check the robustness of our conclusions, we plot the evolution of out-of-sample information coefficients over time in the right panel of Figure 1. As illustrated in the chart, the information coefficient of the new model is superior most of the time with only a few exceptions.
Figure 1: Out-of-Sample Information Coefficient
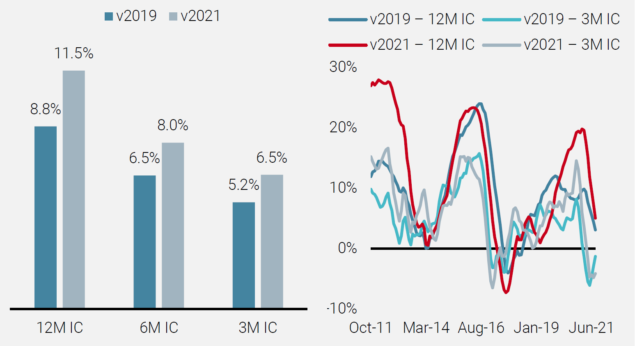
Source: S&P Global, Unigestion. Data as at 31 October 2021.
We further study the difference in the economic value of two stock selection models. Long-only portfolios are formed on a monthly basis by investing in stocks from a particular quintile of the forecasted returns. In addition, spread portfolios are constructed by going long the stocks from the top quintile and short the stocks from the bottom quintile. Figure 2 compares the resulting gross returns, volatilities and Sharpe ratios between the two models. The Sharpe ratio for the spread portfolio of the ML v2021 model is improved relative to the ML v2019 model. To account for transaction costs, one has to balance between the performance of the signal and its stability. To get a sense of the turnover, we estimate the average lag-1 autocorrelation coefficient of the forecast for both models. We find that forecasts of ML v2021 model remain stable with the average lag-1 autocorrelation of 87% vs. 91% for the ML v2019 model.
Figure 2: Average Annualised Performance of Long-Only Quintiles and Long-Short Quintile Spread
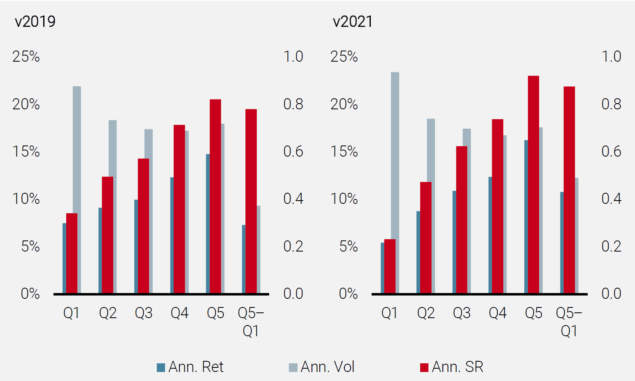
Source: S&P Global, Unigestion. Data as at 31 October 2021.
Average annualised performance based on the period from Nov 2009 to Aug 2021.
The next step is to figure out how the performance drivers change between two models. Figure 3 shows the 20 most important stock characteristics, ranked from the most important to the least important based on the “gain” importance measure. The values for the ML v2021 model also show the direction of the feature (positive or negative) via the correlation between the forecasted returns and the values of the feature. We observe that Value, Quality and Size characteristics remain important for both models. However, Momentum and Sentiment characteristics become more important in the ML v2021 model for shorter-term return prediction.
Figure 3: Variable Importance
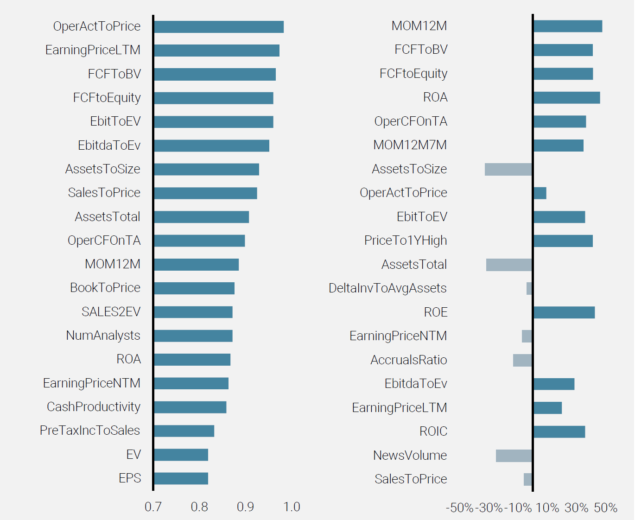
Source: S&P Global, Unigestion. Data as at 31 October 2021
Based on the period from November 2009 to August 2021. This chart shows the variable importance. The importance of RF is computed using the gain method which equals to the decrease in loss function accounting for all splits produced by a feature.
In this section, we presented the next generation of ML-based stock selection models with an improved forecasting power and, hence, stock selection ability. In the next section, we will show how to integrate the results of the model into the portfolio construction process with realistic constraints and transaction costs.
Adaptive Multi-Factor Equities Strategy
We implement ML-based forecasts in our active factor investing strategy to take into account the dynamic nature of the ML methodology. Strategic investment in traditional equity risk premia is well-complemented by the dynamic feature selection from our ML approach (Figure 4).
Figure 4: Adaptive Multi-Factor Strategy
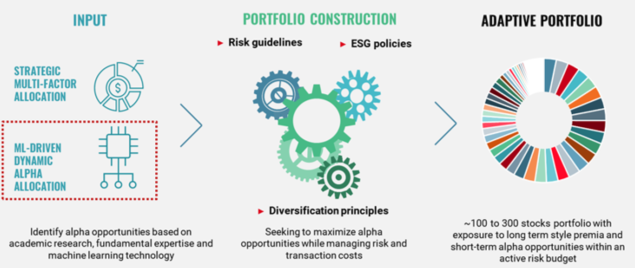
Source: Unigestion. As at 31 October 2021.
We construct a dynamic target portfolio by adding a scaled ML score to a benchmark weight2. The scale is selected to have a 4% ex-ante tracking error to the benchmark. The investable dynamic portfolio is a long-only implementation that minimizes the tracking error to the target. We control for transaction costs, risk, liquidity, ESG and ensure diversification via sector constraints.
Table 2 illustrates the performance of the benchmark index, the Strategic Multi-Factor Portfolio and the Dynamic Machine Learning Portfolio during the period December 2009 to October 2021. A year-by-year breakdown of excess returns is provided in Figure 5 and shows how the Dynamic Machine Learning Portfolio helps the adaptive strategy, especially in more recent years when traditional risk premia performance has proven more challenging.
Table 2: Annualised Performance
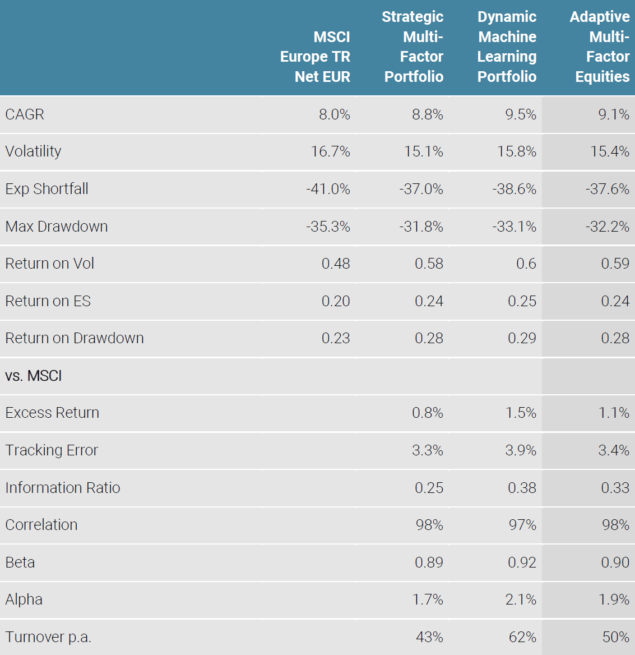
Source: Bloomberg, S&P Capital IQ, Unigestion. As at 31 October 2021.
Figure 5: Contribution to Excess Return by Calendar Year
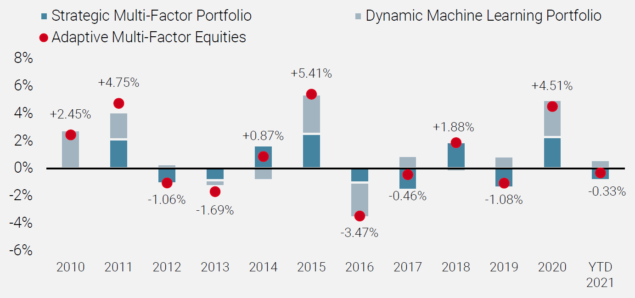
Source: Bloomberg, S&P Capital IQ, Unigestion. As at 31 October 2021.
For illustrative purposes only. This table contains hypothetical performance, please refer to the Important Information at the end of the document. Hypothetical performance is no guide to the future, the value of investments can fall as well as rise, there is no guarantee that your initial investment will be returned. Hypothetical performance is shown net of estimation transaction costs but gross of fees in EUR from 31.12.2009 to 31.10.2021, thereby the inclusion of fees, costs and charges will reduce the overall value of performance. Results may increase or decrease due to currency fluctuations. Allocations may be subject to change.
Conclusion
Additional features and a shorter forecast horizon provide for significant enhancements to our ML stock selection methodology. A Dynamic Machine Learning Portfolio based on the enhanced model complements well a Strategic Equity Multi-Factor portfolio and allows for enhanced Adaptive Multi-Factor investments.
1Shishkina A., Dubikovskyy V, Kosowski R. and R. Ramakrishnan, 2020, “Machine Learning and Risk-Managed Investing”.
2Brandt M. W., Santa-Clara P. and R. Valkanov. Parametric Portfolio Policies: Exploiting Characteristics in the Cross-Section of Equity Returns. The Review of Financial Studies/v 22 n 9 2009
Important information
Past performance is no guide to the future, the value of investments, and the income from them change frequently, may fall as well as rise, there is no guarantee that your initial investment will be returned. This document has been prepared for your information only and must not be distributed, published, reproduced or disclosed by recipients to any other person. It is neither directed to, nor intended for distribution or use by, any person or entity who is a citizen or resident of, or domiciled or located in, any locality, state, country or jurisdiction where such distribution, publication, availability or use would be contrary to law or regulation.
This is a promotional statement of our investment philosophy and services only in relation to the subject matter of this presentation. It constitutes neither investment advice nor recommendation. This document represents no offer, solicitation or suggestion of suitability to subscribe in the investment vehicles to which it refers. Any such offer to sell or solicitation of an offer to purchase shall be made only by formal offering documents, which include, among others, a confidential offering memorandum, limited partnership agreement (if applicable), investment management agreement (if applicable), operating agreement (if applicable), and related subscription documents (if applicable). Please contact your professional adviser/consultant before making an investment decision.
Where possible we aim to disclose the material risks pertinent to this document, and as such these should be noted on the individual document pages. The views expressed in this document do not purport to be a complete description of the securities, markets and developments referred to in it. Reference to specific securities should not be considered a recommendation to buy or sell. Unigestion maintains the right to delete or modify information without prior notice. Unigestion has the ability in its sole discretion to change the strategies described herein.
Investors shall conduct their own analysis of the risks (including any legal, regulatory, tax or other consequences) associated with an investment and should seek independent professional advice. Some of the investment strategies described or alluded to herein may be construed as high risk and not readily realisable investments, which may experience substantial and sudden losses including total loss of investment. These are not suitable for all types of investors.
To the extent that this report contains statements about the future, such statements are forward-looking and subject to a number of risks and uncertainties, including, but not limited to, the impact of competitive products, market acceptance risks and other risks. Actual results could differ materially from those in the forward-looking statements. As such, forward looking statements should not be relied upon for future returns. Targeted returns reflect subjective determinations by Unigestion based on a variety of factors, including, among others, internal modeling, investment strategy, prior performance of similar products (if any), volatility measures, risk tolerance and market conditions. Targeted returns are not intended to be actual performance and should not be relied upon as an indication of actual or future performance.
No separate verification has been made as to the accuracy or completeness of the information herein. Data and graphical information herein are for information only and may have been derived from third party sources. Unigestion takes reasonable steps to verify, but does not guarantee, the accuracy and completeness of information from third party sources. As a result, no representation or warranty, expressed or implied, is or will be made by Unigestion in this respect and no responsibility or liability is or will be accepted. All information provided here is subject to change without notice. It should only be considered current as of the date of publication without regard to the date on which you may access the information. Rates of exchange may cause the value of investments to go up or down. An investment with Unigestion, like all investments, contains risks, including total loss for the investor.
Legal Entities Disseminating This Document
UNITED KINGDOM
This material is disseminated in the United Kingdom by Unigestion (UK) Ltd., which is authorized and regulated by the Financial Conduct Authority („FCA“). This information is intended only for professional clients and eligible counterparties, as defined in MiFID directive and has therefore not been adapted to retail clients.
UNITED STATES
This material is disseminated in the U.S. by Unigestion (UK) Ltd., which is registered as an investment adviser with the U.S. Securities and Exchange Commission (“SEC”). This information is intended only for institutional clients and qualified purchasers as defined by the SEC and has therefore not been adapted to retail clients.
EUROPEAN UNION
This material is disseminated in the European Union by Unigestion Asset Management (France) SA which is authorized and regulated by the French “Autorité des Marchés Financiers” („AMF“).
This information is intended only for professional clients and eligible counterparties, as defined in the MiFID directive and has therefore not been adapted to retail clients.
CANADA
This material is disseminated in Canada by Unigestion Asset Management (Canada) Inc. which is registered as a portfolio manager and/or exempt market dealer in nine provinces across Canada and also as an investment fund manager in Ontario, Quebec and Newfoundland & Labrador. Its principal regulator is the Ontario Securities Commission („OSC“). This material may also be distributed by Unigestion SA which has an international advisor exemption in Quebec, Saskatchewan and Ontario. Unigestion SA’s assets are situated outside of Canada and, as such, there may be difficulty enforcing legal rights against it.
SWITZERLAND
This material is disseminated in Switzerland by Unigestion SA which is authorized and regulated by the Swiss Financial Market Supervisory Authority („FINMA“).
Document issued December 2021.