SHOULD WE WORRY ABOUT BONDS CARRY WHEN THE FED CUTS RATES?
- Bonds carry has been one of the best-performing alternative risk premia strategies in recent years.
- While the strategy has historically performed well when the Fed has cut rates, the current situation is unusual as bonds carry in the US is much lower than in other G8 countries.
- Nonetheless, the strategy’s allocation, by design, will continue to adapt to changes in implied carry and we expect further robust returns in the future.
Overview
In light of rising trade war risks and a marked slowdown in the global economy that has pushed inflation risks lower, major central banks have shifted recently from “normalisation mode” to “easing financial conditions” in order to avoid recession. As a result, global bond yields have declined significantly. In this new market environment, what can we expect from a bonds carry strategy, which aims to deliver positive returns in various economic regimes by being long sovereign bonds that offer high carry and short those offering low carry?
Bonds Carry: One of the Best-Performing ARP in the Recent Past
Alternative risk premia (ARP) solutions aim to deliver high risk-adjusted returns with a low correlation to traditional assets such as equities, sovereign bonds and commodities. To achieve that objective, we have identified a spectrum of individual ARP which make economic sense for why they should reward the investor, have been historically proven to produce positive long-term returns, and are liquid and easy to implement. In that framework, our investment universe consists of three types of ARP: Equity Factors, Macro Directional strategies, and Alternative Income/Carry strategies.
The bonds carry strategy we illustrate in this paper takes long positions in bonds with above-median carry and short ones in those with below-median carry in a duration-neutral manner. It aims to capture the carry premium within the G8 universe (excluding Japan and Italy). While the strategy is constructed to be duration neutral, it can still be exposed to shifting
and/or diverging expectations on central bank monetary policies.
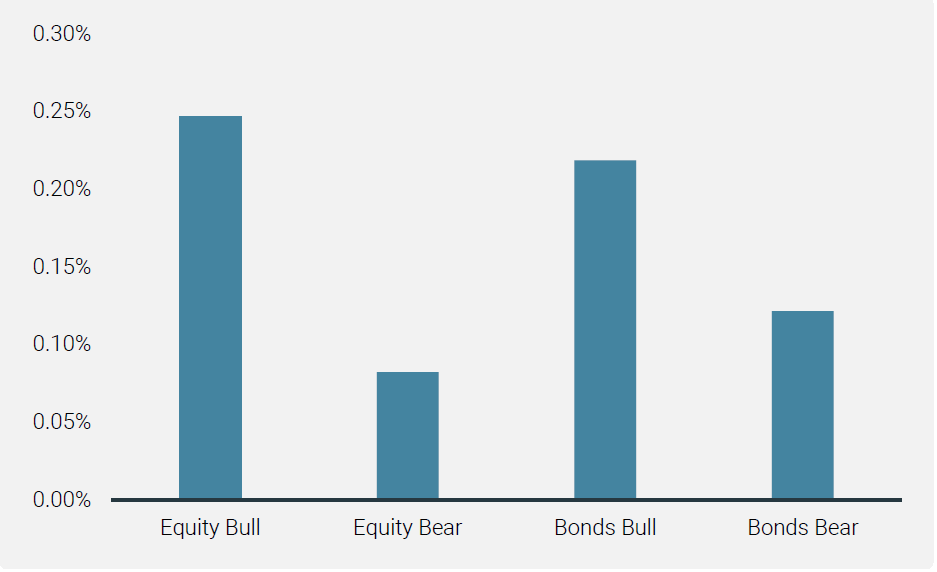
Since the launch of our ARP strategies, first within our flagship multi asset fund, then as a standalone fund, bonds carry has delivered impressive absolute returns across all market environments – equity bull, equity bear, bonds bull and bonds bear markets (Chart 1).
Chart 1: Bonds Carry in Different Market Conditions (Average Weekly Bonds Carry Performance)
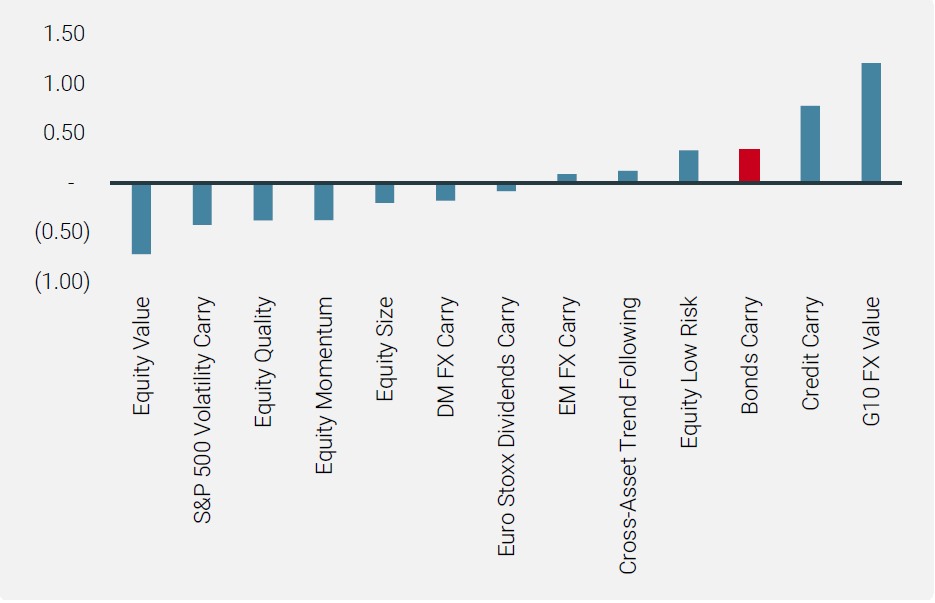
Bonds carry has also been one of the best performers across individual ARP on a risk-adjusted basis (Chart 2).

Bonds carry has been one of the best performers across individual ARPs on a risk-adjusted basis.

Chart 2: Risk-Adjusted Returns of Individual ARP Since Strategy Launch

Bonds Carry: The Slope Matters, Not Just the Bond Yield
Carry, the return earned should prices not change, is defined following Koijen et al (2016). For bonds, carry consists of two effects: (i) the bond’s yield spread relative to the risk-free rate plus (ii) the “roll-down”, which captures price changes as the bond rolls down the yield curve. It is important to note that the carry of a bond is not simply determined by the level of its yield, but also by its “roll-down”.
To illustrate the effect of a “roll-down”, consider a normal upward-sloping yield curve. As a five-year bond becomes a four-year bond after one year, the decrease in yield will naturally lead to a gain in the bond’s price, assuming that the level and shape of the yield curve remains unchanged. For a normal upward-sloping yield curve, the steeper the yield curve, the higher the “roll-down”.
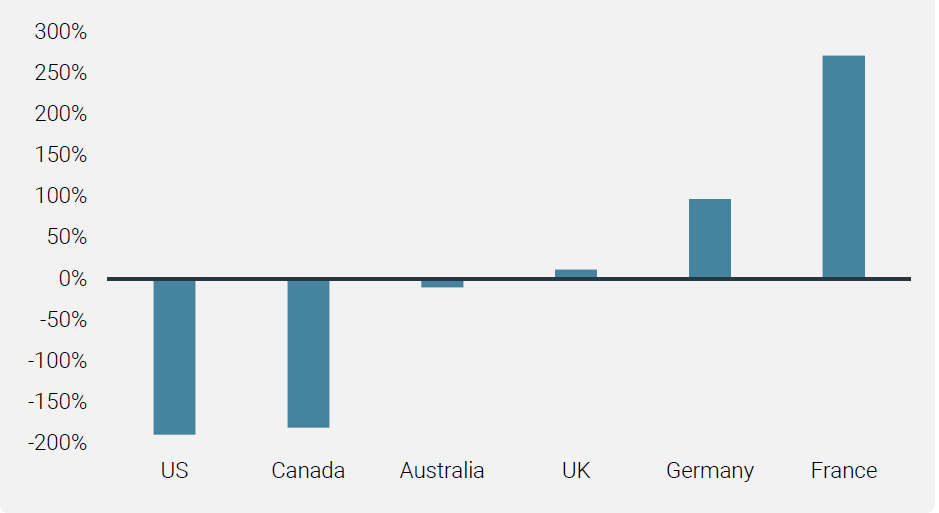
Historically, from 1990, this strategy was long US bonds due to a steeper US curve on average (Chart 3). However, as the US curve has flattened due to the Fed’s normalisation since 2015, despite European bonds offering negative or very low yields, the strategy has been long European bonds and short North American bonds since 2017. Currently, given the flat curves in the US, Canada and Australia, the positioning continues to be long European bonds and short North American and Australian bonds (Chart 4).
The carry of a bond is not simply determined by the level of its yield, but also by its “roll-down”
Chart 3: Historical Bonds Carry Strategy Capital Allocation
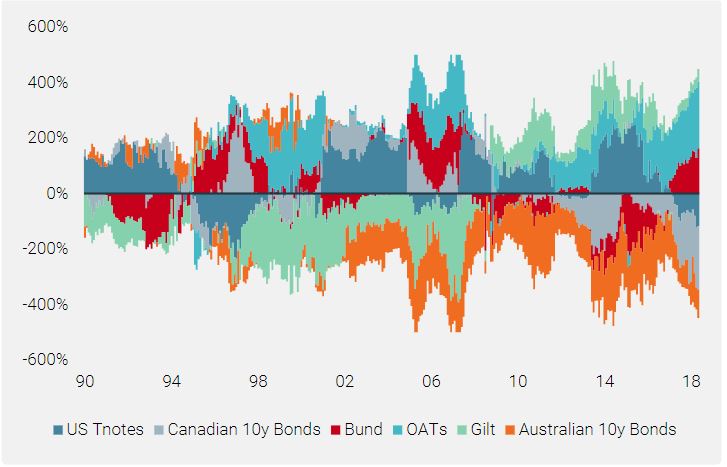
Chart 4: Bonds Carry Strategy Capital Allocation as at 25.06.2019 (for a Strategy with a 10% Volatility Target)
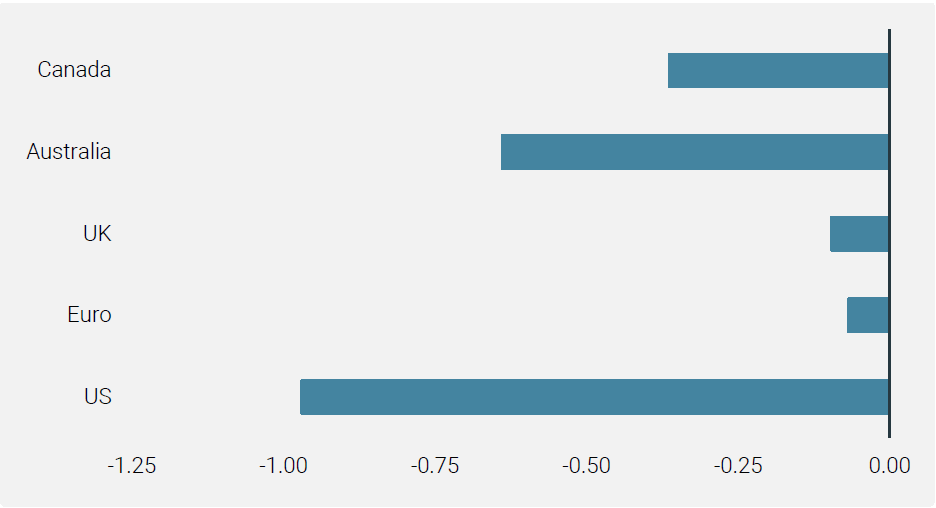
As markets expect monetary easing across most main developed markets in the coming years, and more so in the US than anywhere else (Chart 5), is this positioning at risk?
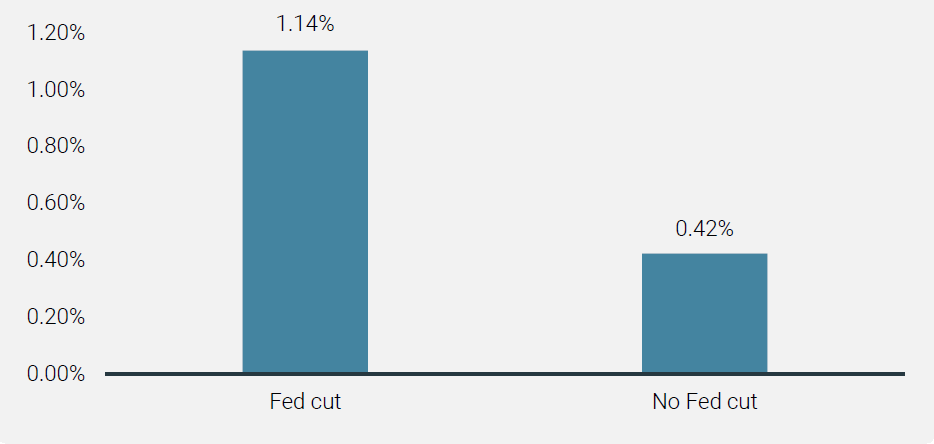
During the months where the Fed cut rates, bonds carry delivered positive and higher returns on average than periods without rate cuts.
Chart 5: Monetary Policy Market Expectations (12-month Expected Changes in Central Bank Rates, in Basis Points)
Historically, Fed Cuts Have Been Favorable for Bonds Carry
Since 1990, there have been five Fed easing cycles (1990/1992, 1995/1996, 1998, 2001/2003 and 2007/2008). As shown in Chart 6, during the months where the Fed cut rates, bonds carry delivered positive and higher returns on average than periods without rate cuts, and the spread in absolute performance is large. Furthermore, the proportion of positive monthly returns during periods of rate cuts is also higher (71%) than that during periods with no cuts (61%).
Chart 6: Average Monthly Performance of Bonds Carry Since 1990 by Fed Monetary Action
At first glance, based on its historical return behaviour, one may draw the conclusion that we need not be overly concerned about the future returns of the strategy.
Does It Work Even If Recession Is Not on the Horizon?
However, the current situation is unusual. The Fed has been more aggressive in its normalisation than other central banks. As a result, the yield curve in the US is flatter than in most other countries. This is illustrated in Chart 7, which compares the carry provided by the US versus the rest of G8 bonds (excluding Italy and Japan, as they are not in the strategy’s investment universe). Chart 7 shows that the current US bonds carry is much lower than the rest of the G8 countries, which is rare historically. In the past, there was only one occurrence similar to the current situation during periods of Fed cuts, particularly when recession risk is not high: 1995/1996. As a result, it was also the only historical Fed cut period where the strategy was also short US bonds (and short Canadian bonds for the first half of that period), as is the strategy’s position today (Chart 8).
The current US bonds carry is much lower than the rest of the G8 countries, which is rare historically
Chart 7: US Bonds Carry vs the Rest of G8 Bonds Carry
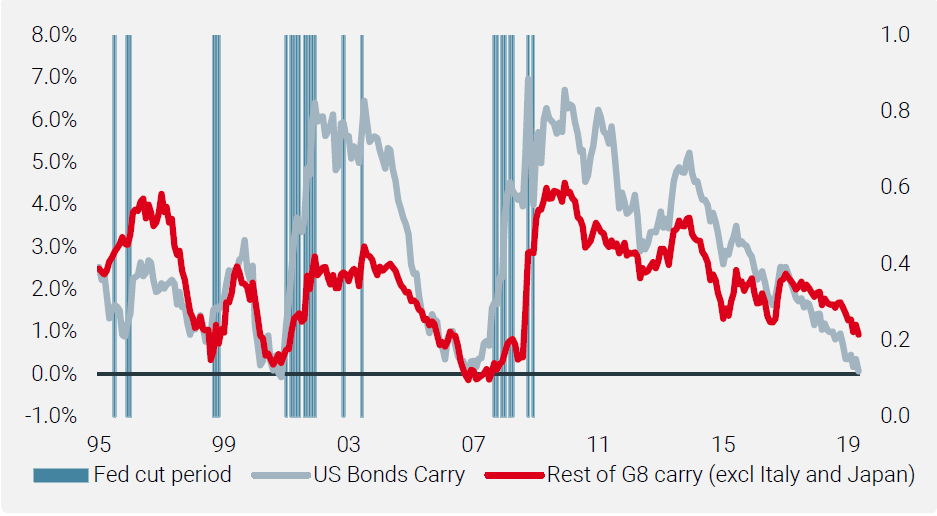
Chart 8: Average Historical Allocation of the Strategy During Periods where the Fed Cut Rates
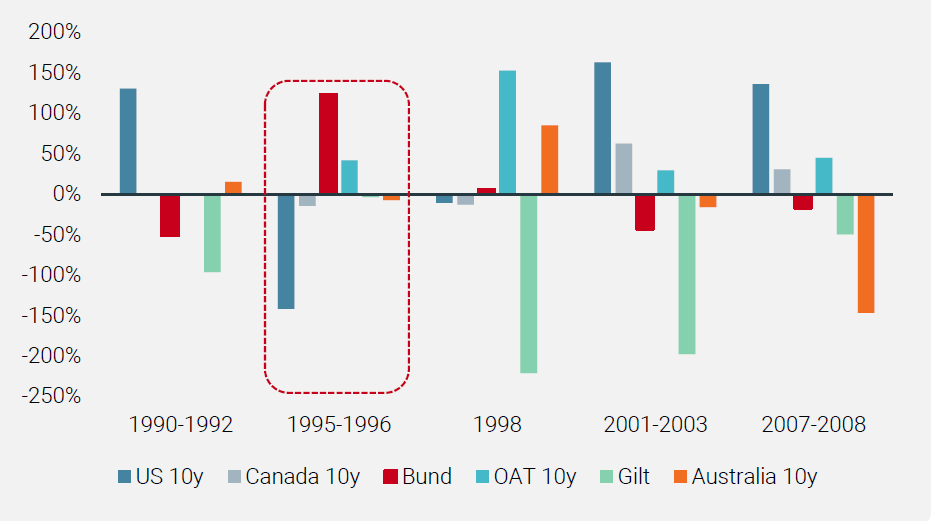
How did the strategy perform during this period, which was similar to today? During the first six months of 1995, ahead of Fed rate cuts, the strategy lost money (-8.5%), as it did in April and May of 2019. As shown in Chart 9, which presents performance contributions over the 1995/1996 period, the short position in US bonds was costly.
Chart 9: Performance Contributions During 1995/1996
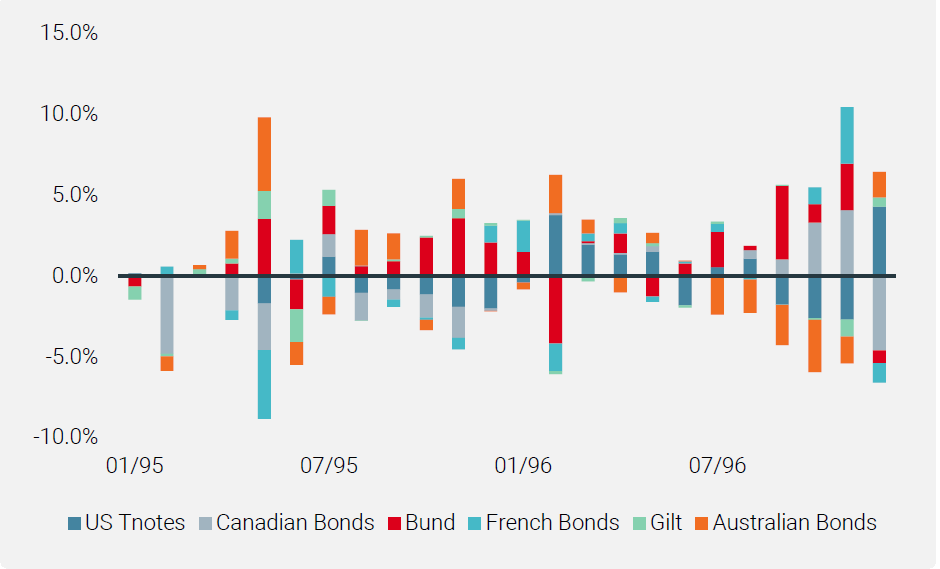
However, the bulk of the negative contribution came from the short exposure to Canadian bonds, as the Bank of Canada had been aggressively easing during this period. Nevertheless, thanks to global easing from most of the G8 central banks, most sovereign curves steepened in 1995 and 1996, pushing the carry of the bond strategy much higher. In addition to the positive impact of yield changes, this increase in implied carry helped the strategy to recover sharply in the second half of 1995 (+5.2%) and in 1996 (+14.6%). Where short positions hurt performance as their respective central banks undertook substantial rate cuts, this was mostly offset by long positions posting large positive contributions.
Finally, it is worth highlighting that the strategy’s allocations change with each sovereign bond’s carry, which in turn is determined by the slopes of their respective yield curves. As an illustration, following significant monetary easing in Canada, the Canadian curve had steepened, increasing Canadian bonds’ carry. As a result, the strategy shifted from a short to a long position in Canadian bonds, which contributed positively to the performance in 1996, as shown in Chart 9.
This Time It’s Different?
We believe that history could repeat itself, protecting the strategy against a deep and prolonged drawdown arising from its large short position in US bonds. However, there is one important difference to note. Contrary to the current situation, US rates were lower than most other G8 countries back in 1995. Before the June 1995 Fed cut, US Fed fund rates were at 6% vs 6.6% for the UK, 8% for Canada, and 7.5% for Australia. Only German rates were lower at 4.85%, and even then, this is still much more elevated than G8 rates today. This means that every G8 central bank had room to carry out monetary easing, which led the strategy to benefit from an increase in implied carry (through the steepening of the curve), while losses from rate cuts on the short positions were largely offset by gains on the long positions. Today, the situation is very different as most non-US short-term rates are still low, even negative in some cases. As a result, the potential cushion delivered by curve steepening through global monetary easing and the gains on the long positions through yield cuts could be more limited this time. However, by design, the strategy’s allocation will adapt to the changes in implied carry, as it has done in the past. We believe that this should lead the strategy to continue to provide the robust returns it has done over recent decades.
Important Information
This information is issued by Unigestion (UK) Ltd (“Unigestion”), which is authorised and regulated by the UK Financial Conduct Authority (“FCA”). Unigestion is also registered as an investment adviser with the U.S. Securities and Exchange Commission (“SEC”). This information is intended only for professional clients, institutional clients and eligible counterparties, as defined by the FCA, and qualified purchasers as defined by the SEC and has therefore not been adapted to retail clients.
It must not be published, reproduced, distributed or disclosed (in whole or in part) by recipients to any other person without the prior consent of Unigestion. The information provided should only be considered current as of the date of publication without regard to the date on which you may access the information. Unigestion maintains the right to delete or modify information without prior notice. This presentation is a promotional statement of our investment philosophy and services and does not constitute an offer or solicitation to acquire, sell or subscribe to any securities or financial instruments described or alluded to herein which may be construed as high risk and not readily realisable investments and may experience substantial and sudden loss including total loss of investment. The securities mentioned in this document may not be authorised for public distribution in certain jurisdictions and are not offered or distributed on a public basis in or from any country where such distribution would be prohibited by law. The investments described herein are not suitable for all types of investors. All investors must obtain additional information needed to evaluate a potential investment and provide important disclosures regarding risks, fees and expenses. Investors shall in particular conduct their own analysis of the risks (including any legal, regulatory, tax or other consequence) associated with an investment and should seek independent professional advice.
No separate verification has been made as to the accuracy or completeness of the data included in this presentation, which may have been derived from third party sources, such as fund managers, administrators, custodians and other third party sources. As a result, no representation or warranty, express or implied, is or will be made by Unigestion as regards the information contained herein and no responsibility or liability will be accepted. The performance figures are based on estimated fees and expenses as well as on the underlying strategy’s estimated performances given by fund managers, administrators, custodians and third party sources at a given date. Past performance is neither guaranteed nor a reliable indicator of future results. The value of investments may go down or up. Where performance is reflected gross of fees, potential investors should be aware that the inclusion of fees, costs and charges will reduce the overall value of performance. An investment with Unigestion, like all investments, contains risks, including the risk of total loss. Unless otherwise stated, the performance data source is Unigestion.
This information is provided to you solely to give you background information relating to Unigestion, certain strategies it implements and currently offers. Before making an investment decision with respect to the strategy discussed herein, potential investors are advised to consult with their tax, legal, ERISA and financial advisors. Note that not all strategies may be available or suitable for investment by U.S. investors.
This document does not purport to be complete and is qualified in its entirety by reference to the more detailed discussions relating to the strategies mentioned. Unigestion has the ability in its sole discretion to change the strategies described herein.
This document is being provided to you on a confidential basis solely to assist you in deciding whether or not to proceed with a further investigation of a strategy or Unigestion. Accordingly, this document may not be reproduced in whole or part, and may not be delivered to any person without the consent of Unigestion.
Nothing set forth herein shall constitute an offer to sell any securities or constitute a solicitation of an offer to purchase any securities. Any such offer to sell or solicitation of an offer to purchase shall be made only by formal offering documents, which include, among others, a confidential offering memorandum, limited partnership agreement (if applicable), investment management agreement (if applicable), operating agreement (if applicable), and related subscription documents (if applicable). Such formal offering documents contain additional information not set forth herein, which such additional information is material to any decision to invest in a strategy.
No information is warranted by Unigestion or its affiliates or subsidiaries as to completeness or accuracy, express or implied, and is subject to change without notice. This document contains forward-looking statements, including observations about markets and industry and regulatory trends as of the original date of this document. Forward-looking statements may be identified by, among other things, the use of words such as “expects,” “anticipates,” “believes,” or “estimates,” or the negatives of these terms, and similar expressions. Forward-looking statements reflect Unigestion’s views as of such date with respect to possible future events. Actual results could differ materially from those in the forward-looking statements as a result of factors beyond a strategy’s or Unigestion’s control. Readers are cautioned not to place undue reliance on such statements. No party has an obligation to update any of the forward-looking statements in this document.
These materials should only be considered current as of the date of publication without regard to the date on which you may receive or access the information. Unigestion maintains the right to delete or modify information without prior notice.
Charts, tables and graphs contained in this document are not intended to be used to assist the reader in determining which securities to buy or sell or when to buy or sell securities.
Return targets or objectives, if any, are used for measurement or comparison purposes and only as a guideline for prospective investors to evaluate a particular investment program’s investment strategies and accompanying information. Targeted returns reflect subjective determinations by Unigestion based on a variety of factors, including, among others, internal modeling, investment strategy, prior performance of similar products (if any), volatility measures, risk tolerance and market conditions. Performance may fluctuate, especially over short periods. Targeted returns should be evaluated over the time period indicated and not over shorter periods. Targeted returns are not intended to be actual performance and should not be relied upon as an indication of actual or future performance.
The past performance of Unigestion, its principals, shareholders, or employees is not indicative of future returns.
Except where otherwise specifically noted, the information contained herein, including performance data and assets under management, relates to the entire affiliated group of Unigestion entities over time including that of Unigestion UK. Such information is intended to provide the reader with background regarding the services, investment strategies and personnel of the Unigestion entities. No guarantee is made that all or any of the individuals involved in generating the performance on behalf the other Unigestion entities will be involved in managing any client account on behalf of Unigestion U.K. More specific information regarding Unigestion UK is set forth herein where indicated and is available on request.
There is no guarantee that Unigestion will be successful in achieving any investment objectives. An investment strategy contains risks, including the risk of complete loss.
The risk management practices and methods described herein are for illustrative purposes only and are subject to modification.
Data and graphical information herein are for information only and may have been derived from third party sources. Unigestion takes reasonable steps to verify, but does not guarantee, the accuracy and completeness of this information. As a result, no representation or warranty, expressed or implied, is or will be made by Unigestion in this respect and no responsibility or liability is or will be accepted. Unless otherwise stated, sources are Unigestion, Bloomberg and Compustat.
Backtested or simulated performance: Backtested or simulated performance is not an indicator of future actual results. The results reflect performance of a strategy not currently offered to any investor and do not represent returns that any investor actually attained. Backtested results are calculated by the retroactive application of a model constructed on the basis of historical data and based on assumptions integral to the model which may or may not be testable and are subject to losses.
Changes in these assumptions may have a material impact on the backtested returns presented. Certain assumptions have been made for modeling purposes and are unlikely to be realized. No representations and warranties are made as to the reasonableness of the assumptions. This information is provided for illustrative purposes only. Backtested performance is developed with the benefit of hindsight and has inherent limitations. Specifically, backtested results do not reflect actual trading or the effect of material economic and market factors on the decision-making process. Since trades have not actually been executed, results may have under-or over-compensated for the impact, if any, of certain market factors, such as lack of liquidity, and may not reflect the impact that certain economic or market factors may have had on the decision-making process. Further, backtesting allows the security selection methodology to be adjusted until past returns are maximized. Actual performance may differ significantly from backtested performance.
Unigestion (UK) Ltd. is authorised and regulated by the UK Financial Conduct Authority (FCA). It is also registered with the Securities and Exchange Commission (SEC). Unigestion SA is authorised and regulated by the Swiss Financial Market Supervisory Authority (FINMA). Unigestion Asset Management (France) S.A. is authorised and regulated by the French Autorité des Marchés Financiers (AMF). Unigestion Asset Management (Canada) Inc., with offices in Toronto and Montreal, is regulated in Canada by the securities regulatory authorities in Ontario, Quebec, Alberta, Manitoba, Saskatchewan, Nova Scotia, New Brunswick and British Columbia. Its principal regulator is the Ontario Securities Commission. Unigestion Asia Pte Limited is authorised and regulated by the Monetary Authority of Singapore.
Document issued July 2019.