For most investors, China remains the weakest link in the financial investment chain. With massive debt and an opaque economy, the recent ups-and-downs of the trade war discussions have not been helping. We still see China as a longer-term risk but we currently think that the lower rate environment targeted by most central banks should support the Chinese cycle that is currently going through a rough patch. Moreover, Chinese assets should benefit from the combination of the global stimulus that central banks are creating, the likely favourable change in sentiment and light market positioning. China is no longer an empire but it still needs to pull itself together for a long march. In this respect, we think investors should focus on the macro situation – but sentiment and valuation are equally important. The Chinese economy remains set on an uncertain path. Any economy holding a 150% non-financial corporate debt-to-GDP ratio would be seen as a risk. Only six countries have a higher ratio following the latest BIS non-financial debt report, most of them shelters to large corporates’ headquarters for fiscal reasons (with the notable and interesting exception of Hong Kong). From an aggregated debt perspective (corporate, households and government), China has accumulated in 10 years a total debt level that sits at 254% of its GDP. For the sake of comparison, Italy has a 252% total debt-to-GDP ratio and Japan is currently at around 375%. The difference for China is that this massive debt comes at a time when its economy is losing speed, moving from an investment-led to a consumption-led growth model: poor timing. This picture should, however, be contextualised by the recent positive changes in these metrics. Over the past year, the Chinese aggregated debt-to-GDP ratio barely rose (+0.5%), a major improvement in the light of two elements: first, this ratio has increased annually by an average of 5% since 2006. Secondly, this debt deceleration does not coincide with a period of stronger growth: Chinese GDP growth has been hovering around 6%, the weakest numbers since 2010. From this angle, zero debt growth is good news. This means that Chinese debt did not increase more than its GDP, unlike the past 10 years of data. There is a pilot on the ship and she is manoeuvring it well for now. The debt picture is therefore marginally improving but the rest of the macro data is also important. Our Chinese Growth Nowcaster, which tracks the evolution of the Chinese business cycle using a large spectrum of data, breached the symbolic threshold of -0.3 in April, which is usually a sign that things are heading south. More importantly, what explains this low level is almost all components of the Chinese economy: first, housing data and especially volume-related data has dropped significantly in April and has barely recovered since. External demand has also softened in line with the concerns of most developed countries’ central bank.„THE IMPERIAL MARCH“ – John Williams, 1980
What’s Next?
A Preoccupying Debt Situation
The Chinese Macro Cycle is Not Well But Help is at Hand
This phenomenon also intensified in April, and is now clearly visible in most world trade indices. Subsequently, production expectations have deteriorated, as in most countries. Overall, purchasing managers worldwide have become a lot more pessimistic over the period. Finally, domestic consumption in China has been taking a significant hit since the highs it reached in February last year, very similarly to most countries around the world. For anyone doubting Chinese data, the exports to China computed by most of its trade partners confirm that the Chinese consumer is in a far weaker position than last year.
So what are the positives? Only one domestic positive factor stands out: the Chinese government continues to actively counter these negative forces: social financing in June this year is about USD 400 billion higher than June last year. Can that alone sustain the Chinese cycle? Not fully. That said, the Chinese government is getting some external help, as most developed central banks have adopted a dovish stance. In 2015, the Fed made a similar turn, postponing hikes given the uncertainties China was creating and today is probably no different. The trade war situation just adds to this macro deceleration, but the overall extra liquidity at this point is welcome, buying some time to put the “long march together.

In spite of all the macro elements, Chinese equities delivered a very positive performance this year: the Shanghai Stock Exchange Composite index returned a volatile 17% year-to-date, although significantly less volatile than in 2015. In that year, the last growth deceleration in China, the index rose by 60% until June before losing 50% to December. Today, the valuations of Chinese equities are much lower, with a forward PE of around 11 versus 18 in June 2015. Market positioning in emerging equities also differs from 2015 when flows were very positive across most emerging countries. This year, they have been barely positive, leaving some room for improvement. Therefore, in light of supportive valuation and sentiment, a Fed rate cut next meeting could help Chinese stocks to reach higher levels. Having said that, for the moment we are cautious with our emerging investments overall, as we see the macro situation as a source of worry. Yet, compared to a month ago, we are less defensive, mainly because of the sentiment arguments described above. For the moment, we prefer exposure to the emerging world (and notably China) through select currencies and debt. We need the Fed to deliver its cut in July and hold its dovish stance to maintain a positive outlook for this “imperial march” that China has begun.A Game of Sentiment and Valuation

The Imperial March

Our medium-term views are positive and we are overweight growth assets. We are currently underweight bonds and are complementing this defensive positioning with options to protect the portfolio in the case of a correlation shock. For the month so far, the Multi Asset Risk Targeted Strategy is up 0.94% versus 1.41% for the MSCI AC World Index and -0.15% for the Barclays Global Aggregate (USD hedged). Year-to-date, the Multi Asset Risk Targeted Strategy has returned 8.14% versus 17.87% for the MSCI AC World index, while the Barclays Global Aggregate (USD hedged) index is up 5.84%. * The Multi Asset Risk Targeted Strategy performance is shown in USD net of fees for the representative account of the Multi Asset Risk Targeted (Medium) USD Composite and reflects the deduction of advisory fees and brokerage commission and the reinvestment of all dividends and earnings. Past performance is not indicative of future performance. This information is presented as supplemental information only and complements the GIPS compliant presentation provided on the following page.Strategy Behaviour
Performance Review
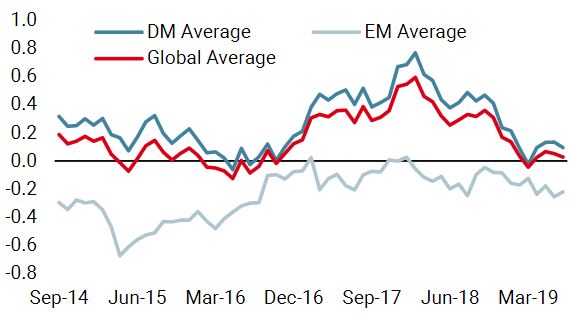
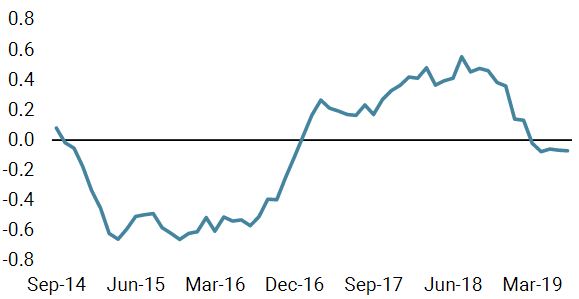
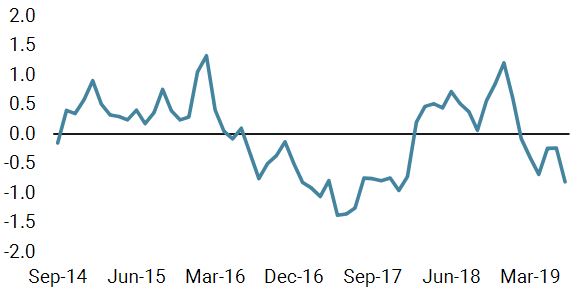
Unigestion Nowcasting
World Growth Nowcaster
World Inflation Nowcaster
Market Stress Nowcaster
Weekly Change
- Our world Growth Nowcaster remained unchanged this week, still pointing towards growth slightly above potential.
- Our world Inflation Nowcaster also remained unchanged, slightly below the zero line.
- Market stress is currently in low territories, as credit spreads narrowed recently.
Sources: Unigestion. Bloomberg, as of 15 July 2019.
Important Information Past performance is no guide to the future, the value of investments can fall as well as rise, there is no guarantee that your initial investment will be returned. This document has been prepared for your information only and must not be distributed, published, reproduced or disclosed by recipients to any other person. This is a promotional statement of our investment philosophy and services only in relation to the subject matter of this presentation. It constitutes neither investment advice nor recommendation. This document represents no offer, solicitation or suggestion of suitability to subscribe in the investment vehicles it refers to. Please contact your professional adviser/consultant before making an investment decision. Where possible we aim to disclose the material risks pertinent to this document, and as such these should be noted on the individual document pages. Please contact Unigestion for a complete list of all the applicable risks. Some of the investment strategies described or alluded to herein may be construed as high risk and not readily realisable investments, which may experience substantial and sudden losses including total loss of investment. These are not suitable for all types of investors. To the extent that this report contains statements about the future, such statements are forward-looking and subject to a number of risks and uncertainties, including, but not limited to, the impact of competitive products, market acceptance risks and other risks. As such, forward looking statements should not be relied upon for future returns. Data and graphical information herein are for information only and may have been derived from third party sources. Unigestion takes reasonable steps to verify, but does not guarantee, the accuracy and completeness of this information. As a result, no representation or warranty, expressed or implied, is or will be made by Unigestion in this respect and no responsibility or liability is or will be accepted. All information provided here is subject to change without notice. It should only be considered current as of the date of publication without regard to the date on which you may access the information. Rates of exchange may cause the value of investments to go up or down. An investment with Unigestion, like all investments, contains risks, including total loss for the investor. This information is issued by Unigestion (UK) Ltd (“Unigestion”), which is authorised and regulated by the UK Financial Conduct Authority (“FCA”). Unigestion is also registered as an investment adviser with the U.S. Securities and Exchange Commission (“SEC”). This information is intended only for professional clients, institutional clients and eligible counterparties, as defined by the FCA, and qualified purchasers as defined by the SEC and has therefore not been adapted to retail clients. Unigestion Multi Asset Risk-Targeted (USD): 31 December 2014 to 31 March 2019 1: This year is incomplete, it stops in March. Special Disclosure: For presentations prior to 31.03.2018 the strategy was measured against the LIBOR 3M USD + 4%. Beginning April 2018 the firm determined that the benchmark did not accurately reflect the strategy mandate and the benchmark was removed. Definition of the Firm: For the purposes of applying the GIPS Standards, the firm is defined as Unigestion. Unigestion is responsible for managing assets on the behalf of institutional investors. Unigestion invests in several strategies for institutional clients: Equities, Hedge Funds, Private Assets and the solutions designed for the clients of our Cross Asset Solution department. The GIPS firm definition excludes the Fixed Income Strategy Funds, which started in January 2001 and closed in April 2008, and the accounts managed for private clients. Unigestion defines the private clients as High Net Worth Families and Individual investors. Policies: Unigestion policies for valuing portfolios, calculating performance, and preparing compliant presentations are available upon request. Composite Description: The Multi Risk Targeted (Medium) composite was defined on 15 December 2014. It consists of accounts which aim to deliver consistent smooth returns of cash + 5% gross of fees across all market conditions over a 3-year rolling period. It seeks to achieve this by capturing the upside during bull markets while protecting capital during market downturns. Benchmark: Because the composites strategy is absolute return and investments are permitted in all asset classes, no benchmark can reflect this strategy accurately. Fees: Returns are presented gross of management fees, administrative fees but net of all trading costs and withholding taxes. The maximum management fee schedule is 1.2% per annum. Net returns are net of model fees and are derived by deducting the highest applicable fee rate in effect for the respective time period from the gross returns each month. List of Composites: A list of all composite descriptions is available upon request. Minimum Account Size: The minimum account size for this composite is 5’000’000.- USD. Valuation: Valuations are computed in US dollars (USD). Performance results are reported in US dollars (USD). Internal Dispersion & 3YR Standard Deviation: The annual composite dispersion presented is an asset-weighted standard deviation calculated for the accounts in the composite the entire year. When internal dispersion is not presented it is as a result of an insufficient number of portfolios in the composite for the entire year. When the 3 Year Standard Deviation is not presented it is as a result of an insufficient period of time. Compliance Statement Unigestion claims compliance with the Global Investment Performance Standards(GIPS®) and has prepared and presented this report in compliance with the GIPS standards. Unigestion has been independently verified for the periods 1 January 2003 to 31 December 2016. The verification report(s) is/are available upon request. Verification assesses whether (1) the firm has complied with all the composite construction requirements of the GIPS standards on a firm-wide basis and(2) the firms policies and procedures are designed to calculate and present performance in compliance with the GIPS standards. Verification does not ensure the accuracy of any specific composite presentation.
Year
Composite
Return Gross
of FeesComposite Net Return
Benchmark Return
Number of Accounts
Internal Dispersion
Composite 3-Yr Std Dev
Benchmark 3-Yr Std Dev
Composite AUM (M)
Firm
AUM (M)
2015
-1.61%
-2.80%
–
1
–
–
–
127.24
15,550.31
2016
5.05%
3.79%
–
1
–
–
–
129.66
18,144.46
2017
11.16%
9.82%
–
1
–
–
–
169.51
22,340.80
2018
-2.91%
-4.08%
–
1
–
–
–
286.93
21,403.49
20191
5.06%
4.74%
–
1
–
–
–
278.23
21’266.46