Overview
2020 so far has been a very turbulent period for equity investors. The combination of the global pandemic and the resulting lockdown triggered a sudden stop in the global economy prompting elevated volatility levels and wild swings in equity markets. In this paper, we review what has worked and what has not in our risk-managed equity strategies, and discuss what to expect going forward.
Historic Velocity of the Market Crash
When London’s Big Ben clock rang to mark the start of 2020, people had little idea of the ominous events to come, while investors could never have expected the trials ahead. In 2019, global stock markets posted their best year since the financial crisis as investors shrugged off trade tensions and warnings of slowing growth in major economies. Fast forward to today and stocks are falling at an unprecedented rate with violent swings in equity markets. Having returned to positive territory for the year on 8 June, the S&P 500 index continued to rally higher, only for investors to see the sharpest sell-off since the big collapse in March, as shown in Figures 1A and 1B.
Figure 1A: Comparing Equity Corrections in Different Crisis Periods
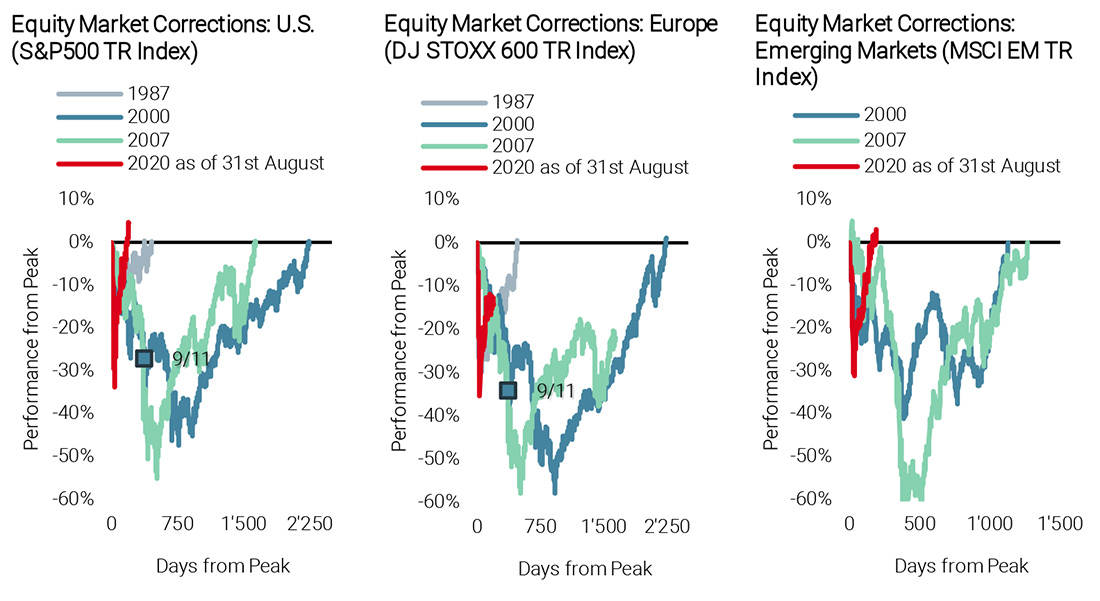
Source: Bloomberg, Unigestion. Data as of 31 August 2020
Figure 1B: Equity Volatility in 2020
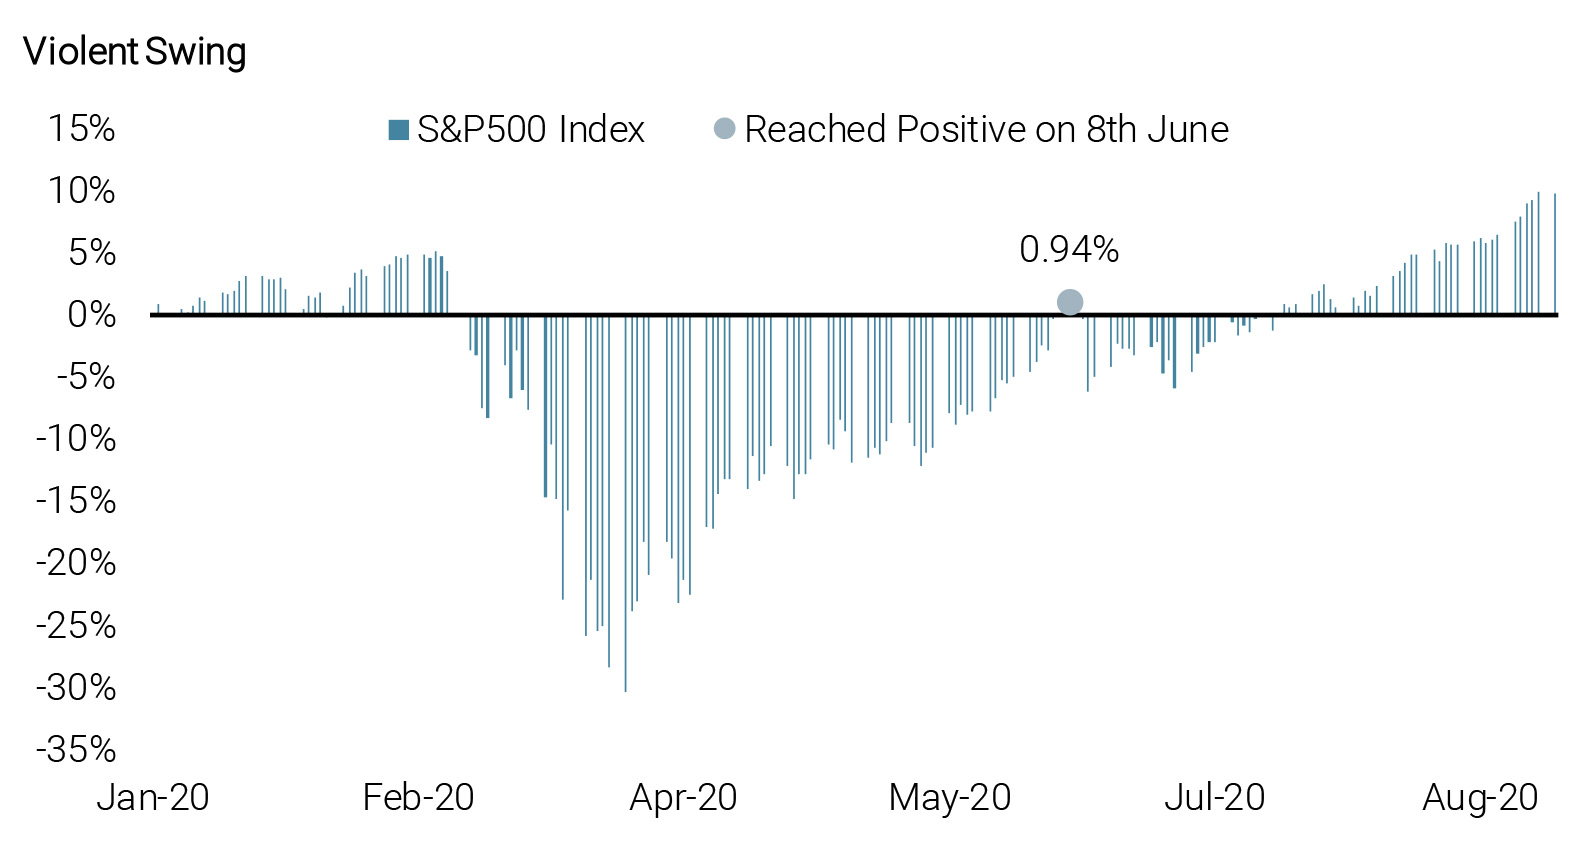
Source: Bloomberg, Unigestion. Data as of 31 August 2020
Similarly, after falling around 51% from peak to trough in 47 days (17 January until 23 March), the MSCI Emerging Markets index has rallied approximately 45% since the bottom on 23 March this year.
Figure 1C: Emerging Market Rally
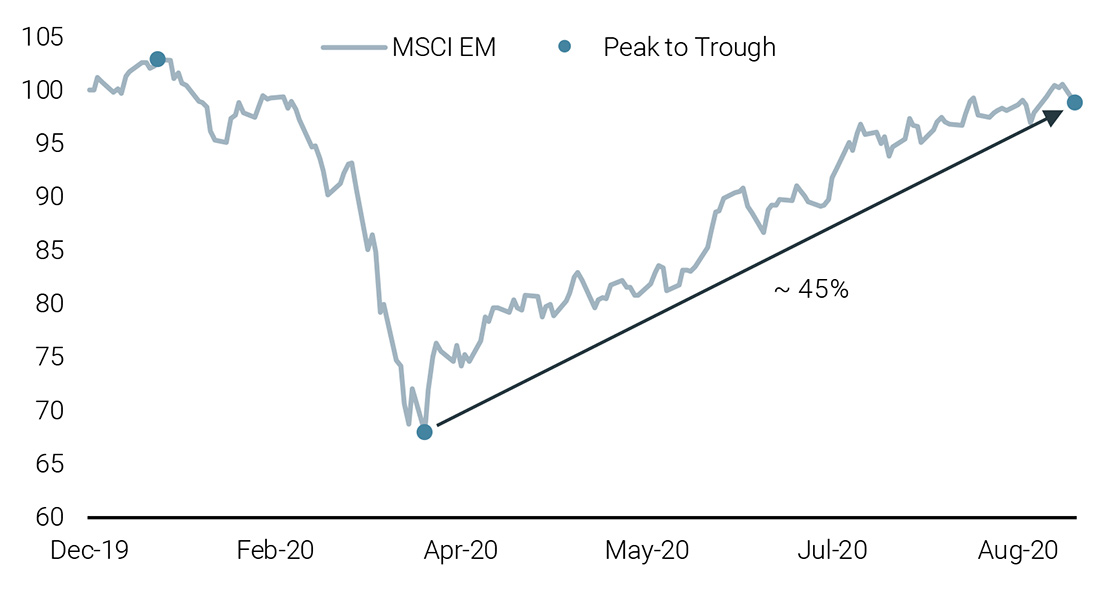
Source: Bloomberg, Unigestion. Data as of 31 August 2020
Diversification Did Not Work
The steep sell-off has led markets to become highly correlated with little discrimination between stocks and sectors. Traditional defensive sectors, such as Utilities, failed to provide enough protection during the early phase of the market decline. Subsequently, we have witnessed a sharp rise in pairwise correlations in equity markets, which has left Low Volatility factor stocks struggling despite their typically defensive nature. Figure 2 shows the performance of the top quintile of Low Volatility stocks (Q1), which failed to outperform the other quintiles during the recent pandemic. It is also interesting to see how higher beta/volatility stocks, for example, the bottom quintile of Low Volatility stocks (Q5), delivered better than expected performance, unlike their performance in earlier crisis episodes such as the DotCom bubble and the GFC.
Figure 2: Top Quintile Performance of Low Volatility Stocks During Crisis Periods
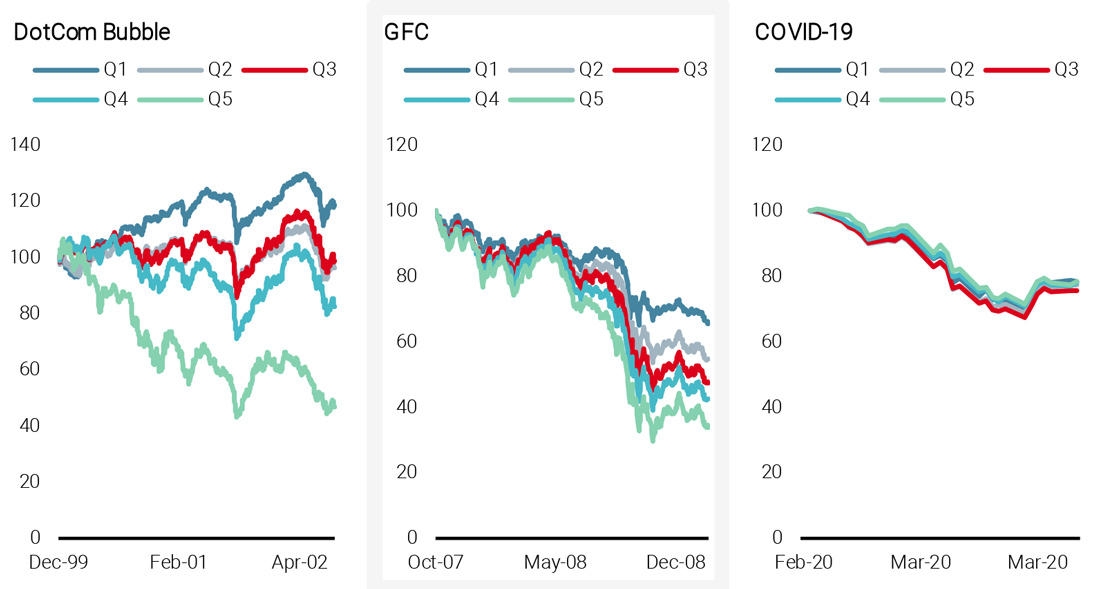
Source: Unigestion. Data as of 31 March 2020
Valuation Did Not Work
Equity valuations hit record highs earlier this year, with the S&P 500’s forward P/E ratio rising to 19.5x in mid-January, its highest since 2002. Earnings growth has been on the decline and lacking visibility in the face of Covid -19. The forces of a global pandemic and the resulting lockdown created a sudden pause in the world economy and further pushed the cycle into recession. All these factors led us to believe that Value would outperform Growth in the recent sell-off. However, in reality, Value fell sharply and suffered its worst quarter for the past two decades. In contrast, Momentum and Quality fared reasonably well, as shown in Figure 3.
Figure 3: MSCI ACWI Performance by Factor
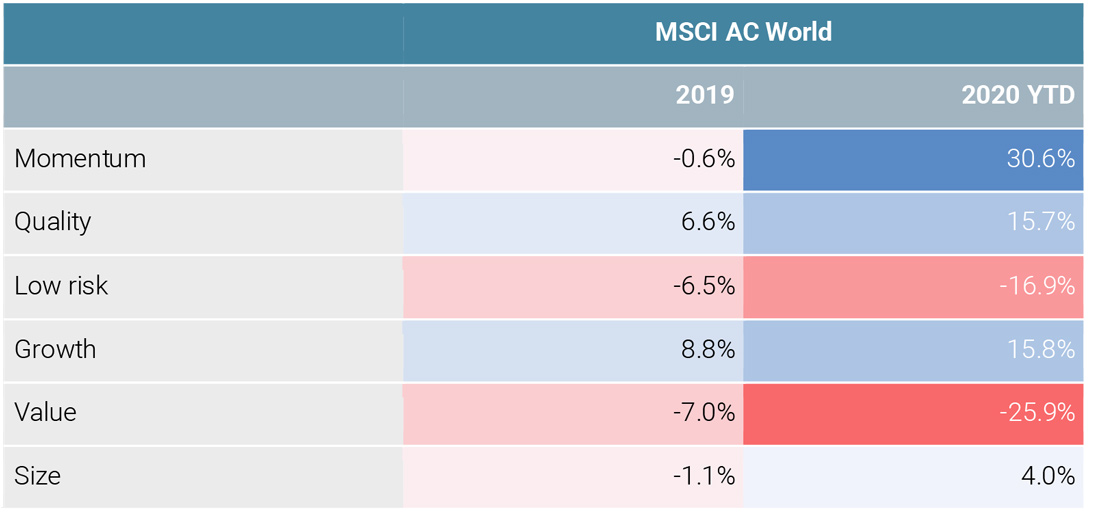
Source: Unigestion, Bloomberg. Data as of 31 August 2020
A Collaboration between Human and Model
Our Dynamic Risk Model Worked Well
As Nobel laureate Professor Robert Engle once pointed out, volatility estimation has important applications for risk management and, in practice; volatility forecasting has important implications for all investors focused on risk-adjusted returns. For instance, if we believe there is a risk premium associated with volatility, which we all think must be true, then we have to be able to forecast it to some degree and to respond to market events as they unfold.
In this extremely volatile period where share prices are swinging sharply, our proprietary risk model’s dynamic component, which is based on the current implied volatility level (VIX index), has adjusted the model half-life that determines how heavily recent history is weighted when estimating volatility. In this way, the model produces a much more accurate risk estimation during the changing regimes. Figure 4 compares the beta estimations using a traditional risk model and our dynamic risk model, in dark blue and light blue, respectively. The difference in Technology stock betas in particular is notable. The standard model still indicates a very high beta and, consequently, high volatility and correlation. Conversely, the dynamic model adapted to the new behaviour of Technology stocks much more quickly.
Figure 4: Sector Beta Estimations: Traditional vs Dynamic Risk Model
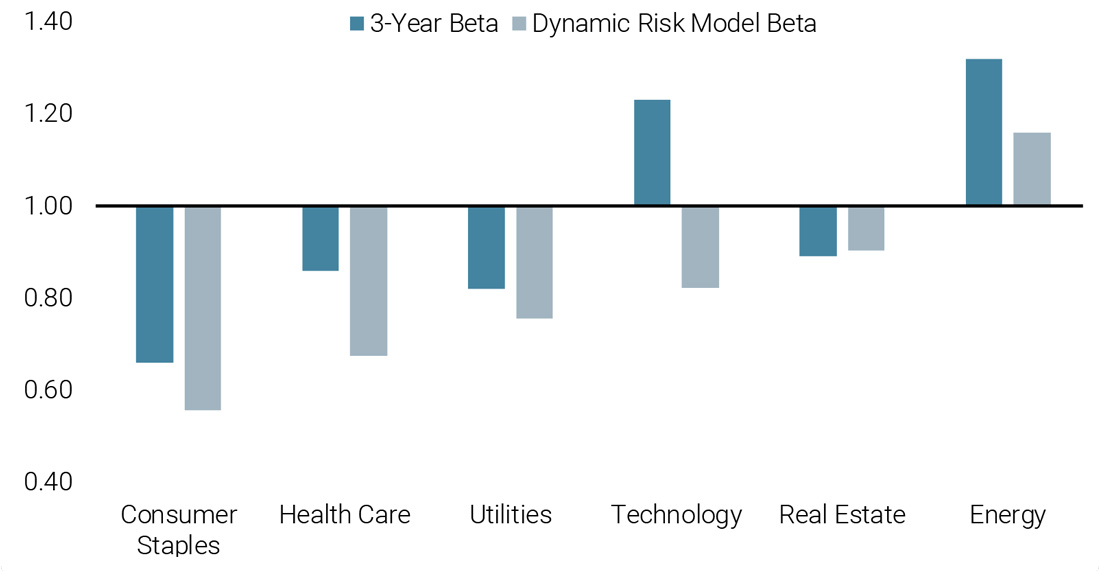
Source: Unigestion, Bloomberg. Data as of 31 March 2020
Our Fundamental Risk Assessment Worked Well
The Covid-19 crisis has created a series of unprecedented effects: oil prices plunging into negative territory, disrupted global supply chains, demand shocks affecting consumer spending, collapsing trade and tourism, and soaring employment rates. In such a situation, we have to admit that no model has been designed to cope with the combination of all these circumstances. When conventional style and factor dynamics break down, disconnects can appear between companies’ business models, fundamentals and market prices. At this point, it is crucial to understand the nature of each firm’s operating model and to analyse potential vulnerabilities on a bottom-up fundamental basis as well as the economic consequences of the Covid-19 crisis. For that reason, we are focusing on detecting stocks with the new emerging risk in the areas of:
- Airports closings and grounded flights
- Tourism economy fallout
- Malls, hotels and restaurants shutdown
- Rent suspension risk
- Work from home impacts
- Business disruption liabilities
As a result, we have significantly diversified the risks associated with the current market environment, as shown in Figure 5.
Figure 5: Identifying Stocks at Risk Using Bottom-up Analysis
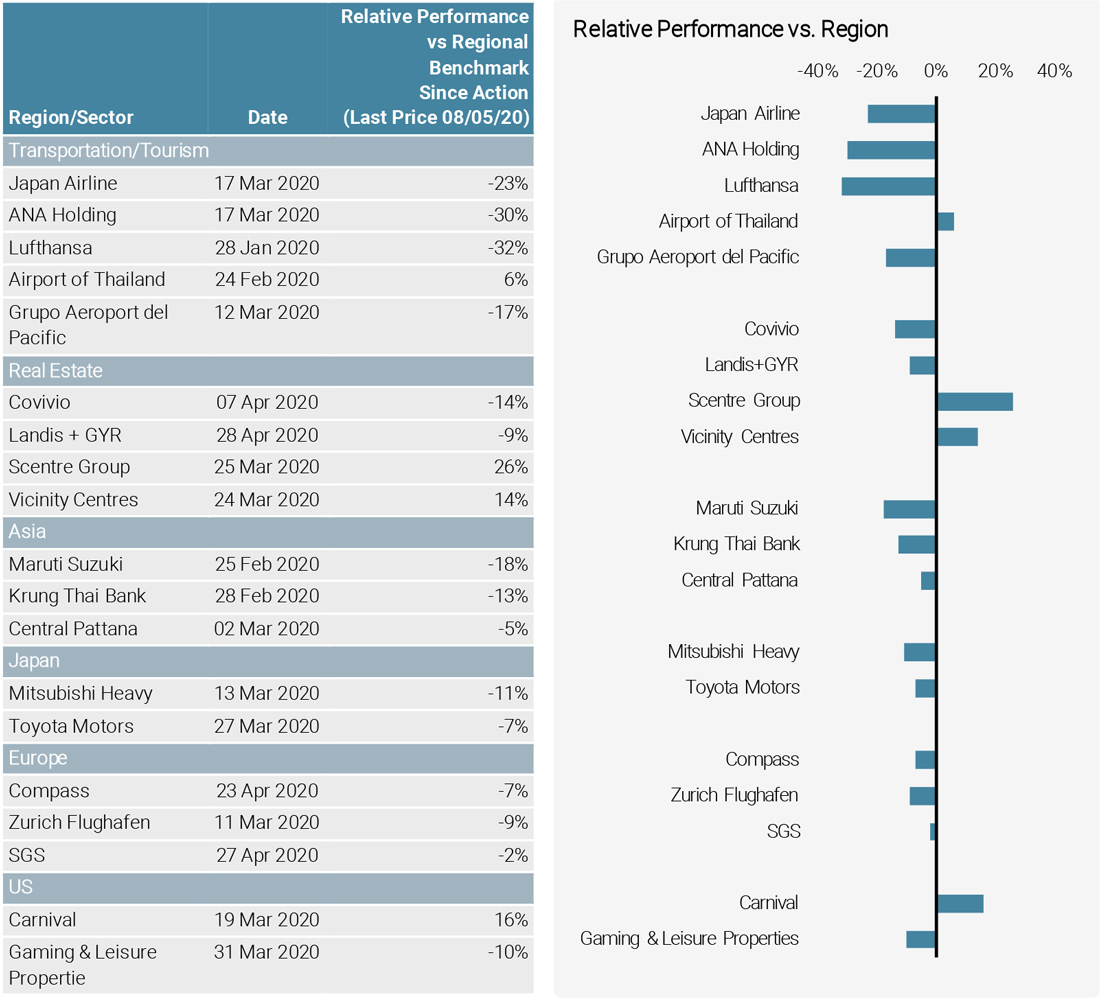
Source: Unigestion, Bloomberg. Data as of 31 May 2020
Looking Ahead in 2020 – Staying Invested through Volatile Periods
Managing the Risks and Remaining Positive on Equities
In the second half of this year, we are going to see a continued impact from the Covid-19 crisis and we remain constructive on equities. Figure 6 shows the evolution of our proprietary macro newsflow sentiment indicator (World Growth Newscaster) in blue, which provides a much faster, more dynamic signal than the traditional, lagged macro indicators (in red). After experiencing a significant drop from mid-February as a sense of panic unfolded in the news, it has gradually recovered since then.
Figure 6: Our Higher Frequency Signals Indicate that the Recession is Ending
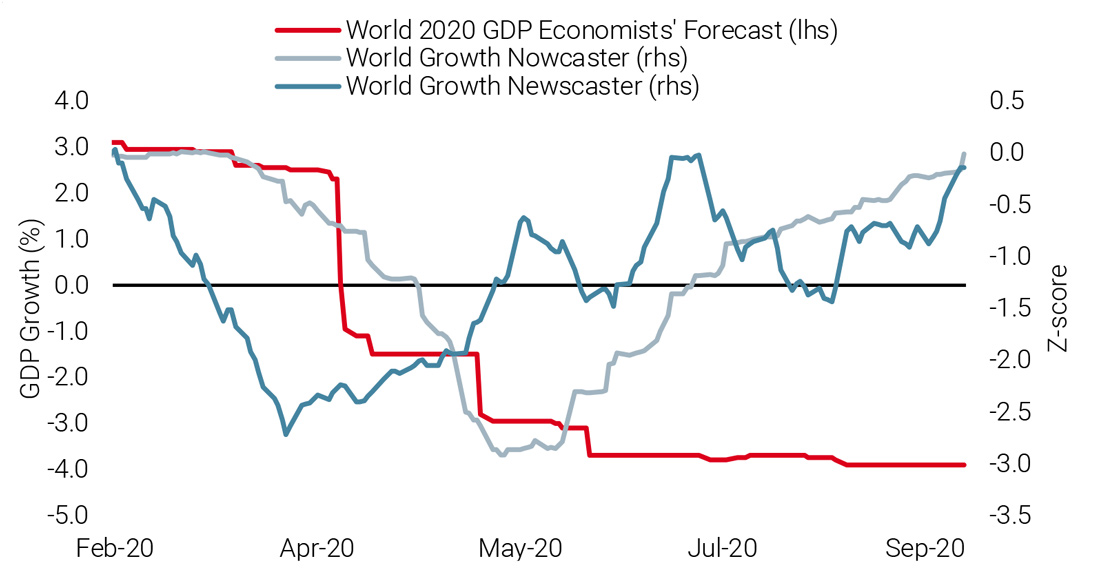
Source: Unigestion, Bloomberg Data as of 31 August 2020
The early stages of an improvement in the macroeconomy are visible, supported by central banks ready to do “whatever it takes” and an epidemic that looks to have done its worst to the world’s major economies. We therefore continue to believe in a Vshaped economic recovery, in line with our systematic indicators. Our Growth Nowcaster, as shown in Figure 7, presently points to the end of the recession in a handful of key economies, including the US, China, Brazil and Taiwan. Laggards include the Eurozone, Japan, and Mexico but all are improving.
Figure 7: Macroeconomic Data Continues to Improve in Developed and Emerging Markets
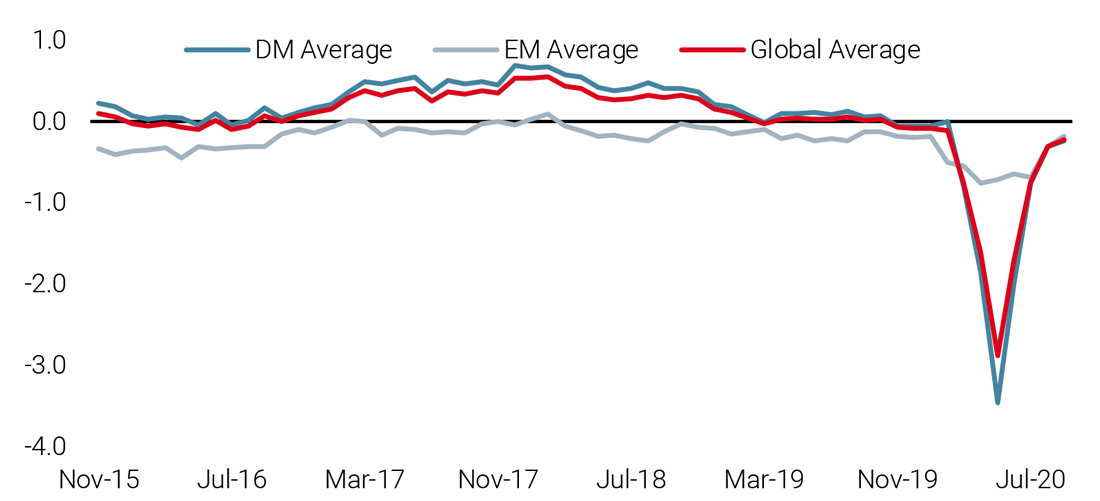
Source: Unigestion, Bloomberg. Data as of 4 September 2020
A Resilient Performance from Technology Stocks but “Mind the Cap”
As mentioned above, in June the S&P 500 index reached positive territory for the year, primarily led by the Technology sector and the FAAMG stocks in particular (Facebook, Amazon, Apple, Microsoft, and Google), as shown in Figure 8.
Figure 8: Technology Sector Performance in 2020
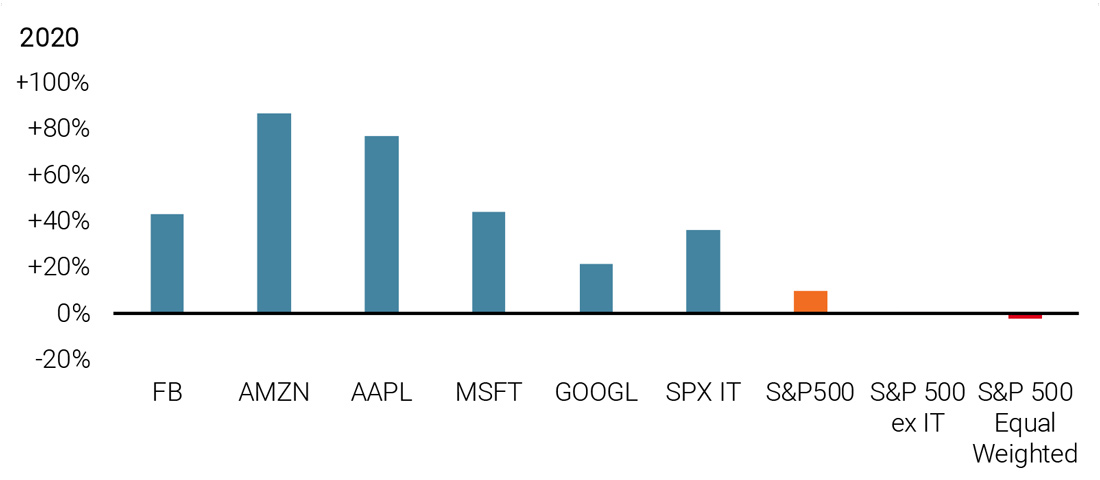
Source: Unigestion, Bloomberg. Data as of 31 August 2020
Globally, technology-related stocks, such as Alibaba and Tencent in the Emerging Market universe have also held up relatively well compared to some of the traditional defensive sectors.
The Covid-19 situation has amplified the demand for technology and related services. Broadband, video conferencing, streaming, games, and e-commerce are now essential services as the outbreak has increased the need for online shopping, distance learning and home working. From a fundamental and business perspective, these companies have delivered strong growth over the past few years and demonstrated robust balance sheet strength. Asset-light business models have placed tech companies in a better position to navigate the current sudden shock and its aftermath. For example, despite the early news that Covid-19 was hurting Apple’s supply chain, it has helped to boost the firm’s streaming services recently. In Emerging Markets, Alibaba enjoyed a very good year-on-year performance driven by resilience in its e-commerce division, as shown in Figure 91.
Figure 9: Evolution of Alibaba’s Business between Q1 of 2019 and Q1 2020
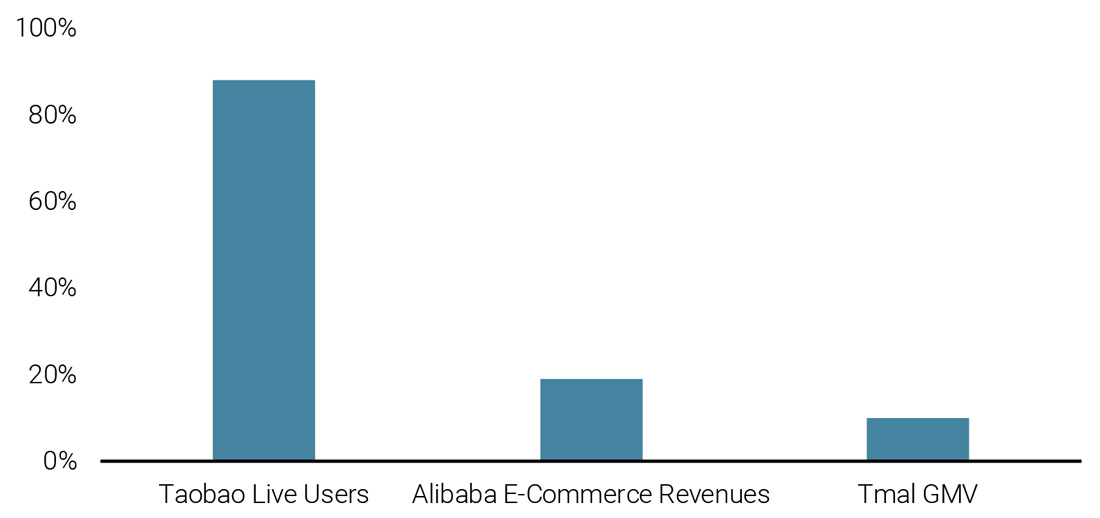
Source: Alibaba Quarterly Earning Reports, https://walkthechat.com/how-did-covid-19-impact-alibaba-and-tencents-earnings/ Data as of 31 May 2020
While tech stocks command high market values, signs of a regime change are beginning to appear in the economic data. Figure 10 shows the US employment growth rate in new versus old world industries. The former, which comprises electronic shopping, software publishing and internet publishing, is in sharp contrast to the latter, comprising the following sectors in the US Establishment Survey: retail trade, transportation and warehousing, publishing industries ex internet, leisure and hospitality, and real estate and rentals.
Figure 10: A Shifting Landscape: New vs Old World Industries

Source: Unigestion, Bloomberg. Data as of 31 August 2020
However, it is too early to say definitively that the tech sector is the new defensive as we look at concentration, diversification and sustainable growth. As shown in Figure 11, in 2001, the largest constituent in the MSCI World index was GE followed by Microsoft, Exxon, CITI and Walmart, together representing less than 5% of the index and with greater diversification from a sector perspective. However, today this is a very different picture with little diversification. In the US market, technology companies account for more than 28% of the S&P 500, which is capitalisation-weighted. Microsoft, Apple, Amazon, Facebook and Alphabet comprise approximately 24% of that index, as of May 2020.
Figure 11: The Largest Constituents in the MSCI World Index
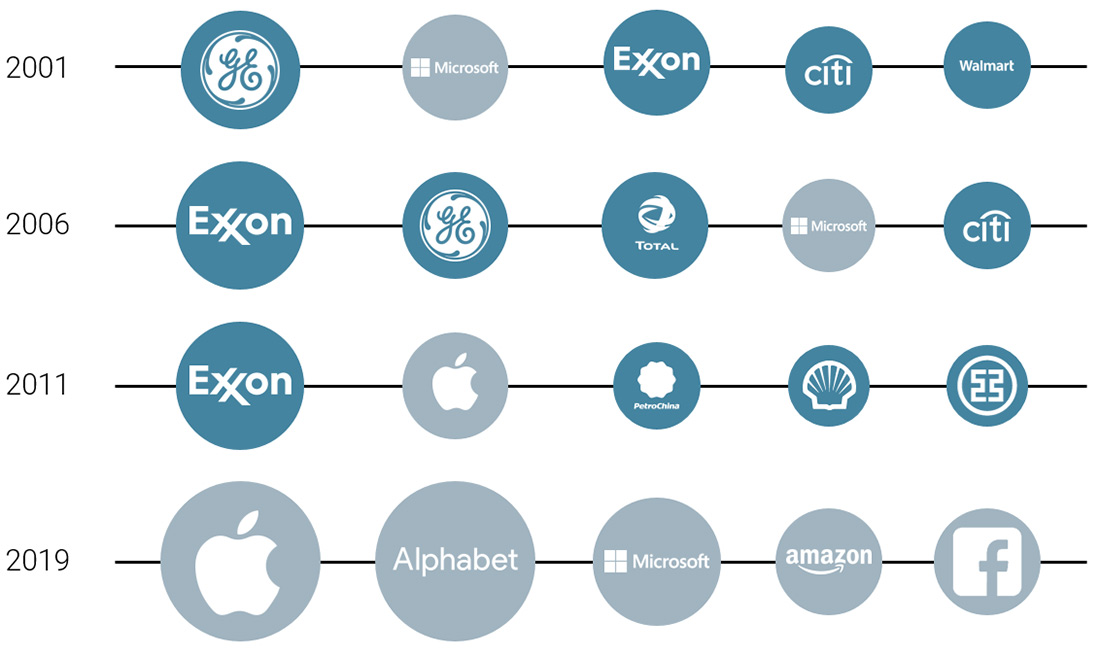
Source: Unigestion, Bloomberg. Data as of 31 May 2020
And in terms of leadership longevity, history tells us that, « Nearly half of superstar firms fall out of the top 10% in each business cycle, and that 40% of those dropouts fell all the way down to the bottom 10%. »2 , which all investors should evaluate from time to time. Among the top nine largest technology stocks in March 2000 by market cap, only two stocks have managed to achieve a similar valuation for a second time, Microsoft and IBM, as shown in Figure 12.
Figure 12: Peak Market Cap in 2000 and the Date When That Market Cap Was Next Achieved
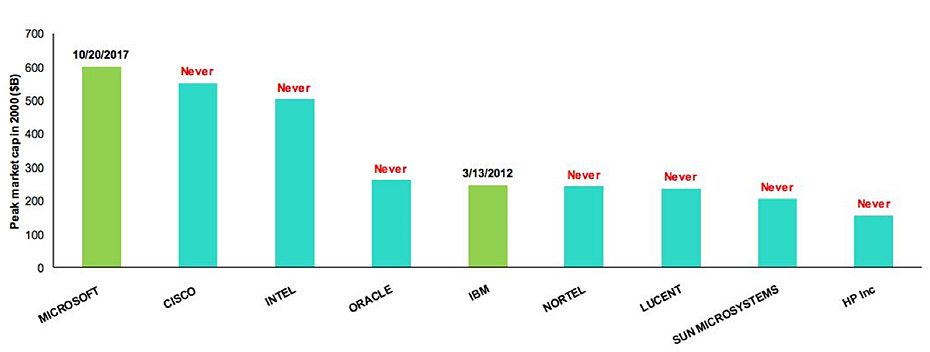
Source: FT, Sept 2020.
https://ftalphaville.ft.com/2020/09/15/1600182951000/SnapAV–12-years-in-the-red/
Low Volatility, High Quality, Well-Valued Portfolios Are Best Equipped to Navigate Recessionary Environments
Recent market conditions have repeatedly upended conventional factor performances and their correlation structures. We have witnessed the rift between Value and Growth stocks widen dramatically, as well as historically high correlations between Momentum and Low Volatility (positively correlated) and extremely negative correlations between Momentum and Value. A less diversified portfolio that has a strong bias to a particular factor may carry higher risks and suffer significant drawdowns. To seek the potential for diversification across factors, we have analysed the last 20 years through the lens of our proprietary Nowcaster indicators and have calculated the annualised average factor returns depending on the level of the recession risk for the global economy, from very low risk in dark blue to very high in green. As Figure 13 shows, Momentum is the worst performing factor in adverse environments, while low volatility stocks are the best, as expected. Value also benefits from this scenario as companies whose valuation reflects high growth expectations tend to disappoint more frequently as global consumption and investment are impacted. Quality is also paying off as companies with more robust and healthy financial situations, together with stable earnings, tend to suffer less. Finally, mega-caps tend to underperform as they suffer the reversal from too high expectations, which pushes their weight too high in traditional capitalisation-weighted benchmarks.
Figure 13: Factor Returns in Periods of Varying Recession Risk
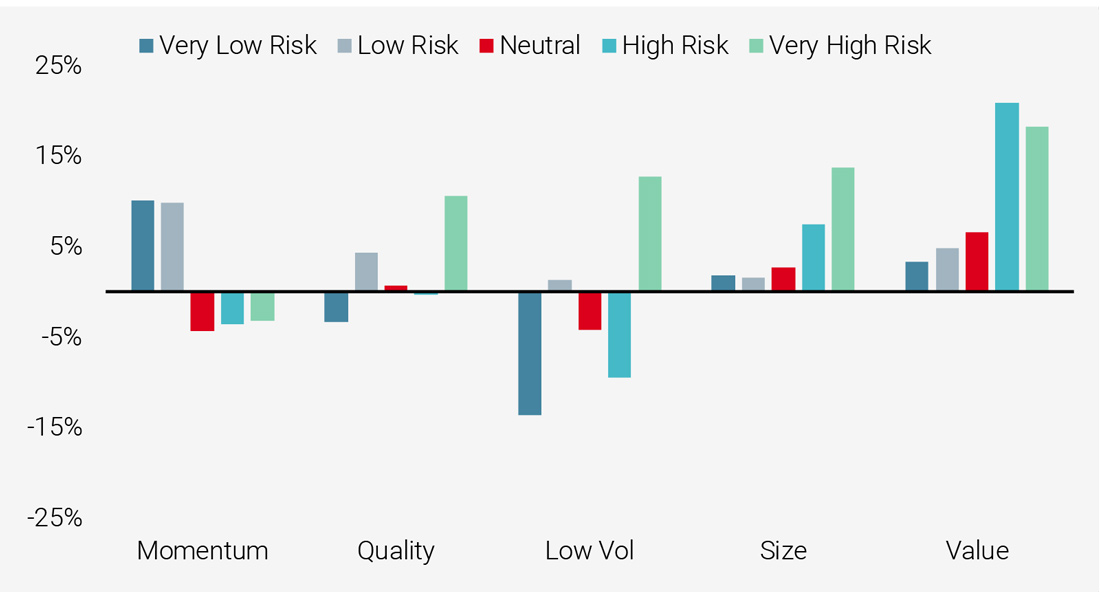
Source: Unigestion, Bloomberg. Data as of 31 May 2020
Summary
Constructive but Acknowledging the Risks
Looking ahead, policy supports remains strong, economic data is showing clear signs of improvement and low interest rates should continue to support the equity market. We believe it is important to take measured risks and fortify our equity portfolio with the following:
- Fundamental quality
- A positive ESG tilt
- Avoidance of valuation extremes
- Diversified styles
1https://walkthechat.com/how-did-covid-19-impact-alibaba-and-tencents-earnings/
Important Information
Past performance is no guide to the future, the value of investments, and the income from them change frequently, may fall as well as rise, there is no guarantee that your initial investment will be returned. This document has been prepared for your information only and must not be distributed, published, reproduced or disclosed by recipients to any other person. It is neither directed to, nor intended for distribution or use by, any person or entity who is a citizen or resident of, or domiciled or located in, any locality, state, country or jurisdiction where such distribution, publication, availability or use would be contrary to law or regulation.
This is a promotional statement of our investment philosophy and services only in relation to the subject matter of this presentation. It constitutes neither investment advice nor recommendation. This document represents no offer, solicitation or suggestion of suitability to subscribe in the investment vehicles to which it refers. Any such offer to sell or solicitation of an offer to purchase shall be made only by formal offering documents, which include, among others, a confidential offering memorandum, limited partnership agreement (if applicable), investment management agreement (if applicable), operating agreement (if applicable), and related subscription documents (if applicable). Please contact your professional adviser/consultant before making an investment decision.
Where possible we aim to disclose the material risks pertinent to this document, and as such these should be noted on the individual document pages. The views expressed in this document do not purport to be a complete description of the securities, markets and developments referred to in it. Reference to specific securities should not be considered a recommendation to buy or sell. Unigestion maintains the right to delete or modify information without prior notice. Unigestion has the ability in its sole discretion to change the strategies described herein.
Investors shall conduct their own analysis of the risks (including any legal, regulatory, tax or other consequences) associated with an investment and should seek independent professional advice. Some of the investment strategies described or alluded to herein may be construed as high risk and not readily realisable investments, which may experience substantial and sudden losses including total loss of investment. These are not suitable for all types of investors.
To the extent that this report contains statements about the future, such statements are forward-looking and subject to a number of risks and uncertainties, including, but not limited to, the impact of competitive products, market acceptance risks and other risks. Actual results could differ materially from those in the forward-looking statements. As such, forward looking statements should not be relied upon for future returns. Targeted returns reflect subjective determinations by Unigestion based on a variety of factors, including, among others, internal modeling, investment strategy, prior performance of similar products (if any), volatility measures, risk tolerance and market conditions. Targeted returns are not intended to be actual performance and should not be relied upon as an indication of actual or future performance.
No separate verification has been made as to the accuracy or completeness of the information herein. Data and graphical information herein are for information only and may have been derived from third party sources. Unigestion takes reasonable steps to verify, but does not guarantee, the accuracy and completeness of information from third party sources. As a result, no representation or warranty, expressed or implied, is or will be made by Unigestion in this respect and no responsibility or liability is or will be accepted. All information provided here is subject to change without notice. It should only be considered current as of the date of publication without regard to the date on which you may access the information. Rates of exchange may cause the value of investments to go up or down. An investment with Unigestion, like all investments, contains risks, including total loss for the investor.
Legal Entities Disseminating This Document
UNITED KINGDOM
This material is disseminated in the United Kingdom by Unigestion (UK) Ltd., which is authorized and regulated by the Financial Conduct Authority (« FCA »). This information is intended only for professional clients and eligible counterparties, as defined in MiFID directive and has therefore not been adapted to retail clients.
UNITED STATES
This material is disseminated in the U.S. by Unigestion (UK) Ltd., which is registered as an investment adviser with the U.S. Securities and Exchange Commission (“SEC”). This information is intended only for institutional clients and qualified purchasers as defined by the SEC and has therefore not been adapted to retail clients.
EUROPEAN UNION
This material is disseminated in the European Union by Unigestion Asset Management (France) SA which is authorized and regulated by the French “Autorité des Marchés Financiers” (« AMF »).
This information is intended only for professional clients and eligible counterparties, as defined in the MiFID directive and has therefore not been adapted to retail clients.
CANADA
This material is disseminated in Canada by Unigestion Asset Management (Canada) Inc. which is registered as a portfolio manager and/or exempt market dealer in nine provinces across Canada and also as an investment fund manager in Ontario, Quebec and Newfoundland & Labrador. Its principal regulator is the Ontario Securities Commission (« OSC »). This material may also be distributed by Unigestion SA which has an international advisor exemption in Quebec, Saskatchewan and Ontario. Unigestion SA’s assets are situated outside of Canada and, as such, there may be difficulty enforcing legal rights against it.
SWITZERLAND
This material is disseminated in Switzerland by Unigestion SA which is authorized and regulated by the Swiss Financial Market Supervisory Authority (« FINMA »).
Document issued September 2020.