Going into this earnings season, analyst expectations were fairly dour and thus relatively modest results were enough to clear these low hurdles. For firms in the S&P 500, EPS growth stands at 7% on a year-on-year (yoy) basis, surprising by 19%. Indeed, the EPS of nearly 80% of firms beat expectations.
Although the reporting season in Europe is not as far along, results there are also noteworthy: EPS growth is down -15% on a yoy basis, but 70% of firms have beat their estimates with an aggregate surprise of 12%. Clearly, Europe’s tighter restrictions at the end of last year had a significant impact on demand, though firms seem to be leaner and better able to absorb the loss in revenue.
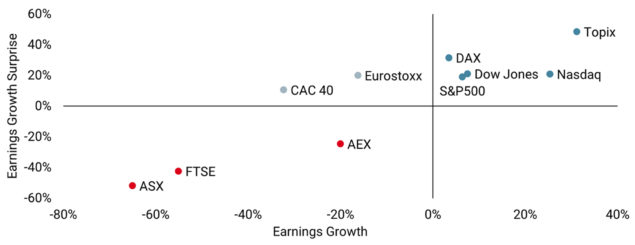
Source: Bloomberg, Unigestion. Data as at 12 February 2021.
Important Information
The information and data presented in this page may discuss general market activity or industry trends but is not intended to be relied upon as a forecast, research or investment advice. It is not a financial promotion and represents no offer, solicitation or recommendation of any kind, to invest in the strategies or in the investment vehicles it refers to. Some of the investment strategies described or alluded to herein may be construed as high risk and not readily realisable investments, which may experience substantial and sudden losses including total loss of investment.
The investment views, economic and market opinions or analysis expressed in this page present Unigestion’s judgement as at the date of publication without regard to the date on which you may access the information. There is no guarantee that these views and opinions expressed will be correct nor do they purport to be a complete description of the securities, markets and developments referred to in it. All information provided here is subject to change without notice. To the extent that this page contains statements about the future, such statements are forward-looking and subject to a number of risks and uncertainties, including, but not limited to, the impact of competitive products, market acceptance risks and other risks.
Data and graphical information herein are for information only and may have been derived from third party sources. Although we believe that the information obtained from public and third party sources to be reliable, we have not independently verified it and we therefore cannot guarantee its accuracy or completeness. As a result, no representation or warranty, expressed or implied, is or will be made by Unigestion in this respect and no responsibility or liability is or will be accepted. Unless otherwise stated, source is Unigestion.
Past performance is not a guide to future performance. All investments contain risks, including total loss for the investor.