From Benjamin Graham to Novy-marx: What Machine Learning Likes on Quality
Client Portfolio Manager, Equities
Head of Equity Risk Premia
Key Points
- Quality has long been recognised by both academia and practitioners.
- Quality does not always mean defensive and 2022 is a prime example
of that - The saying goes that “no two managers define Quality in the same way”
- Machine Learning techniques can help make this great factor … better!
Executive Summary
“Quality is not an act, it is a habit” – Aristotle.
In a much wider background of life and excellence, the ancient Greek philosopher passes his wisdom to his disciples revealing the essence of quality in the dimensions of time, attitude and legitimacy. To apply the same wisdom in the context of the systematic factor investment, ultimately, quality is the continuity that leads to excellence- a habit to systematically identify the most relevant and attractive ingredients for an investment style. With the evolution of technological and computational methods and knowing the cyclicality of the different factors and signals, investors would do well to combine metrics with Machine Learning (ML) algorithms to achieve a more consistent risk-return profile, and better capture the Quality factor premium over medium to long term.
In Times of Turbulence
Global equity markets finished notably lower in September and continued their year-to-date decline, marking three straight negative quarters since the Global Financial Crisis in 2008. Emerging market stocks were not immune to the downtrend, posting their fifth consecutive quarter of declines. Emerging market stocks have experienced their longest losing streak since 1992 amid the global growth slowdown that has weakened demand for developing countries’ exports, with increased geopolitical risks and the FED’s tightening programme, together with a stronger dollar. Entering Q4, while developed markets notched up a gain in October, emerging market equities were mixed and continued their year-to-date decline.
Looking at the traditional risk premium factors, we observed a huge dispersion between developed and emerging markets. Despite a temporary risk-on mood in July driven by earnings surprises, with the big swings in the market, we saw Lower Volatility stocks outperform in most developed markets. This was the result of investors evaluating the macro environment and market dynamics, while the difference in performance between lower and higher volatility stocks in emerging markets was more muted. The Value factor, which has worked well for most of 2022 in both developed and emerging markets, was also more muted during the summer before resuming its positive trend into Q4.
Navigating the Factor Zoo on Quality
Quality as an investment style has been widely discussed in academic literature and has experienced growing interest among practitioners. Quality has delivered long-term outperformance, however, there is no clear consensus on how the quality factor is defined. The concept of quality can be traced back as far as Graham’s famous book in 1973, The Intelligent Investor [1], where he published a list of seven criteria for stock selection. Among those, five are related to quality, as illustrated in Exhibit 1. It is intriguing to learn, as a pioneer of value investing, Graham had already realised that value and quality went hand in hand back in the 1970s.
Exhibit 1: Graham’s seven criteria for stock selection
| 1. Adequate enterprise size | Quality |
| 2. Strong financial condition, measured by current ratios that exceed two and net current assets that exceed long term debt | Quality |
| 3. Earnings stability, measured by 10 consecutive years of positive earnings | Quality |
| 4. A dividend record of uninterrupted payments for at least 20 years | Quality |
| 5. Earnings-per-share growth of at least one-third over the last ten years | Quality |
| 6. Price of stock more than 1.5 times book value | Value |
| 7. Price no more than 15 times average earnings of the past three years | Value |
Since then, academic research on quality as an investment factor has been continuously developed. For instance, Sloan (1996)[2] discussed accruals, Greenblatt (2010)[3] talked about return on invested capital (ROIC), Novy-Marx (2013)[4] focused on gross profitability and Xing (2008)[5] on investment growth. In 2015, Fama and French[5] finally included the profitability factor, in their five-factor model. With extensive academic research studies providing strong empirical evidence of the existence of the profitability premium, it’s no surprise that measures of profitability have become one important dimension of the quality factor, and the most frequently used characteristics when constructing portfolios.
While Quality is often associated with defensiveness, profitability measures may overly expose investors to aggressive profit-chasing stocks and result in unintended risk. For example, a company that has excessive financial leverage associated with a cash flow may jeopardise its earnings, and subsequently, lead to financial distress. Introducing the “Safety” dimension into the overall quality factor construction will help mitigate the risk and further identify companies with a robust balance sheet of a low leverage ratio[6], and high current ratios (current assets to current liabilities), among others.
2022 presents a prime example to illustrate the point made above in terms of defensiveness, and possible lack of it. With many equity markets down double-digit percentage points, Quality (as defined primarily by Profitability metrics) has by far and large failed to mitigate the impact of the negative performance in a strong risk-off environment. With insight, the clear sector biases of underweight Energy and overweight Technology positioned the factor poorly in the context of the duration risk that materialised. Furthermore, compared to a pure Low Volatility defensive factor, we find a Quality factor that, at the start of 2022 was trading at a premium (cross-sectional score correlation to Value of -0.15 for Quality (i.e. trading at a premium) vs +0.19 for Low Volatility (i.e. trading at a discount)). A premium, therefore, while also exhibiting a significant beta differential: at the end of 2021, the best quintile of Quality factor within the MSCI World universe had a median ex-ante beta of 0.82, compared
with 0.58 for Low Volatility. The gap has further widened throughout the year to 0.88 vs 0.47 at the end of October 2022.
With more and more research studies exploring the quality anomaly, some academics and practitioners have also started discussing and analysing different dimensions of the quality factor, and how each metric is selected within the dimensions. For example, Asness et al. (2019)[8] proposed a quality factor as “quality minus junk, the QMJ factor, which consists of three dimensions, namely safety, profitability, growing and well-managed. Hsu et al.[9] (2019) analysed a comprehensive group of quality categories and concluded that profitability, accounting quality, payout/dilution, and investment tend to be associated with quality-related premia. And furthermore, it is shown that the profitability and investment-related characteristics tend to capture most of the quality-related premia, despite this the paper did not combine them to create a single quality factor.
There has been growing interest in Machine Learning (ML) in recent times given algorithms are more than capable to digest a large amount of data, identify patterns and build predictability that constantly evolves. Importantly, it adapts to continuous feedback and market dynamics. As we mentioned in our earlier edition, at Unigestion, we have worked on developing our ML techniques over the last few years and have uncovered how ML-based stock selection models can successfully enhance the performance of risk-managed portfolios. More recently, we have further enhanced our model and applied it to our active factor investing strategies – training the machine to identify where it has learnt enough to discover ‘alpha’. Specifically, we have implemented ML-based forecasts into our Multi-Factor Equity strategy to take into account the dynamic nature of the ML methodology. After exploring the Value « zoo », we conducted a new study on the Quality « camp ».
In this study, our ML algorithm gathers around 50 indicators across the dimensions of profitability, safety, stability and turnover (in the sense of operating efficiency) and is set to uncover the non-linear relationships between those indicators and the expected returns. When navigating the factor zoo within the Quality factor category, we can see that:
- all four main categories of Profitability, Safety, Stability and Turnover have their corresponding metrics that are favoured by the ML algorithm, and
- not all quality metrics are favoured by the ML algorithms. As illustrated in Exhibit 2, operating cash flows over assets measures such as Free Cash Flow to Book Value, and various net profit-based measures such as return on equity (ROE), as well as Gross Profit under the category of Profitability, are not only recognised as important features by ML model but also exhibiting attractiveness in the sense of positive score correlation with ML model forecast.
Exhibit 2: Quality Component’s Importance and Attractiveness
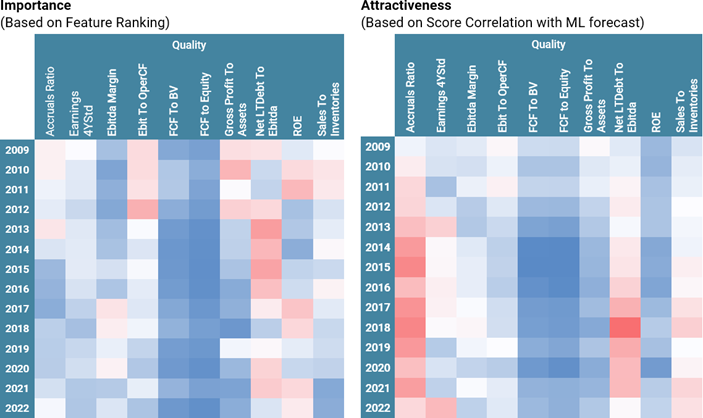
Source: Unigestion, S&P Capital IQ, and MSCI. For illustrative purposes only. Allocations are subject to change. The importance of single indicator is computed using the gain method of an ensemble model. Gain is the decrease in loss function accounting for all splits produced by a feature. Computation based on MSCI World universe on the period from 31.03.2009 to 31.10.2022. Colour scheme: Blue: high value, Red: low value
By knowing the cyclicality of the different factors and signals, investors could combine metrics to achieve a more consistent risk-return profile and better capture the Quality factor premium over the medium to long term. Using multiple metrics across multiple dimensions – and with various weighting schemes – would also provide a diversification benefit. While the correlation of returns to those metrics might be highly positive, they aren’t perfectly so over a certain period. We try to exploit this by using ML’s predictive power – handling a large amount of data, detecting non-linear relationships, discovering and learning patterns in various metrics, and subsequently constructing mathematical models to enable predictions on future data.
As illustrated in Exhibit 3A and 3B, we apply the dynamic weighting scheme using the ML algorithm, which aims to overweight the metrics favoured by the ML stock selection model and share more common ground with others and underweight (or even eliminate) the undesired ones. Across the four main spectrums, the Profitability category with its corresponding metrics clearly dominates the allocation of quality factor, while the Safety component was particularly important and attractive during the market turmoil period triggered by the COVID-19 outbreak. During the same volatile period, Stability also creeps in as part of the quality factor dimension.
Exhibit 3: ML Driven Allocations to Quality by Categories
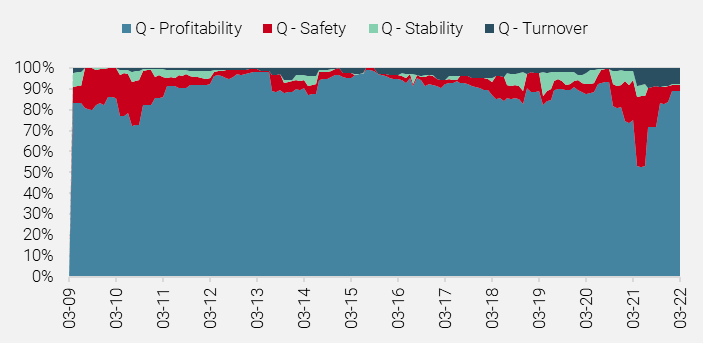
Source: Unigestion, S&P Capital IQ, and MSCI. The importance of single indicators is computed using the gain method of an ensemble model. Gain is the decrease in loss function accounting for all splits produced by a feature. Computation based on MSCI World universe on the period from 31.12.2009 to 31.10.2022.
Among individual metrics, various net profit-based measures such as return on equity (ROE), return on assets (ROA), and return on invested capital (ROIC) have been consistently favoured by ML, while Gross Profit to Assets has gradually started to be favoured by the ML output. This further justified Novy-Marx’s (2013) argument that gross profit is the cleanest accounting measure of true economic profitability, This is because the measure is relatively unaffected by accounting estimates for accruals and non-cash expenses such as depreciation and amortisation. Additionally, cash flow linked metrics such as Free Cash Flow to Equity, and FCF to Book Value have been also selected consistently, especially in recent periods when credit is expensive and difficult to acquire. Positive (and higher) free cash flow ratios indicate a company is generating more cash than it needs to run the business and can invest further in growth opportunities, which becomes more crucial during volatile periods.
Exhibit 3B – ML Driven Allocations to Quality Metrics
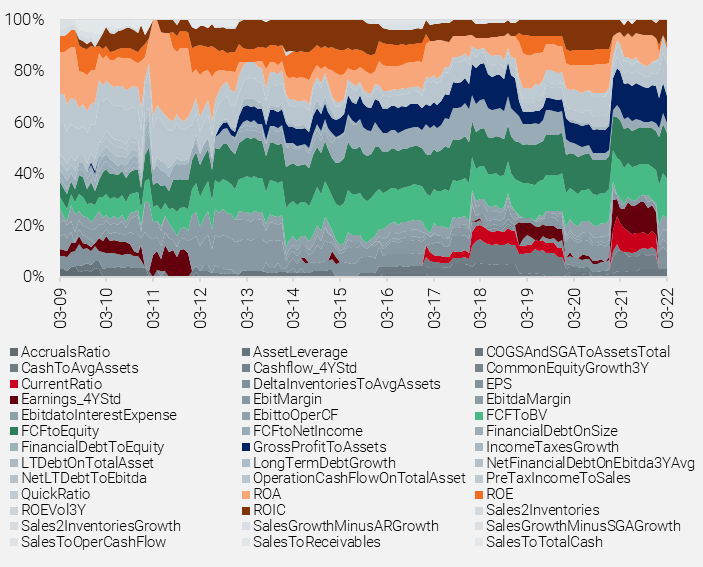
Source: Unigestion, S&P Capital IQ, and MSCI. The importance of single indicators is computed using the gain method of an ensemble model. Gain is the decrease in loss function accounting for all splits produced by a feature. Computation based on MSCI World universe on the period from 31.12.2009 to 31.10.2022.
Making a great factor better
By employing the dynamic weighting scheme using a machine learning algorithm, the ML Dynamic Quality composite has improved the Quality factor’s risk-adjusted performance, and reduced the maximum drawdown at a reasonable tracking error level and turnover. Specifically, the ML model helps the quality composite access the multi-dimensions of quality factor metrics, i.e. having incorporated the safety metrics, so that the ML Dynamic Quality composite offers better downside protection than the Profitability-only Quality, as shown in Exhibit 4. Furthermore, the dynamic nature of the ML model helps the composite construction process adapt to any market regime change or shock, and ultimately deliver higher risk-adjusted returns.
Exhibit 4: ML Weighted Qalue Factor Performance
| MSCI World TR Net | « Profitability » Quality* | « All Weather » Quality** | ML Dynamic Quality | |
| CAGR | 8.3% | 10.0% | 10.0% | 10.7% |
| Volatility | 15.2% | 16.1% | 17.0% | 16.2% |
| Max Drawdown | 34.0% | -33.3% | -37.1% | -32.4% |
| vs. MSCI | ||||
| Excess Return | 1.7% | 1.6% | 2.4% | |
| Tracking Error | 4.3% | 4.4% | 4.3% | |
| Information Ratio | 0.39 | 0.37 | 0.55 | |
| Beta | 1.02 | 1.08 | 1.03 | |
| Turnover p.a. | 80% | 86% | 109% |
* A mix of EBITDA Margin, ROA, ROE equally weighted
** A mix of Profitability (EBITDA Margin, ROA, ROE), Safety (Financial Debt on Size, LT Debt on Total Assets, Net LT Debt on EBITDA) and Stability (Cashflow 4-yr variance, Earnings 4-yr variance) equally weighted
Source: Unigestion, S&P Capital IQ, and MSCI. Computation based on MSCI World universe on the period from 31.12.2009 to 31.10.2022.
Looking forward, the market environment is likely to remain challenging and volatile. High inflation and low growth prospects, together with restrictive monetary policies,
is likely to result in increased dispersion within the equity market. This will lead to resilient returns in some areas of the equity market. The Quality factor offers defensiveness should the market downturn continue, and tends to outperform in
such an environment. This is particularly likely given the rare combination of soaring inflation, rising interest rates and geopolitical tensions that have historically been associated with bear markets, triggering a recession. It could continue for quite
some time.
[1] Graham, B. (1973). The Intelligent Investor (4th rev. ed.). Harpers & Row, New York.
[2] Sloan, R.G. (1996), Do Stock Prices Fully Reflect Information in Accruals and Cash Flows About Future Earnings?, Accounting Review, pp. 289-315.
[3] Greenblatt, J. (2010), The Little Book That Still Beats the Market, 29, John Wiley & Sons.
[4] Novy-Marx, R. (2013), The Other Side of Value: The Gross Profitability Premium, Journal of Financial Economics, 108(1), pp. 1-28.
[5] Xing, Y. (2008), Interpreting the Value Effect Through the Q-Theory: An Empirical Investigation, Review of Financial Studies, 21(4), pp. 1767-1795.
[6] Fama, E.F., and French, K.R. (2015), A Five-Factor Asset Pricing Model. Journal of Financial Economics, 116(1), pp. 1-22.
[7] Beaver, W.H. (1966), Financial Ratios as Predictors of Failure, Journal of Accounting Research, pp. 71-111.
[8] Asness, C.S., Frazzini, A. and Pedersen, L.H. (2019), Quality Minus Junk, Review of Accounting Studies, 24(1), pp. 34-112.
[9] Hsu, J., Kalesnik, V. and Kose, E. (2019), What is Quality?, Financial Analysts Journal, 75(2), pp. 44-61.
Important information
Past performance is no guide to the future, the value of investments, and the income from them change frequently, may fall as well as rise, there is no guarantee that your initial investment will be returned. This document has been prepared for your information only and must not be distributed, published, reproduced or disclosed by recipients to any other person. It is neither directed to, nor intended for distribution or use by, any person or entity who is a citizen or resident of, or domiciled or located in, any locality, state, country or jurisdiction where such distribution, publication, availability or use would be contrary to law or regulation.
This is a promotional statement of our investment philosophy and services only in relation to the subject matter of this presentation. It constitutes neither investment advice nor recommendation. This document represents no offer, solicitation or suggestion of suitability to subscribe in the investment vehicles to which it refers. Any such offer to sell or solicitation of an offer to purchase shall be made only by formal offering documents, which include, among others, a confidential offering memorandum, limited partnership agreement (if applicable), investment management agreement (if applicable), operating agreement (if applicable), and related subscription documents (if applicable). Please contact your professional adviser/consultant before making an investment decision.
Where possible we aim to disclose the material risks pertinent to this document, and as such these should be noted on the individual document pages. The views expressed in this document do not purport to be a complete description of the securities, markets and developments referred to in it. Reference to specific securities should not be considered a recommendation to buy or sell. Unigestion maintains the right to delete or modify information without prior notice. Unigestion has the ability in its sole discretion to change the strategies described herein.
Investors shall conduct their own analysis of the risks (including any legal, regulatory, tax or other consequences) associated with an investment and should seek independent professional advice. Some of the investment strategies described or alluded to herein may be construed as high risk and not readily realisable investments, which may experience substantial and sudden losses including total loss of investment. These are not suitable for all types of investors.
To the extent that this report contains statements about the future, such statements are forward-looking and subject to a number of risks and uncertainties, including, but not limited to, the impact of competitive products, market acceptance risks and other risks. Actual results could differ materially from those in the forward-looking statements. As such, forward looking statements should not be relied upon for future returns. Targeted returns reflect subjective determinations by Unigestion based on a variety of factors, including, among others, internal modeling, investment strategy, prior performance of similar products (if any), volatility measures, risk tolerance and market conditions. Targeted returns are not intended to be actual performance and should not be relied upon as an indication of actual or future performance.
No separate verification has been made as to the accuracy or completeness of the information herein. Data and graphical information herein are for information only and may have been derived from third party sources. Unigestion takes reasonable steps to verify, but does not guarantee, the accuracy and completeness of information from third party sources. As a result, no representation or warranty, expressed or implied, is or will be made by Unigestion in this respect and no responsibility or liability is or will be accepted. All information provided here is subject to change without notice. It should only be considered current as of the date of publication without regard to the date on which you may access the information. Rates of exchange may cause the value of investments to go up or down. An investment with Unigestion, like all investments, contains risks, including total loss for the investor.
Legal Entities Disseminating This Document
UNITED KINGDOM
This material is disseminated in the United Kingdom by Unigestion (UK) Ltd., which is authorized and regulated by the Financial Conduct Authority (« FCA »). This information is intended only for professional clients and eligible counterparties, as defined in MiFID directive and has therefore not been adapted to retail clients.
UNITED STATES
This material is disseminated in the United States by Unigestion (UK) Ltd., which is registered as an investment adviser with the U.S. Securities and Exchange Commission (“SEC”). All inquiries from investors present in the United States should be directed to Clients@unigestion.com at Unigestion (UK) Ltd. This information is intended only for institutional clients and qualified purchasers as defined by the SEC and has therefore not been adapted to retail clients.
EUROPEAN UNION
This material is disseminated in the European Union by Unigestion Asset Management (France) SA which is authorized and regulated by the French “Autorité des Marchés Financiers” (« AMF »).
This information is intended only for professional clients and eligible counterparties, as defined in the MiFID directive and has therefore not been adapted to retail clients.
CANADA
This material is disseminated in Canada by Unigestion Asset Management (Canada) Inc. which is registered as a portfolio manager and/or exempt market dealer in nine provinces across Canada and also as an investment fund manager in Ontario, Quebec and Newfoundland & Labrador. Its principal regulator is the Ontario Securities Commission (« OSC »). This material may also be distributed by Unigestion SA which has an international advisor exemption in Quebec, Saskatchewan and Ontario. Unigestion SA’s assets are situated outside of Canada and, as such, there may be difficulty enforcing legal rights against it.
SWITZERLAND
This material is disseminated in Switzerland by Unigestion SA which is authorized and regulated by the Swiss Financial Market Supervisory Authority (« FINMA »).
Document issued December 2022.