Gold in a policy normalisation phase
Over the last few years, the price of gold has traded in a very tight range, often disappointing investors and leading some to question its use in portfolios as a diversifier and to preserve wealth. Despite heightened geopolitical risks, the so-called ‘Goldilocks’ scenario we experienced last year (i.e. solid growth, low inflation and low interest rates), where risky assets thrive, meant gold lost some of its appeal and delivered mixed returns along the way. With monetary policy normalisation by several key central banks underway, rising inflation and heightened market stress, gold is becoming ‘hot’ again and drawing investors back in.
Will gold be a ‘free lunch’ over the next couple of years? We are doubtful, given current valuations. However, we believe gold will potentially offer great diversification properties as it will ultimately benefit from the changing monetary policy environment.
A couple of gold positives
After a long period of deflation, inflationary pressures are making their comeback. Looking at our World Inflation Nowcaster, which is a real-time synthetic measure that tracks inflation-surprise risk, there has been an impressive pick-up since mid-2016; and such risk currently remains elevated. Investors often associate the beginning of the ‘reflationary’ trade with Donald Trump’s election success.
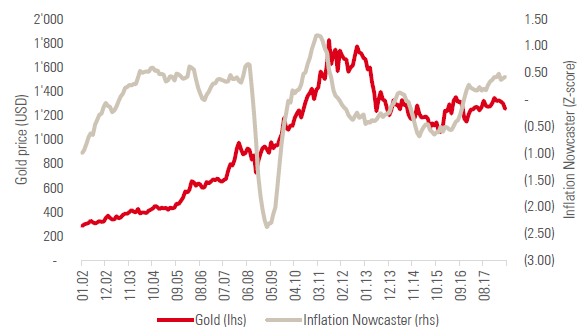
However, according to our own measures, inflationary pressures started back around the late summer period of the same year (see Chart 1). Inflation is much more visible now, with Consumer Price Index (CPI) figures reaching higher grounds and the pricing of inflation having been revised upwards considerably by the market. The ability to use gold as an inflation hedge is often questioned; however when plotted against our Inflation Nowcaster, we can see that gold played its part with a positive correlation between the two, as illustrated in Chart 1. What appears quite clearly on the chart is that both indicators had a tendency to increase sharply around the same periods, such as in 2006-2007 or in 2011. Now, the recent pick-up has not yet been followed by an equivalent surge and we discuss a couple of potential explanations in the next section.
Chart 1: Gold prices versus Unigestion’s Inflation Nowcaster
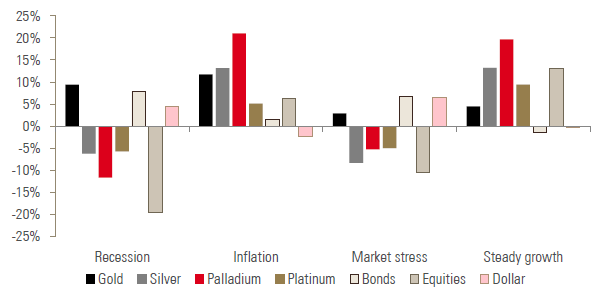
Going beyond this simple graph analysis, we examined the average performance of gold across four macro regimes: recession, inflation surprises, market stress and steady growth (see Chart 2). Looking back at the historical returns of gold between 1974 and 2017, gold delivered on average returns of 10% during periods of inflation, while during times of recession, gold returned the same performance as bonds. Whether one is worried about recession risk or inflation shock risk, based on our findings, gold seems to offer interesting hedging capabilities.
Chart 2: Average historical performance of assets and precious metals during four macro regimes (1974 to 2017)

It is well-known that emerging markets have a large appetite for gold, with India and China being the largest consumers in the world.

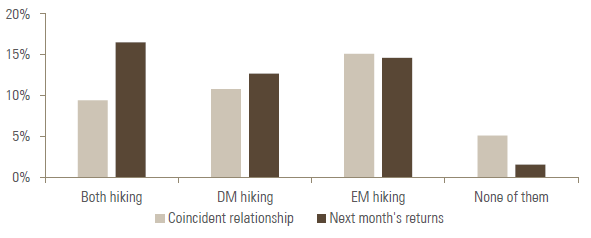
Inflationary pressures will comfort central banks in exiting their ultra-low level of monetary policy accommodation. The US Federal Reserve and Bank of Canada have started this process; other developed market central banks have made it clear that their next rate move will be up. With negative real rates still present in many countries, the risk of some central banks falling behind the curve is becoming a reality. If we look at the behaviour of gold during previous central bank tightening phases (as shown on Chart 3), it illustrates an interesting picture: the performance of gold over periods of rate hikes, both in developed markets (DM) and emerging markets (EM) is clearly much higher than over periods of no hikes. This relationship is true when considering returns and hikes in a coincidental way and when looking at the performance of gold the month that follows a hike. As such, hiking periods have been positive periods for gold and this is exactly where we think we are heading.
Chart 3: Annualised gold performance over interest rate hiking periods (emerging and developed countries)
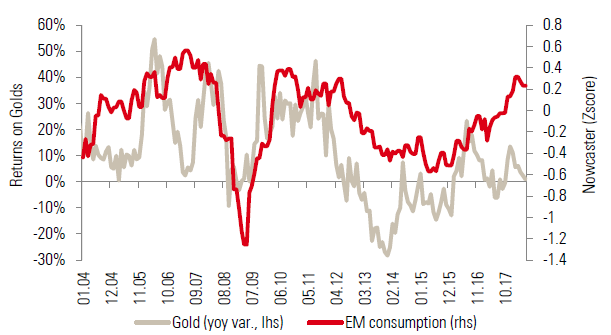
In our view, inflation and higher short-term rates are two supporting factors for gold over the medium term, but they are not the only ones. It is well-known that emerging markets have a large appetite for gold, with India and China being the largest consumers in the world. Emerging market demand is therefore important for the outlook of gold; this can be seen on Chart 4 by plotting the emerging market consumption component of our World Growth Nowcaster against gold returns. Currently, emerging market consumption is above potential, which could be interpreted as a possible positive catalyst for gold.
Chart 4: Returns on gold versus emerging market consumption
Investors’ interest in gold has risen in recent years, with total known exchange-traded funds of gold holdings rising 50% since their lows at the beginning of 2016.
The rising geopolitical instability has added a layer of risk to portfolio construction. Given the unpredictable nature of such events, hedging these has proven to be a difficult task. Gold, however, has helped as a useful diversifier against such events following increased demand for safe havens.
Investors’ interest in gold has risen in recent years, with total known exchange-traded funds of gold holdings rising 50% since their lows at the beginning of 2016. Gold futures-traded volumes have also been consistently rising over time, another indication that the demand for gold exposure is growing. Looking at the Commodity Futures Trading Commission (CFTC hereafter) weekly positioning report, gold is well below its historical highs, leaving room for long positions to build-up again. Monetary policy normalisation and heightened geopolitical risk should, in our view, result in higher volatility (or so-called market stress) for assets. Gold volatility is currently close to its historical lows, with three month implied volatility below 10%, making of it an affordable means of portfolio protection.
Risks to the outlook for gold
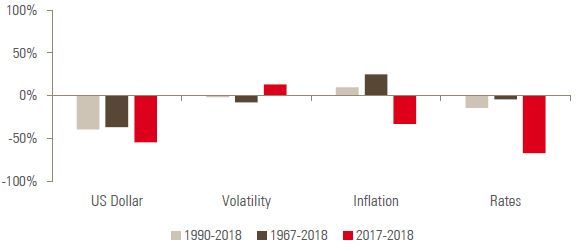
As illustrated in Chart 5, top-down factors have largely driven gold returns in recent years. The US dollar has played a particularly significant role and we expect its direction will influence the outlook for gold.
Chart 5: Historical betas of gold to macro factors over the 1999-2018 period
The US dollar rally we have been experiencing since April is acting as an important headwind. The widening gap between US yields and those of the rest of the developed world boosts demand for the dollar as carry is becoming attractive. In the meantime, looking at Chart 6, which represents the nominal GDP growth differential between the US and the eurozone, we see a clear outperformance of the US. If the European macro momentum continues to deteriorate while the US momentum remains firm, we could see the European Central Bank (ECB) delay its normalisation phase further. For now, however, the ECB has communicated that it views this as a temporary slowdown.
More importantly, we believe that one of the major risks to the gold story is its valuation: with inventories of gold remaining very high, valuation is a key element to consider when trying to anticipate the future of the price of gold.
Chart 6: Z-scored differential between nominal GDP growth between the US and the eurozone
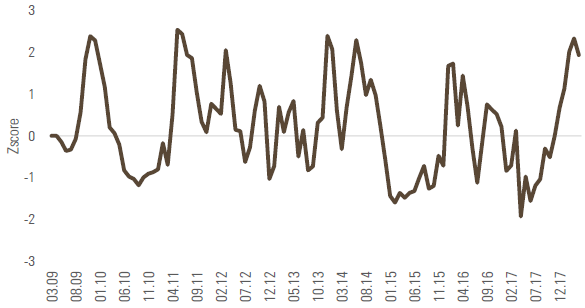
Reading note: this chart shows the difference between the nominal GDP growth in the US and in the eurozone. This differential has been z-scored, which means that it has been demeaned and divided by its standard deviation so as to make its extreme more visible. A reading above 2 and below -2 should be seen as an extreme level.
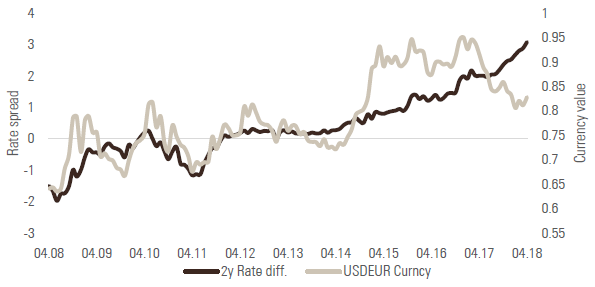
Chart 7 shows that the widening yield gap between 2-year rates and the Euro has reached new extremes. It remains to be seen in which way it converges, though the risk is that we see further US dollar appreciation.
More importantly, we believe that one of the major risks to the gold story is its valuation: with inventories of gold remaining very high, valuation is a key element to consider when trying to anticipate the future of the price of gold. In a famous article from 2013, Erb and Harvey[1] proposed a valuation metric for gold based on its theoretical connection to inflation: they theorised that the level of price of gold should somewhat be linearly related to the level of goods and services’ price indices. Chart 8 illustrates such a relationship that they named the “Golden constant”. From this perspective, gold is clearly over-valued. Furthermore, we believe that carry is another cross-asset reliable valuation metric. In the case of commodities, the roll yield is often used as a carry measure. Given the extremely contangoed future curve of gold, it also looks expensive: as for most markets, gold valuations are stretched and should be considered with caution.
Chart 7: USD/EUR versus 2-year rates differential
As for most markets, gold valuations are stretched and should be considered with caution.
Chart 8: Scatterplot of gold vs. US inflation as a valuation measure
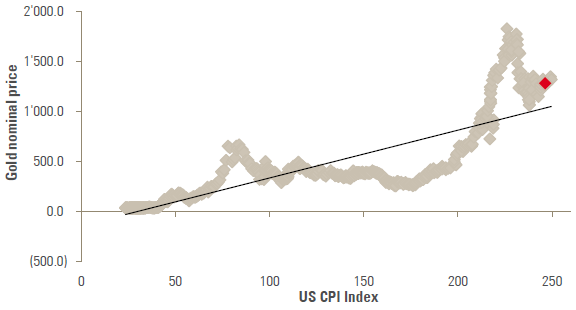
Reading note: this chart is a scatterplot between the US CPI index and the nominal price of gold. The black line is the trend implicit in the relationship between both series, estimated via a linear regression. The red diamond is the most recent point.
[1] Erb, C. B., & Harvey, C. R. (2013). The golden dilemma. Financial Analysts Journal, 69(4), 10-42.
Conclusion
In our view, two key macro factors are likely to drive gold over the coming months: the US dollar and the interest rates/inflation picture. This is good news for investors willing to sail the monetary policy normalisation phase that we foresee. We still have a tactical interest in the yellow metal, but we are also very aware that gold looks expensive from various perspectives and should, therefore, exhibit more limited reactions to inflation than in the past.
Important Information
The information and data presented in this page may discuss general market activity or industry trends but is not intended to be relied upon as a forecast, research or investment advice. It is not a financial promotion and represents no offer, solicitation or recommendation of any kind, to invest in the strategies or in the investment vehicles it refers to. Some of the investment strategies described or alluded to herein may be construed as high risk and not readily realisable investments, which may experience substantial and sudden losses including total loss of investment.
The investment views, economic and market opinions or analysis expressed in this page present Unigestion’s judgement as at the date of publication without regard to the date on which you may access the information. There is no guarantee that these views and opinions expressed will be correct nor do they purport to be a complete description of the securities, markets and developments referred to in it. All information provided here is subject to change without notice. To the extent that this page contains statements about the future, such statements are forward-looking and subject to a number of risks and uncertainties, including, but not limited to, the impact of competitive products, market acceptance risks and other risks.
Data and graphical information herein are for information only and may have been derived from third party sources. Although we believe that the information obtained from public and third party sources to be reliable, we have not independently verified it and we therefore cannot guarantee its accuracy or completeness. As a result, no representation or warranty, expressed or implied, is or will be made by Unigestion in this respect and no responsibility or liability is or will be accepted. Unless otherwise stated, source is Unigestion.
Past performance is not a guide to future performance. All investments contain risks, including total loss for the investor.