- A resilient equity portfolio is a good way to harness economic growth by capturing the real economic contribution from underlying industries and stocks.
- Investors should focus on long-term growth and stability. Low-risk stocks often have less uncertain earnings and are thus less likely to disappoint. Investors need to broaden the sources of growth across countries, industries and companies.
- Low volatility strategies have a history of being able to adapt to new environments once the dust has settled after big disruptions. Volatility can be mitigated by introducing an explicit balance between total risk reduction and active risk control based on macroeconomic and valuation conditions.

It was the best of times, it was the worst of times, it was the age of wisdom, it was the age of foolishness, it was the epoch of belief, it was the epoch of incredulity, it was the season of Light, it was the season of Darkness, it was the spring of hope, it was the winter of despair.

Introduction
2020 was a very turbulent year for equity investors. The global pandemic and the resulting lockdown triggered a sudden collapse in economic activity that prompted elevated volatility levels and wild swings in global equity markets. In the first quarter, stocks fell at unprecedented speed, registering the fastest 30% drawdown in history, and there were violent market swings after this initial crash. However, by the end of the year, the MSCI All World index had not only erased all of its Covid-19 losses, it had gone on to hit a new high, supported by massive stimulus plans from central banks and governments around the world. The fact that the index finished the year 16% higher is impressive, but the real surprise lies in the fact that it finished up more than 70% from its March trough. However, while the recovery, which is still ongoing, has been remarkable, it has also been very uneven, with excitement only for a small group of mega technology-related winners.
In light of how things currently stand, we think investors need to revisit their portfolio exposures to ensure their allocations have the right balance of risks. The purpose of this paper is to assess how to get exposure to stable and more sustainable long-term returns by participating in the long-lasting economic growth factors in a given region. Equally, it is important not to focus on short-lived fads, where performance is primarily driven by speculation rather than fundamentals.
The Disconnection Between Frothy Markets and a Virus-Ravaged Global Economy
Sector and style performances in 2020 reflected the impact of the pandemic. Technology stocks surged, with the Covid-19 situation amplifying the demand for technology and related services. The outbreak has also increased the need for online shopping, distance learning and home working, which means that broadband, video conferencing, streaming, games and e-commerce are now essential services. Investors were drawn to high-growth names such as the FAAMGs (Facebook, Amazon, Apple, Microsoft and Alphabet’s Google), partly because growth elsewhere was very inadequate. Meanwhile, in other industries such as retail and leisure, long-established business models have been upended.
The level of concentration in the equity market has continued to rise given the mega tech giants led the market rally. The top five stocks (FAAMG) comprised ~24% of the S&P 500 index in August 2020, up from 19% in January 2020. In December, the addition of Tesla, the largest market-cap stock to have ever entered the S&P 500, further increased the index’s concentration. Similarly, in emerging markets, Tencent Holdings and Alibaba Group together account for almost 14% of the MSCI Emerging Markets index today compared to only 4% in 2015.
Fuelled by the current market concentration in a handful of high growth bets, the stock market has never been as expensive as it is today.
Fuelled by the current market concentration in a handful of high growth bets, the stock market has never been as expensive as it is today. Amid deteriorating fundamentals, it is largely being supported by the massive monetary stimulus from key central banks. Taking the US as an example and using the Wilshire 5000 Total Market Full Cap Index as a measure, the whole US equity market was worth about USD 34.5tn at the end of Q3 2020, while a forward-looking estimate suggests that US GDP rebounded to USD 21.2tn. The stock market’s valuation was therefore well above the size of the economy – more precisely 163% of the latter, which raises legitimate concerns of a market bubble phenomenon.
Figure 1: US Total Market Capitalisation Relative to GDP
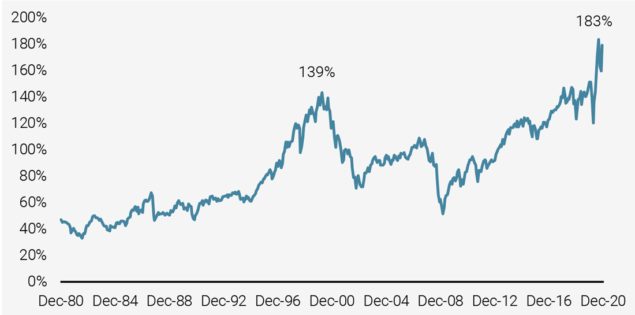
Source: Unigestion, Bloomberg. Data as at December 2020.
These extreme market concentrations are indicative of growing economic imbalances and may lead investors to further consider how much these big names truly represent in terms of economic contribution to the global economy versus their market capitalisation.
Navigating an Unprecedented Era of Equity Market Distortion
To assess a company’s economic contribution, an investor can look at its Value Added, the difference between the value of a business’s output (sales) and inputs (its purchases of goods and services from other businesses). A company’s Value Added is a disbursement to equity holders, debt holders, employees and the government in the forms of dividends paid to the firm’s equity holders, principal and coupon interest paid to the firm’s debt holders, gross salaries paid to the firm’s employees and taxes paid by the firm1. When assessing each company in proportion to its economic contribution, an investor would see that Walmart holds more weight than the FAAMG’s in the US market2. As illustrated in Figure 2, there can be large disconnects between a company’s market capitalisation and its economic contribution. Figure 3 illustrates this phenomenon at the sector level.
Allocating stock and sector exposures based on the Value Added concept leads to a very different overall allocation where the heavy concentrations in the capweighted methodology are no longer justified.
Allocating stock and sector exposures based on underlying economic contribution (the Value Added concept) rather than market cap leads to a very different overall allocation where the heavy concentrations in the cap-weighted methodology are no longer justified. This perspective particularly illustrates the concentration issue at hand in this discussion.
Figure 2: Disconnect Between a Company’s Share Price and Economic Output
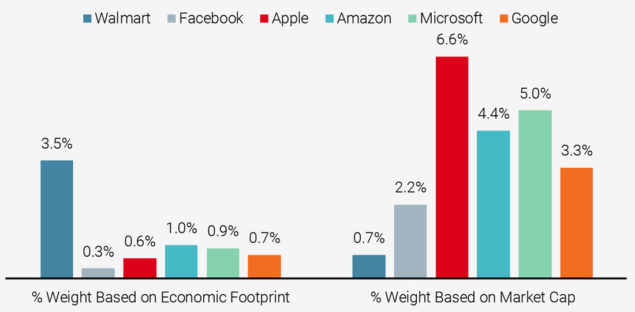
Source: Unigestion, Bloomberg. Data as at December 2020.
Figure 3: Sector’s Proportion (%) by Economic Contribution and Market Cap
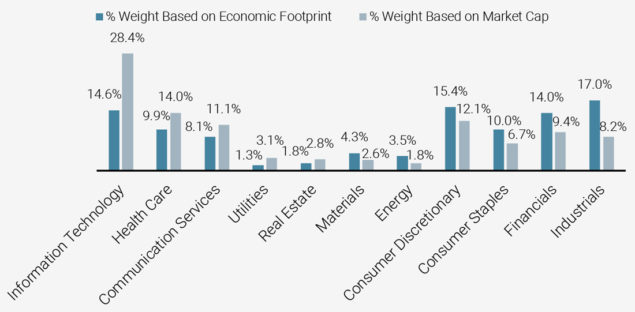
Source: Unigestion, Bloomberg. Data as at December 2020.
Looking at our risk-managed equity strategies, our low volatility portfolios are exposed to the companies and sectors that have a higher proportion to their economic footprint, such as Consumer Staples, Consumer Discretionary and Industrials, as shown in Figure 4 for our Global Equity strategy.
Figure 4: Risk-Managed Global Equity Strategy – Rolling Sector Breakdown
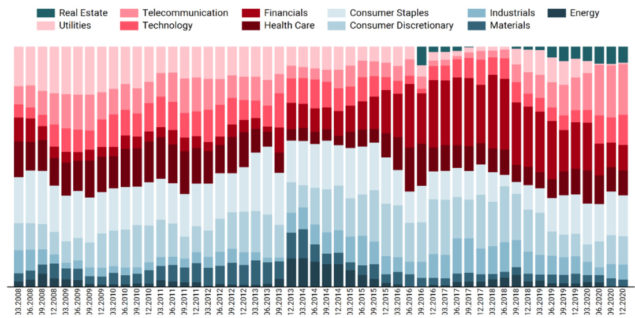
Source: Unigestion, Bloomberg. Data as at December 2020.
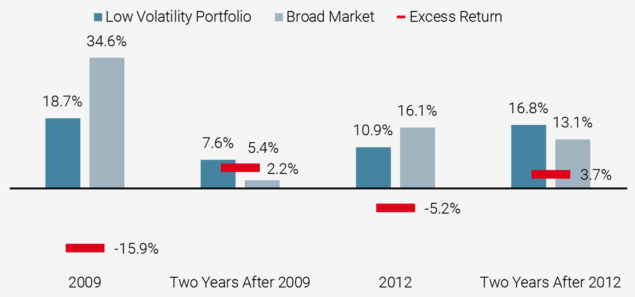
This way, the portfolios avoid systematically overweighting overpriced stocks, such as technology names that distort with their economic size and contributions. By doing so, they deliver long-term equity risk premia with exposures that make a positive contribution to economic growth. In particular, it helps the portfolios to recover following bouts of underperformance when the market has been driven by episodes of irrational speculative activity. As Figure 5 shows, 2009 and 2012 are good examples of this in the case of our Global Equity strategy.
Our allocations, which exhibit more economic contributions, can help portfolios recover following bouts of underperformance driven by irrational and speculative market activity.
Figure 5: Performance of Risk-Managed Global Equity Strategy
Source: Unigestion, Bloomberg.
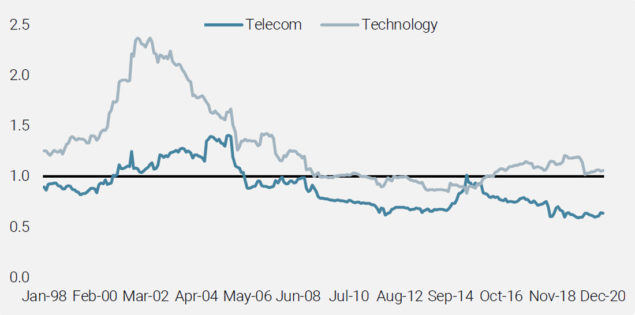
The low volatility style is gradually recognising the disruption in growth sources. The current leaders will become potential low volatility stocks once the disruption is well established and the volatility of leaders diminishes. Currently, mega tech stocks are leading the way. However, with a Joe Biden presidency and a blue Senate, they potentially face increased scrutiny from heightened regulation over the monopolistic power of the sector and their use of users’ personal data. As well as their relatively low economic footprint and high valuations, investors may also want to evaluate the regulatory risk premium associated with the tech giants. As we can see in Figure 6, before telecom stocks transitioned into the stable, safe haven candidates they are today, the telecommunications industry experienced a cycle of boom and bust between the late 1990s and early 2000s.
With tech giants’ relatively low economic footprint and high valuations, investors should also consider the regulatory risk premium associated with these companies.
Figure 6: Technology and Telecom’s Beta Journey
Source: Unigestion, Bloomberg. Data as at December 2020.
Accessing growth through a diversified geographical exposure is also crucial to investors given the geopolitical risks and the dispersed regional valuations. Taking emerging markets as an example, the MSCI Emerging Markets index enjoyed a rise of more than 18% in 2020, having surged by more than 73% from its March trough, supported by a weakening US dollar, more economic stimulus and the positive vaccine news. China, whose 40% weighting makes it the largest constituent in the index, was one of the best-performing markets last year. As result, our model guides us to dial up our exposure to China given it had a more resilient performance than many other emerging markets during the pandemic. This performance also improved the relative volatility of Chinese stocks and should help our risk minimisation process. Subsequently, the move will provide more diversification to our strategies as well as opportunity sets to better capture growth opportunities in the region, ultimately improving the upside potential.
Defensive’s Resilience in Earnings: Growth from a Bottom-up Standpoint
As forecasting corporate earnings is probably one of the hardest things in finance, investors should focus on long-term growth and stability rather than hoping for highly speculative earnings surprises. Capturing growth does not necessarily imply the need to overly skew expensive or crowded positions. After the astonishing rally driven by growth stocks last summer, equity investors took the positive trial results from Pfizer and BioNTech, and then from Moderna and Oxford University/AstraZeneca, as optimistic signs that a return to normal economic activity could be imminent. In November, investors began to switch from Covid-19 winners, such as Technology names, into « old economy » Industrial companies. Energy stocks, which had suffered for most of 2020 as a result of the pandemic reducing demand for oil, rebounded strongly, followed by Financials. Airline stocks also surged on the triple dose of upbeat vaccine news.
Investors should focus on long-term growth and stability rather than hoping for highly speculative earnings surprises.
However, without earnings stabilising and becoming less unpredictable, the resurgence could be short-lived. Historically, the resilient performance of cyclical stocks has emerged when earnings consensus was broadly aligned with actuals. Similarly, Momentum was an especially strong performing equity factor across markets in 2020. However, as Figure 7 shows, it is also quite volatile. Looking at historical performance, to ride a Momentum wave potentially sets investors up for a painful crash if the current trends revert. Indeed, in Q4 2020, global stocks with the highest momentum underperformed significantly.
Figure 7: Momentum: The Bumpy Ride of High Flying Stocks
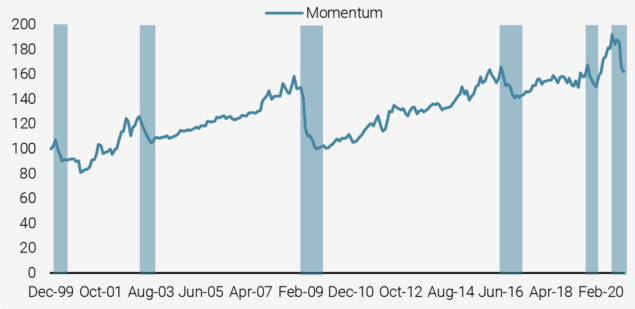
Source: Unigestion, Bloomberg. Data as at December 2020.
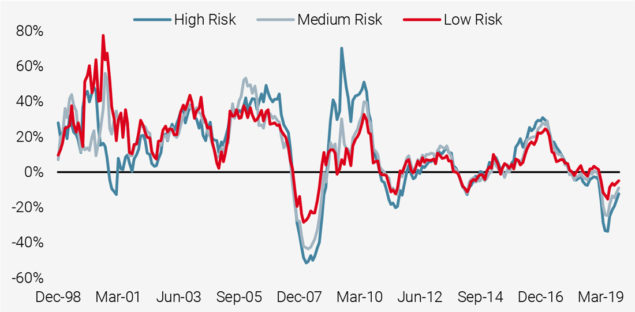
Focusing on low-risk stocks, they often have less uncertain earnings and are thus less likely to disappoint. Conversely, stocks with higher volatility tend to publish more disappointing earnings growth, especially at times when the market is struggling, as shown in Figure 8. For long-term investing, stability of earnings growth is the key to success.
Low-risk stocks often have less uncertain earnings and are thus less likely to disappoint.
Figure 8: Average Realised Earnings Growth vs Risk Categories
Source: Unigestion, Bloomberg. Data as at December 2020.
The mega tech giants are not the only companies that provide access to growth and investors need to broaden the sources of growth across countries, industries and companies. There are many companies that exhibit the potential to grow long-term earnings. Moreover, as the examples in Figure 9 show, they are characterised with fair valuations, good quality and the ability to adapt to a changing world.
Investors need to broaden the sources of growth across countries, industries and companies.
Figure 9: Technology Giants Are Not the Only Growth Story
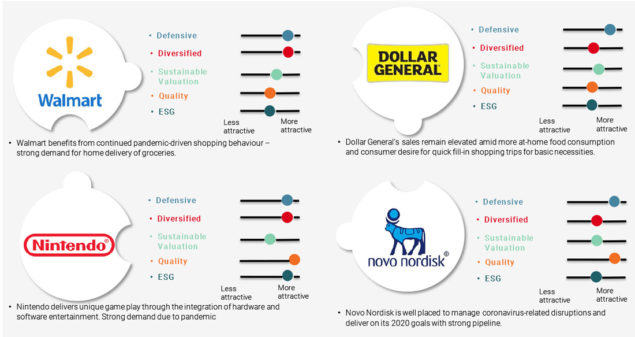
Source: Unigestion, Bloomberg. Data as at December 2020. Reference to specific securities should not be construed as a recommendation to buy or sell these securities and is included for the purposes of illustration only.
2021 and Beyond: Riding the Macro Cycles
The impact of unprecedented levels of monetary and fiscal stimulus together with the structural changes to how we live and work, which were accelerated by the Covid-19 crisis, will make the world a different place. Investors may question the ability of low volatility stocks to recover their losses relative to the markets. However, low volatility strategies have a history of being able to adapt to new environments once the dust has settled after big disruptions. As the new risk hierarchy is now more clearly established, we expect that the auto-adaptive characteristic of low volatility investing will ultimately prevail.
Low volatility strategies have a history of being able to adapt to new environments once the dust has settled after big disruptions.
When looking at the excess return of a low volatility strategy (the grey line in Figure 10) relative to the market over a long period of time, its underperformance has historically been followed by mean reversal phases as the speculation around the recovery of riskier companies is usually short-lived as their weaknesses become evident as positive news flow progressively vanishes. The post-Covid world should not be an exception, as investors’ behavioural biases did not disappear with the virus.
Figure 10: Cyclicality of Low Volatility Stocks
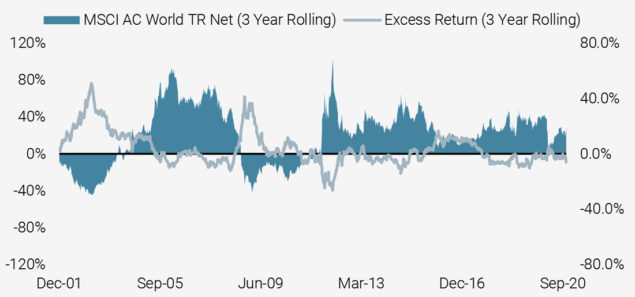
Source: Unigestion, Bloomberg. Data as at December 2020.
Low volatility strategies have a proven track record of delivering long-term alpha as can be seen in the annualised quintile spread (bps) of the low volatility quintile portfolio versus the high volatility quintile portfolio. However, they can also suffer periods of underperformance (highlighted by the blue areas in Figure 11) with significant active risk, particularly in a risk-on market when the macro environment is improving or very accommodative.
Figure 11: Long Term Low Risk Premium
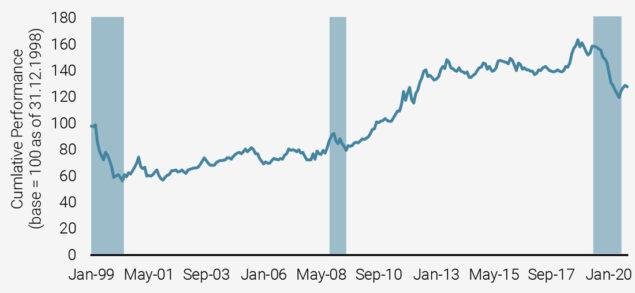
Source: Unigestion. Data as at December 2020.
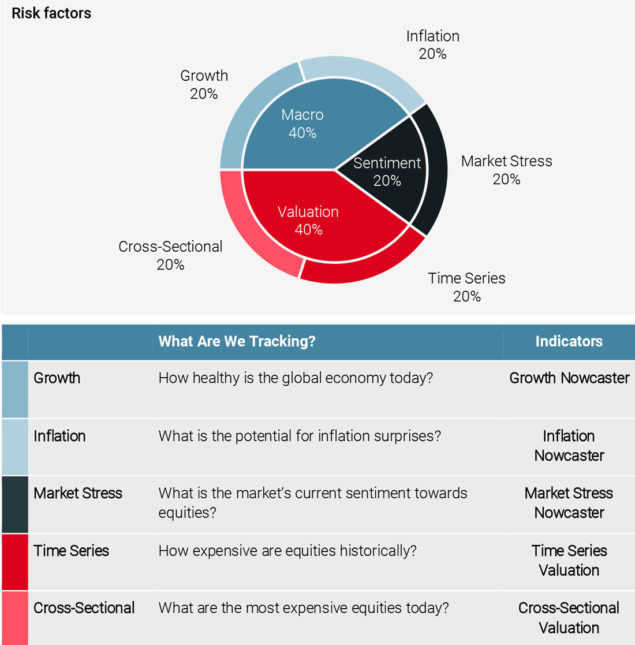
To mitigate the cyclicality, we could broaden the sources of volatility mitigation by introducing an explicit balance between total risk reduction and active risk control based on macroeconomic and valuation conditions. Using the latest nowcasting techniques and models, we build robust indicators (“Nowcasters”) to evaluate where we currently stand in terms of Growth, Inflation and Market Stress (the details are available on request). Based on the level of these proprietary Nowcasters, their rate of change and the market valuation metrics, we can further determine whether we are at high or low risk of experiencing a recession, an inflation shock, an episode of market stress, or whether there is a “steady growth” environment that prevails.
Volatility can be mitigated by introducing an explicit balance between total risk reduction and active risk control based on macroeconomic and valuation conditions.
Figure 12: Improved Return with Stable Risk Reduction
Source: Unigestion. Data as at February 2021.
Furthermore, we integrate these macroeconomic signals into our systematic investment process to dynamically balance the absolute risk management objective of the strategies with the need to control for active risk. In other words, dynamically tilting the portfolio between full defensiveness (risk-off) and adaptive (risk-on).
The Growth Opportunity of the Century: Resilience Won’t Be Achieved Without Serious ESG Integration
As climate risks increase worldwide, we are seeing governments responding in the form of regulation (e.g. the recent guidance on the EU climate transition benchmark and EU Paris Aligned Benchmark), carbon taxes and public investment, as well as shifts in consumer sentiment and business models. The transition away from fossil fuels (stranded assets) toward more sustainable and clean energy could transform the global economy and create significant investment opportunities.
Decarbonisation is only the start of the journey. Integrating carbon constraints allows us to significantly reduce carbon risk exposure as measured by carbon intensity. However, this straightforward approach to transition risk makes a number of implicit assumptions, such as all companies effectively pay the same carbon price. This has led us to evaluate our strategies’ levels of alignment with global climate goals based on a transition pathway approach in which the rate of decarbonisation of each holding is assessed against rates required to achieve 2°C or below of warming.
Figure 13: Improved Return with Stable Risk Reduction
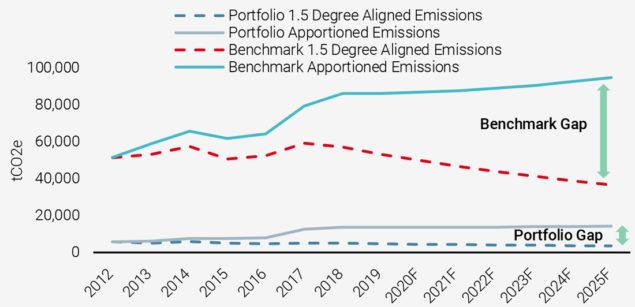
Source: Unigestion. Data as at December 2020.
Given the climate risk dimension also directly aligns with global climate-focused initiatives like the UN’s Sustainable Development Goals (SDGs), we could also potentially target transition opportunities by focusing (tilting) on specific areas such as green technologies or renewable energies. As such, the strategies would make significant contributions to SDG 7 (affordable and clean energy).
Conclusion
A resilient equity portfolio is a good way to harness economic growth by capturing the real economic contribution from underlying industries and stocks, which often have less earnings variability. And these “boring”, but profitable and stable firms with solid fundamentals and adaptive business models will survive during these uncertain times. For a global portfolio, accessing growth through a diversified geographical exposure can also reduce country-specific risk and allow portfolios to harness the economic growth and innovation which is occurring worldwide. Low volatility allocations can help capture the growth potential of equity markets while smoothing the return pattern, particularly during periods of uncertainty.
A resilient equity portfolio is a good way to harness economic growth by capturing the real economic contribution from underlying industries and stocks.
However, it is vital to make sure that a resilient portfolio is constructed in such a way as to cushion an allocation from the unique challenges we are facing in 2021 and beyond. As sources of risk continue to grow and become increasingly diverse, managing risk has become much more challenging, growing in complexity year after year. Therefore, to effectively manage long-term risk, active investors need to take calculated risks and fortify low volatility portfolios with a holistic approach to risk, encompassing fundamental quality control, better ESG characteristics, avoidance of valuation extremes and diversified style exposures. Alternative and big data sets can help investors identify and address hidden (non-linear and clustered) risks as well as assist in navigating different macro regimes.
1The Value Added of a firm is also equal to its contribution to the Gross National Product of the country it belongs to.
2Source Bloomberg (HSBNOAI LX). Data as at November 2020.
Important Information
Past performance is no guide to the future, the value of investments, and the income from them change frequently, may fall as well as rise, there is no guarantee that your initial investment will be returned. This document has been prepared for your information only and must not be distributed, published, reproduced or disclosed by recipients to any other person. It is neither directed to, nor intended for distribution or use by, any person or entity who is a citizen or resident of, or domiciled or located in, any locality, state, country or jurisdiction where such distribution, publication, availability or use would be contrary to law or regulation.
This is a promotional statement of our investment philosophy and services only in relation to the subject matter of this presentation. It constitutes neither investment advice nor recommendation. This document represents no offer, solicitation or suggestion of suitability to subscribe in the investment vehicles to which it refers. Any such offer to sell or solicitation of an offer to purchase shall be made only by formal offering documents, which include, among others, a confidential offering memorandum, limited partnership agreement (if applicable), investment management agreement (if applicable), operating agreement (if applicable), and related subscription documents (if applicable). Please contact your professional adviser/consultant before making an investment decision.
Where possible we aim to disclose the material risks pertinent to this document, and as such these should be noted on the individual document pages. The views expressed in this document do not purport to be a complete description of the securities, markets and developments referred to in it. Reference to specific securities should not be considered a recommendation to buy or sell. Unigestion maintains the right to delete or modify information without prior notice. Unigestion has the ability in its sole discretion to change the strategies described herein.
Investors shall conduct their own analysis of the risks (including any legal, regulatory, tax or other consequences) associated with an investment and should seek independent professional advice. Some of the investment strategies described or alluded to herein may be construed as high risk and not readily realisable investments, which may experience substantial and sudden losses including total loss of investment. These are not suitable for all types of investors.
To the extent that this report contains statements about the future, such statements are forward-looking and subject to a number of risks and uncertainties, including, but not limited to, the impact of competitive products, market acceptance risks and other risks. Actual results could differ materially from those in the forward-looking statements. As such, forward looking statements should not be relied upon for future returns. Targeted returns reflect subjective determinations by Unigestion based on a variety of factors, including, among others, internal modeling, investment strategy, prior performance of similar products (if any), volatility measures, risk tolerance and market conditions. Targeted returns are not intended to be actual performance and should not be relied upon as an indication of actual or future performance.
No separate verification has been made as to the accuracy or completeness of the information herein. Data and graphical information herein are for information only and may have been derived from third party sources. Unigestion takes reasonable steps to verify, but does not guarantee, the accuracy and completeness of information from third party sources. As a result, no representation or warranty, expressed or implied, is or will be made by Unigestion in this respect and no responsibility or liability is or will be accepted. All information provided here is subject to change without notice. It should only be considered current as of the date of publication without regard to the date on which you may access the information. Rates of exchange may cause the value of investments to go up or down. An investment with Unigestion, like all investments, contains risks, including total loss for the investor.
Legal Entities Disseminating This Document
UNITED KINGDOM
This material is disseminated in the United Kingdom by Unigestion (UK) Ltd., which is authorized and regulated by the Financial Conduct Authority (« FCA »). This information is intended only for professional clients and eligible counterparties, as defined in MiFID directive and has therefore not been adapted to retail clients.
UNITED STATES
This material is disseminated in the U.S. by Unigestion (UK) Ltd., which is registered as an investment adviser with the U.S. Securities and Exchange Commission (“SEC”). This information is intended only for institutional clients and qualified purchasers as defined by the SEC and has therefore not been adapted to retail clients.
EUROPEAN UNION
This material is disseminated in the European Union by Unigestion Asset Management (France) SA which is authorized and regulated by the French “Autorité des Marchés Financiers” (« AMF »).
This information is intended only for professional clients and eligible counterparties, as defined in the MiFID directive and has therefore not been adapted to retail clients.
CANADA
This material is disseminated in Canada by Unigestion Asset Management (Canada) Inc. which is registered as a portfolio manager and/or exempt market dealer in nine provinces across Canada and also as an investment fund manager in Ontario, Quebec and Newfoundland & Labrador. Its principal regulator is the Ontario Securities Commission (« OSC »). This material may also be distributed by Unigestion SA which has an international advisor exemption in Quebec, Saskatchewan and Ontario. Unigestion SA’s assets are situated outside of Canada and, as such, there may be difficulty enforcing legal rights against it.
SWITZERLAND
This material is disseminated in Switzerland by Unigestion SA which is authorized and regulated by the Swiss Financial Market Supervisory Authority (« FINMA »).
Document issued February 2021.