Inflation Strikes Back: Should Alternative Risk Premia Investors Care?
As inflation soars to levels not seen in the past thirty years, what does this mean for alternative risk premia (ARP) investors? In this paper, we add to the sparse literature on inflation impacts on ARP by expanding the universe of ARP analysed. We observe outperformance by carry strategies and Equity Momentum in inflationary times, whereas mean-reverting macro directional strategies and Equity Low Risk seem to underperform. Meanwhile, we observe more muted impacts for other ARP. For a well-diversified ARP portfolio, the performance dispersion results in an overall subdued difference in performance between inflationary and non-inflationary periods, suggesting that inflation shocks should be seen more as a relative risk/opportunity than an absolute one for these liquid alternative strategies.
Introduction
Inflation has moved to the fore of investors’ minds this year, as strong demand hitting labour and supply issues has pushed price growth to the highest levels in thirty years. Structural and secular dynamics should help contain inflation in the long-term, but its significant impact – on the macroeconomy, monetary policy, and asset performance – implies that even a short-term inflation shock should be taken seriously. Indeed, our proprietary indicators tracking global inflation pressures – the Inflation Nowcaster, which assess traditional inflation data, and the Inflation Newscaster, which uses alternative data to assess media reporting on inflation – shifted into a high inflationary regime at the end of last year. Figure 1 shows the evolution of these indicators since the beginning of 2020 and how they have both been in elevated territory this year. It is important to note that the Newscaster, by construction, is a fast-moving indicator, and thus its relatively higher volatility, especially at turning points, is to be expected.
Figure 1: Unigestion Inflation Indicators
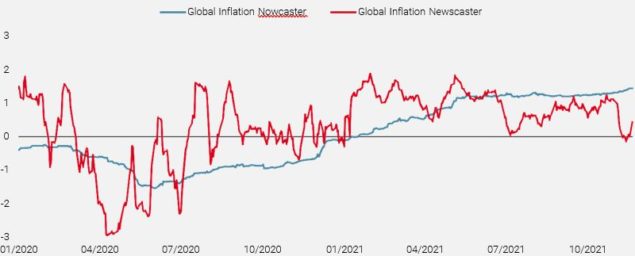
Source: Bloomberg, RavenPack, Unigestion, as of 22.11.2021
While the performance of traditional risk premia such as duration, equities, and commodities are reasonably well-understood during inflationary periods, the behaviour of alternative risk premia is less well known. Indeed, most market participants in these strategies have not had the experience of investing during inflationary periods and allocations to alternative risk premia have grown over the last few decades when global disinflationary forces reigned supreme.
Relying on our macro risk-based framework1, this paper examines the expected performance of alternative risk premia (ARP) in such periods. While there is quite a lot of literature on the implications of inflation on traditional assets (equities, bonds, commodities, real estate), whose findings are summarised in Podkaminer et al. (2021) or Neuville et al. (2021), we contribute to the sparse literature on the implications of inflation for factor investing / ARP. In particular, we expand the universe of ARP considered into mean-reversion macro directional strategies (including FX Value and Equity Index Value) and carry strategies across key asset classes.
Key Findings
Overall, we observe outperformance by carry strategies in inflationary times whereas mean-reverting macro directional strategies seem to underperform. The underperformance of Equity Low Risk and outperformance of Equity Momentum during inflationary periods is also notable and confirms previous literature. Meanwhile, we observe more muted impacts for other ARP. For a well- diversified ARP portfolio, the performance dispersion results in an overall subdued difference in performance between inflationary and non-inflationary periods, suggesting that inflation shocks should be seen more as a relative risk/opportunity than an absolute one for these liquid alternative strategies.
Identifying Inflationary Regimes
Asset prices adjust to reflect investors’ changing expectations in response to new information. Hence, while inflation on its own is an interesting concept for economists, it is primarily relevant to investors when compared to inflation expectations. In other words, it is not the level of inflation that matters as much as how it compares to expectations of the level. Indeed, expected inflation is already incorporated in the rate of return of all assets or strategies, through its implication on the level of short-term bond yields (and hence the discount factor of the cash-flows of any investment). Thus any framework to identify inflationary regimes for the purpose of making investment decisions should examine realised versus expected inflation. We have adopted a straightforward approach to determine an inflation surprise proxy going back to 1970. As inflation expectations surveys or inflation-linked bond yields are not available on a global basis over such a long period, we assume sticky expectations and accordingly measure expected inflation as one-year lagged realised inflation. We further insist that inflation shock periods – when realised inflation outstrips the expected inflation proxy – occur outside recessions to ensure these periods are purely inflationary (for more details on the regime dating methodology; see Baig et al., 2019).
Figure 2 shows the inflation surprise indicator, along with the months labelled as inflationary by it. We note that sustained inflationary periods are often followed by a recession and collapse in inflation, as shown by the circled regions (the mid-1970s following the OPEC oil embargo, early and late 1980s, and 2008). It is also important to note the strong period of sustained inflationary pressures in late 2009 into 2010 on the back of the GFC recovery, which did not trigger a recession as monetary policy remained easy to promote a recovery and deal with the Eurozone sovereign debt crisis. More recently, this simple inflation surprise indicator also points out that we have entered an inflationary shock, aligning with our Inflation Nowcaster and Newscaster.
All in all, we observe that most inflationary shocks happened before 1990, i.e., before liquid alternative strategies became more prevalent. Thus, we caution against deriving strong conclusions from these periods, all the more if they are not supported by a proper fundamental rationale.
Figure 2: Historical Occurrence of Inflationary Regimes
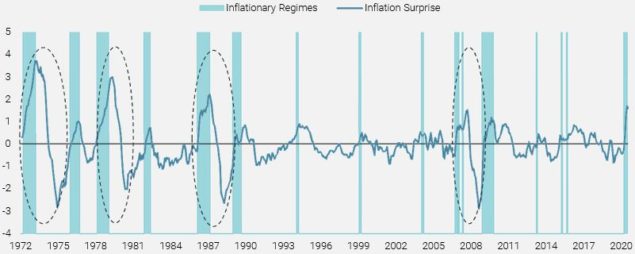
Source: Bloomberg, OECD, Unigestion calculations. Data from 1972- June 2021.
Alternative Risk Premia Performance in Inflationary Regimes
We begin by considering a broad suite of ARP most commonly seen across investors’ investment universe, categorized into three main families:
- Equity Factors: long-short positions are applied to single stocks from the global stock universe;
- Macro Directional: includes cross-asset trend following, foreign exchange (FX) value and equity index value;
- Alternative Income: carry strategies across rates, currencies, commodities, equity volatility and credit
The list of ARP, their construction, and the respective sample periods are described in Appendix 1. With the exception of Emerging Markets (EM) FX Carry, Volatility Carry, Equity Index Value and Credit Curve Carry, all ARP runs from January 1990 to June 2021.
One of the potential shortcomings of our analysis is the fact that the historical sample (1990-2021) is limited to a period with few inflation shocks. The limit is due to the lack of availability of data for some ARP. However, we show in Appendix 2 our results are robust when working with a longer history (starting in 1974).
In Tables 1-3 below, we assess the implications of inflation for average returns, Sharpe ratios and hit ratios (percentage of positive returns), respectively. While average returns, as displayed in Table 1, are what investors most care about, the comparison across ARP or periods can be biased by differences in realised risk (even though the various ARP are constructed to target the same ex- ante level of risk over time). Sharpe ratios, as reported in Table 2, will account for such variability of risk. Finally, the hit ratios, displayed in Table 3, will be insensitive to potential outlier observations and quantify the consistency of performance. Through colours, we highlight the ARP most handicapped (red) or helped (green) by inflation or its absence compared to full period performance2.
Table 1: Annualised returns of ARPs in inflationary versus non-inflationary regimes
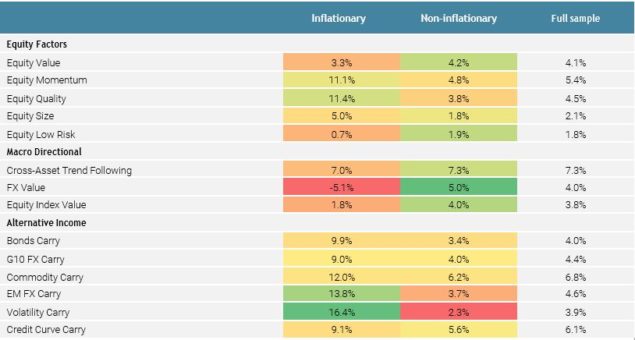
Source: Unigestion, Bloomberg
Table 2: Sharpe Ratios of ARPs in inflationary versus non-inflationary regimes
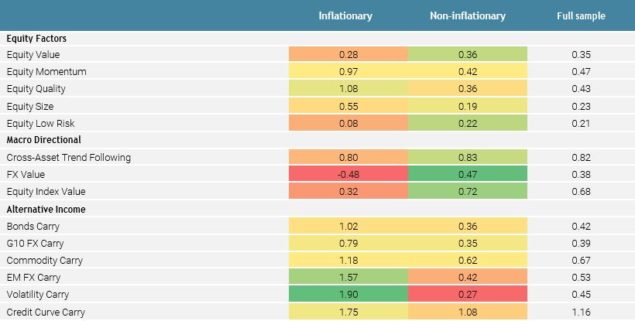
Source: Unigestion, Bloomberg
Table 3: Hit Ratios of ARPs in inflationary versus non-inflationary regimes
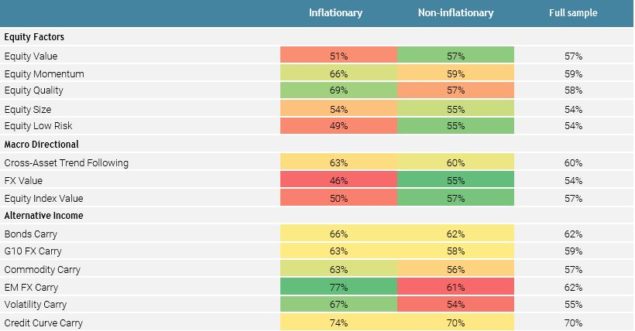
Source: Unigestion, Bloomberg
Starting with Equity Factors, the outperformance of Momentum and the underperformance of Low Risk is in line with existing literature3. As Low Risk is often seen as having bond-like characteristics, it is unsurprising that its performance is worse during inflationary times when yield curves typically steepen. The outperformance of Quality in inflationary regimes is noteworthy and may be explained by high-quality firms being more capable of absorbing rising costs as they tend to have healthier profit margins and
lower leverage4. Conversely, the outperformance of Size in inflationary regimes is less intuitive as one would expect smaller companies to be hurt due to lower pricing power. However, we note its outperformance is not confirmed by hit ratios, indicating that a few outliers might explain the positive results. Finally, Value does not seem to be significantly impacted.
Regarding macro directional strategies, the performance of Cross-Asset Trend Following has been comparable in both regimes. However, this masks the performances of individual asset classes within this risk premia, namely bonds, equities, commodities, and currencies. The bonds and commodities allocations tend to perform well as those asset classes have strong negative and positive trends respectively during inflationary regimes. Equities and currency performance tends to be more mixed, as market returns are usually more range-bound during these periods. Results observed over a long horizon with naïve versions of trend-following strategies show some further heterogeneity depending on asset classes (see Appendix 2). All in all, the positive results stated by Neville et al. (2021) might be taken with caution as the impact of inflation surprises on trend-following seems dependent on the allocation across assets or implementation details. FX Value and Equity Index Value, both essentially reversion strategies toward a fair-value anchor, can be expected to perform better in recession or market stress periods (as illustrated in Blin et al., 2021). As a result, we observe a strong underperformance of these ARP during inflationary regimes versus non-inflationary ones, which encompasses recession and market stress periods. The underperformance of FX Value is particularly stark and can be largely explained by commodity-related currencies (e.g., NOK, SEK, and AUD): these currencies have been structurally overvalued when compared to their PPP rates during inflationary times, leading the risk premia to have a short bias to them. However, as inflationary regimes emerge alongside higher commodity prices, these currencies rally and drag the risk premia’s performance. All in all, while these strategies have attractive hedging properties in some of the macro shocks such as recession or market stress episodes, this is not true for inflationary shocks.
Finally, Alternative Income strategies seem to be among the strongest beneficiaries of inflation shocks. This is striking in historical samples, but we might expect this to repeat if the current inflation shock persists. In the recent era of accommodative monetary policies, global rates have fallen close to zero (and negative in some cases), leading to lower dispersion of rates across economies and, in turn, carry that can be harvested within asset classes. Conversely, unexpected inflation can drive long-term yields higher and cause yield curves to steepen, leading to the re-emergence of carry opportunities. Thus one can expect carry strategies, such as Bonds and FX Carry, to generally outperform during inflationary regimes. G10 FX Carry has the additional tailwind that the higher yielding currencies are often those that have a higher sensitivity to commodity prices, such as AUD, NZD and NOK. Thus the risk premia’s long positioning in these currencies is well-rewarded during inflationary periods.
Concluding Remarks
This paper discusses the performances of ARP in inflationary versus non-inflationary regimes, a key cornerstone of our macro risk- based framework.
- Among Equity Factors, our results are in line with existing academic literature: Low Risk underperforms while Momentum Quality’s performance in inflationary versus non-inflationary periods appears to be quite sensitive to factor definition and hence will be implementation-specific, while Value does not seem to be significantly affected.
- Macro Directional strategies strongly underperform in inflationary periods overall, with the exception of Cross-Asset Trend Following, which might benefit from its commodities allocation if it is
- Alternative Income (i.e., carry) strategies were among the strongest outperforming ARP in inflationary regimes, likely the result of the re-emergence of carry opportunities as rates move higher and yield curves
All in all, the dispersion in performances in inflationary versus non-inflationary regimes across risk premia cautions against treating ARP as a single asset class in forming expectations about its performance in these two regimes. The construction, implementation, and relative weights of strategies within an ARP portfolio will lead to significant dispersion in expected and realised performance. It also reaffirms our belief that the macroeconomic sensitivities of ARP are useful guides when making strategic allocation decisions.
1See Baig et al. (2019) and Blin et al. (2021).
2As a rule of thumb, assuming equal variance across periods, a difference of return of near 10% per year between inflationary and non- inflationary periods is needed to be significant at the 10% level in the current context.
3See Neville et al. (2021) and Blitz (2021).
4We would caution that this result is sensitive to the definition of “Quality” as we find the opposite when using the Fama-French “Robust Minus Weak (RMW)” and the “Quality Minus Junk (QMJ)” formulations (see Table A2 in Appendix) on a longer history. In Blitz (2021), the author also finds differing results when defining quality using RMW versus QMJ.
Bibliography
Baig S., Blin O., Teiletche J. (2019). “Building a better strategic allocation: The Macro Risk Diversified portfolio”, Unigestion Research Paper, November.
Blin O., Ielpo F., Lee J., Teiletche J. (2021). “Alternative Risk Premia Timing: A Point-in-Time Macro, Sentiment, Valuation Analysis”, Journal of Systematic Investing, Volume I Issue 1, 52-72.
Blitz (2021). “The Quant Cycle”, The Journal of Portfolio Management, QES 22, 1-18.
Neville H., Draaisma T., Funnel B., Harvey C., Van Hemert O. (2021). “The Best Strategies for Inflationary Times”, The Journal of Portfolio Management, August, 8-37.
Podkaminer E., Tollette W., and Siegel L. (2021). “Protecting Portfolios Against Inflation”, The Journal of Investing, 1-22
Contact Information
If you are an institutional investor: clients@unigestion.com
If you are a consultant: consultants@unigestion.com
If you are a journalist/press agency: pressrelations@unigestion.com
Disclaimer
This document is addressed to professional investors, as described in the MiFID directive and has therefore not been adapted to retail clients.
This document has been prepared for information only and must not be distributed, published, reproduced or disclosed by recipients to any other person. It does not constitute an offer to sell or a solicitation to subscribe in the strategies or in the investment vehicles it refers to, which may be construed as high risk and not readily realisable investments which may experience substantial and sudden losses including total loss of investment. The views expressed in this document do not purport to be a complete description of the securities, markets and developments referred to in it. To the extent that this report contains statements about the future, such statements are forward-looking and subject to a number of risks and uncertainties, including, but not limited to, the impact of competitive products, market acceptance risks and other risks.
All information provided here is subject to change without notice. It should only be considered current as of the date of publication without regard to the date on which you may access the information. All investors must obtain and carefully read the prospectus which contains additional information needed to evaluate the potential investment and provides important disclosures regarding risks, fees and expenses.
Past performance is not a guide to future performance. You should remember that the value of investments and the income from them may fall as well as rise and are not guaranteed. Rates of exchange may cause the value of investments to go up or down. An investment with Unigestion, like all investments, contains risks, including total loss for the investor.
Data and graphical information herein are for information only and may have been derived from third party sources. Unigestion takes reasonable steps to verify, but does not guarantee, the accuracy and completeness of this information. As a result, no representation or warranty, expressed or implied, is or will be made by Unigestion in this respect and no responsibility or liability is or will be accepted. Unless otherwise stated the source is Unigestion.