MiViews Q2 2020: A rude awakening
- Our core Q2 scenario is a -5% quarterly (non-annualised) decline in GDP growth across both the US and Europe.
- A liquidity squeeze is a key part of our tail-risk scenario, particularly in the wake of market indifference to monetary stimulus.
- Fiscal support is substantial across the US and Europe, but it is also uneven and presents a number of long-term risks.
- Valuations are attractive but we believe investors are underestimating the extent of the shock. We remain defensive.
Overview
The COVID-19 shock is one of the largest of the past 100 years. Although its impact is uncertain, it will be massive, and a rude awakening for investors lulled to sleep by accommodative central banks over the last decade. We think the extent of the shock is underestimated by many; prolonged shocks are difficult for investors to manage and can create feedback loops, and even with the combined global stimulus, we are likely to see choppy markets ahead.
The macro situation is very concerning, market sentiment is volatile, and valuation gaps in stocks and credit appear tempting. However, we think it is too soon to take on any meaningful risk at this point: we would need to see clear signs of an economic recovery first. Despite the large and coordinated stimulation from governments and central banks, growth is getting crushed by the virus’s impact. We believe that next quarter will be volatile with (1) growth assets likely exhibiting negative returns, (2) typical hedges showing disappointing performances, and (3) a tail risk that falling liquidity could accelerate the downturn in markets.
The core of our pessimism comes from our macro assessment: we think markets are broadly underestimating the impact on growth, earnings contraction and credit defaults, especially across the high yield space. The quarter should hopefully see the end of the COVID-19 virus outbreak but not its impact on the economy and markets, and we remain on the defensive side.
It’s not looking good
We have been communicating our growth scenario actively over the past month: we expect a sharp recession across the world. This growth contraction is hard to gauge because of the nature of this shock: it has been rapid, sudden and we lack the full spectrum of the usual statistics to measure its extent.
To overcome these handicaps and estimate its impact, we have investigated several leads, including modelling the economic impact of the pandemic based on our in-house hypotheses, comparing the past three world recessions, and analysing the situation in Asia. Across these different perspectives, we get a consistent picture of a severe economic slowdown to which markets will react adversely.
The first analysis we conducted was a scenario analysis, investigating the potential impact of a prolonged consumption contraction. To understand the likely impact on the economy, we considered a model for a flu pandemic developed in the epidemiological literature (Health Outcomes and Costs of Community Mitigation Strategies for an Influenza Pandemic in the United States, Perlroth et. al., Clin. Inf. Dis. 2010 Jan 15;50(2):165-74). By looking at the decomposition of the US and Eurozone GDP and using a consumption-cut quarantine scenario, we can estimate the impact of the current social distancing measures on these two major economies. In quarterly terms, a quarantine that lasts for two months (as in China), with 90% of the population complying and cutting consumption by 70%, would result in a -5% quarter-on-quarter growth shock. This would bring 2020 US growth to -3% and Eurozone growth to -4% year on year, accounting for growth normalisation in the second half of the year. Thus, according to our core scenario, 2020 should see the first global recession since the Great Financial Crisis (GFC). This scenario assumes that the quarantine will have a limited impact on financial services, insurance, utilities and healthcare services, and leaves 20% of usual energy consumption. If the current shock is not temporary, investments will decline and lead to a more severe and longer-lasting scenario. This remains our tail-risk scenario, even though we are already seeing evidence of deteriorating investment perspectives in Asia. In such a case, the -5% estimate could become as much as -8%, the largest macro shock from such a short period ever seen in modern times . These scenarios are summarised in Figure 1 below.
Figure 1: Growth Impact of COVID-19 for 2020 in the Eurozone and the US
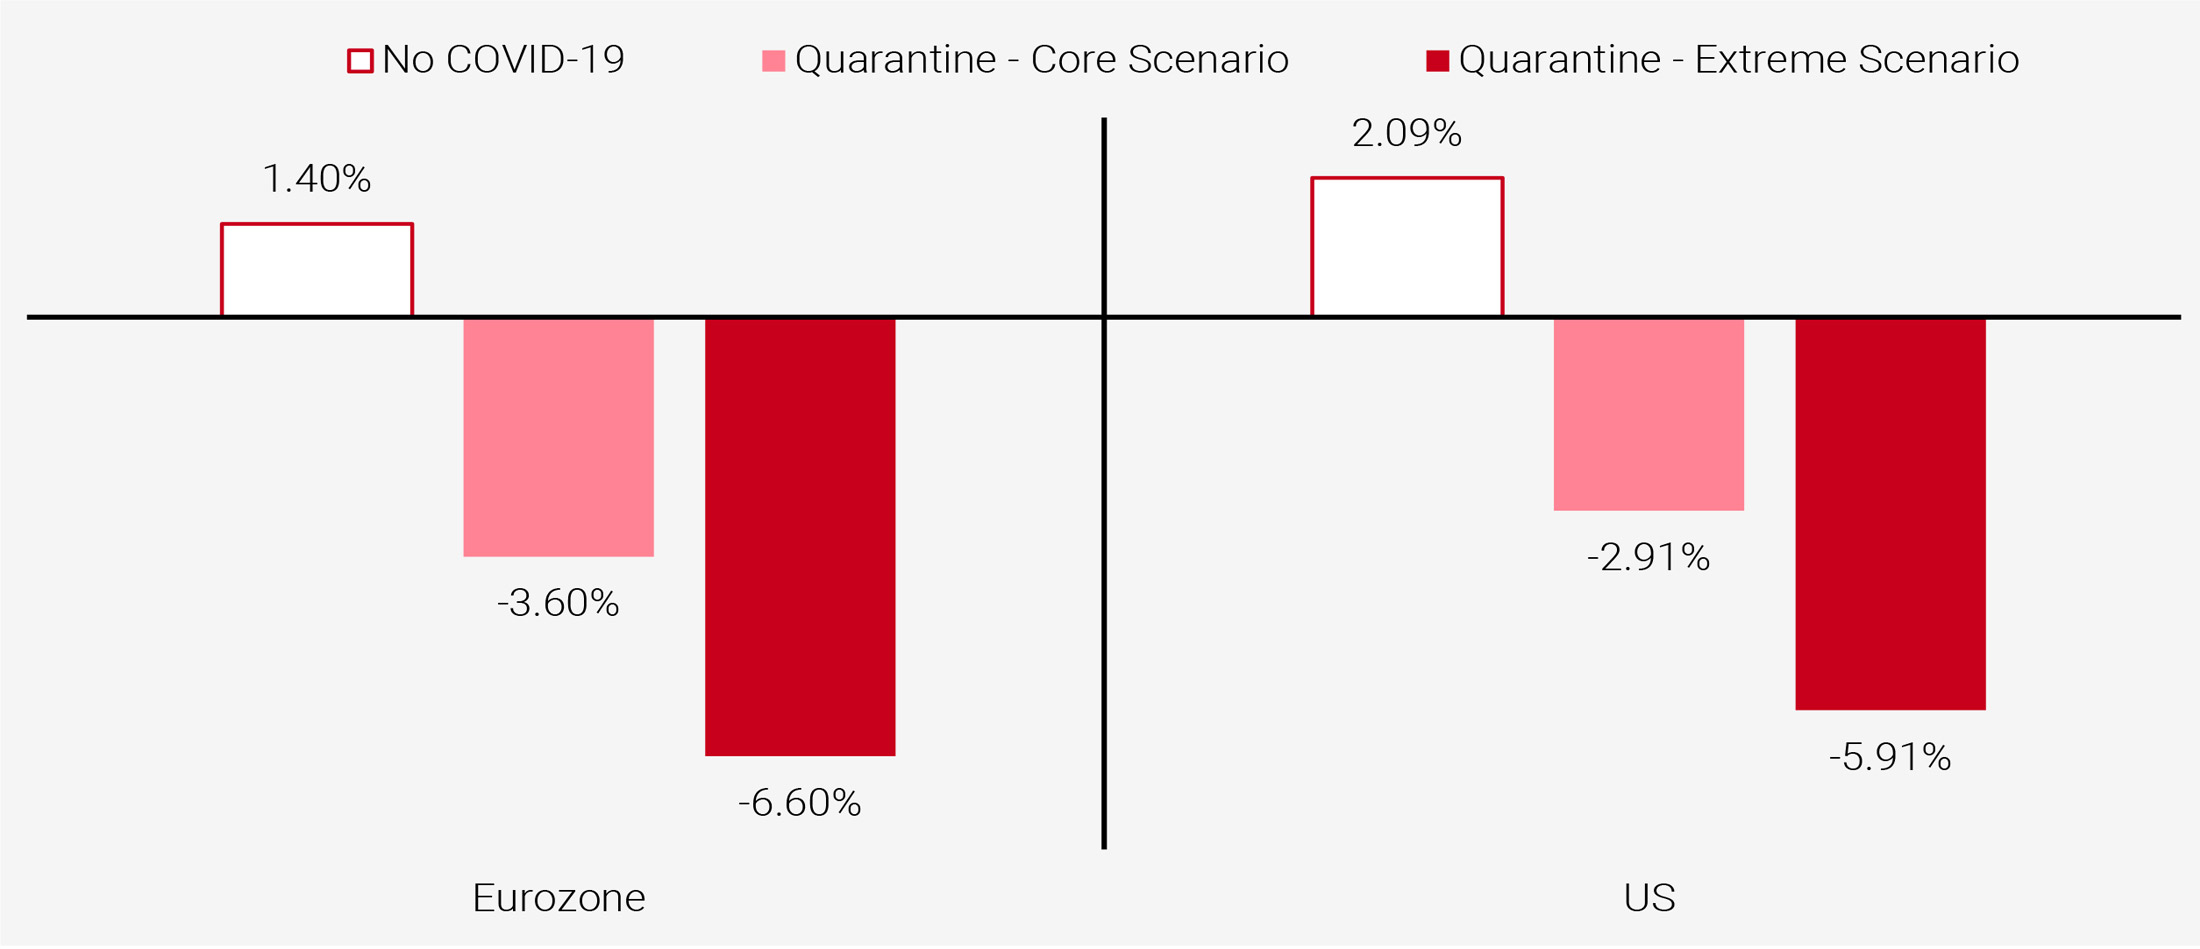
For comparison’s sake, during the fourth quarter of 2008 (the largest macro shock so far), US GDP contracted by 1.5% quarter-on- quarter in non-annualised terms. We are currently expecting a one-off shock of about three times this magnitude. The COVID-19 crisis is therefore shaping up to be the sharpest decline in growth witnessed since World War II. However, it should be temporary, meaning that being able to track down its evolution on a daily basis is essential.
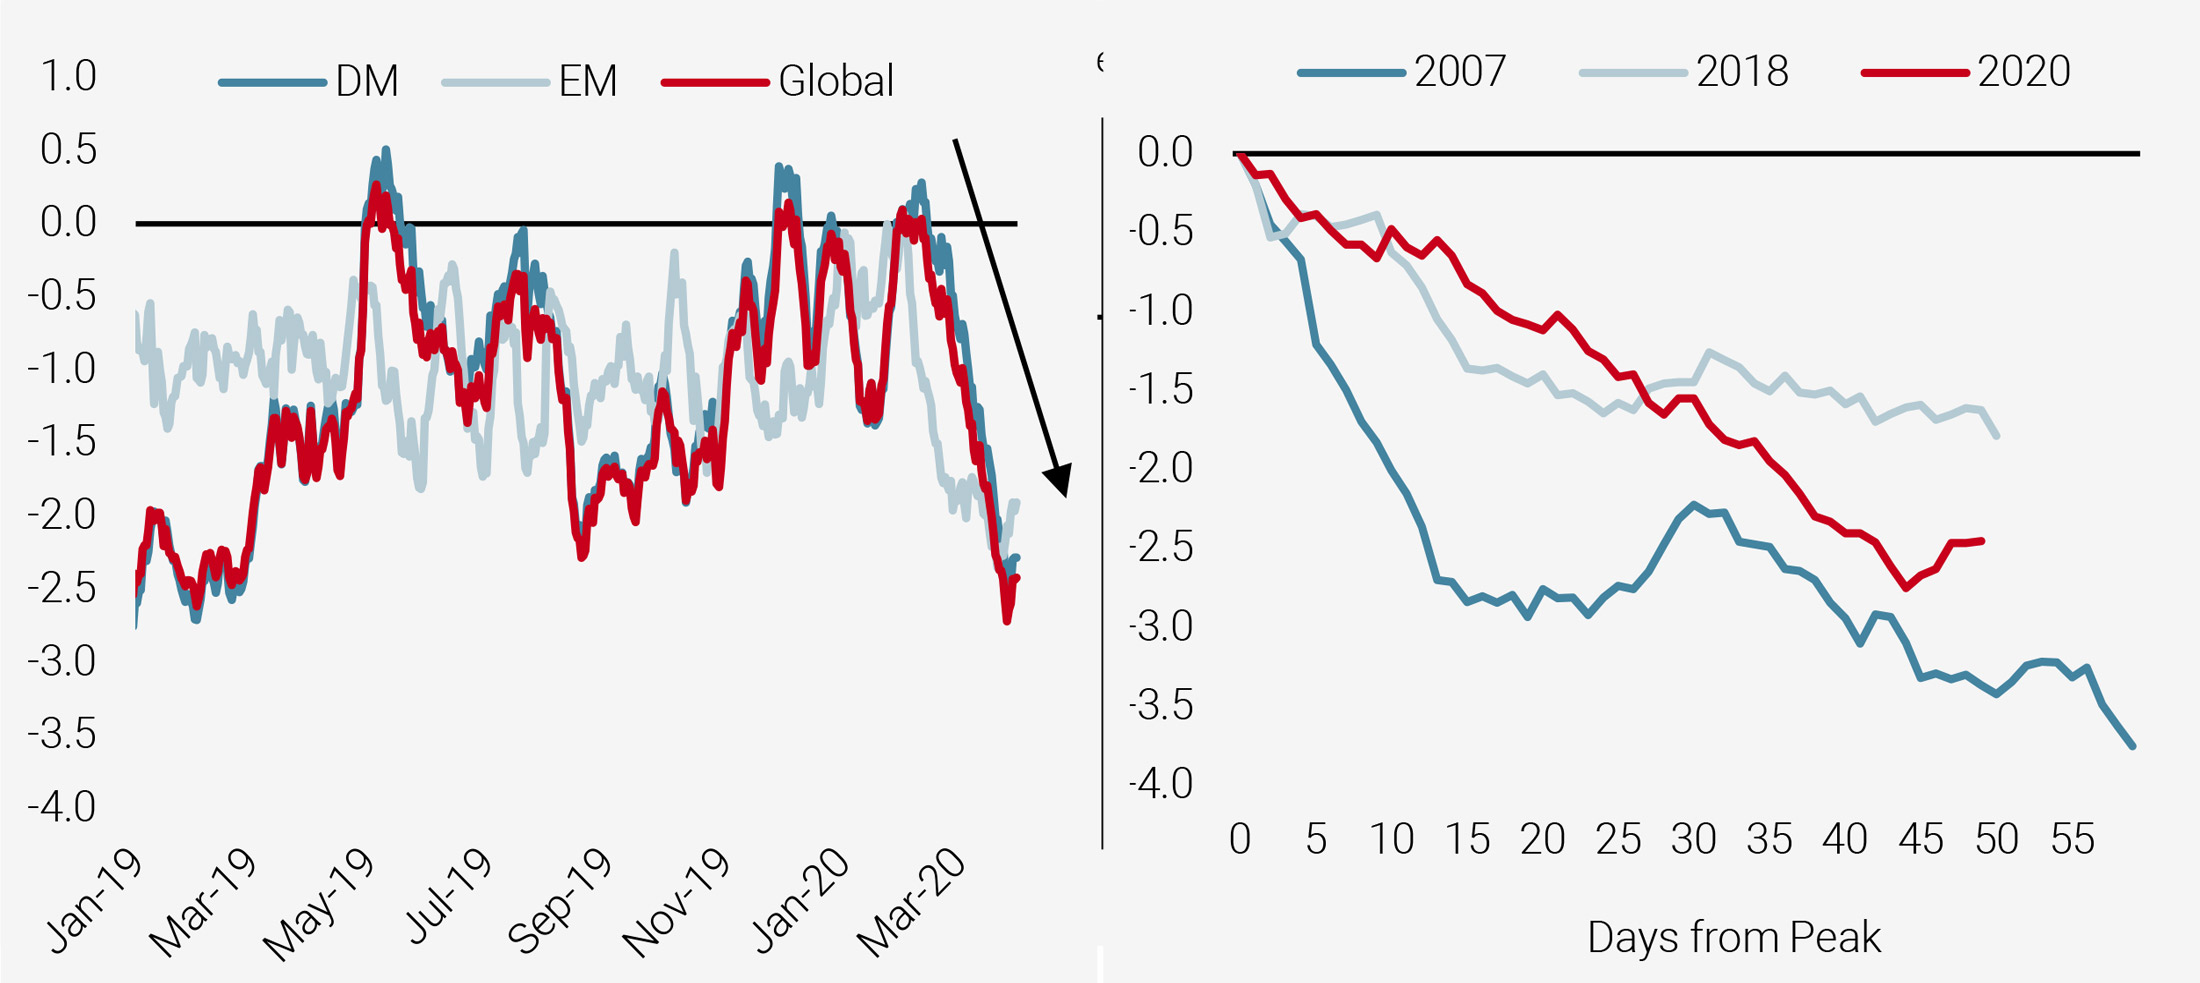
In addition, this crisis comes with a new challenge: the evolution of the underlying phenomenon is hard to measure. The contamination is highly dynamic on a daily basis, and so we have equipped ourselves with different indicators to understand its evolution: the Unigestion Newscaster and Nowcasters. The Unigestion Growth Newscaster is an indicator that tracks public reporting on economic growth across the world. This indicator is intended to complement our existing Growth Nowcaster by making use of the latest technologies in alternative data. Whereas our Growth Nowcaster assesses traditional macro data, the Growth Newscaster reads a vast array of news articles and summarises how the world is assessing the impact of any particular event on the broader economy. Hence it is expected to be faster-moving (at the cost of additional noise) than our Nowcaster but also more reactive, especially around turning points. Since late January, after cresting at a neutral level, the Growth Newscaster has been on a one-way march downwards (see Figure 2). Initially, this was driven by news reports in the emerging world, specifically in China and the impact of the virus there. However, since mid-February, the deterioration has been driven by the developing world, as the virus evolved into a pandemic and news outlets turned their focus onto the economic fall-out. The indicator is now almost on par with the level at the onset of the GFC in late 2007 and in December 2018 amid fears of an impending recession. Figure 2 also compares the evolution of the Newscaster from its peak during these three periods. As the chart shows, the indicator has made most of the move down to GFC levels, suggesting the negative news stories today are on a par with those seen in late 2007. Given its nature, the Newscaster could see a quick snap-back if the news turns significantly less negative, but currently, both the level and trend are worrisome.
Figure 2: Growth Newscaster over 2019-2020 (left) and Evolution from Peak (right)
Recently, our nowcasting indicators have also started picking up a negative macro trend, with some lag. Up to a couple of weeks ago, many cyclical surveys were still showing signs of improvement for the January-February period. Because this shock is exogenous, unlike all recessions except the oil shock of 1979, the entry into the recession was sudden. We therefore had to wait a couple weeks to collect the first data reflecting the extent of the situation. We now have this data, for Asia, Europe and the USA. Here are the results of our analyses:
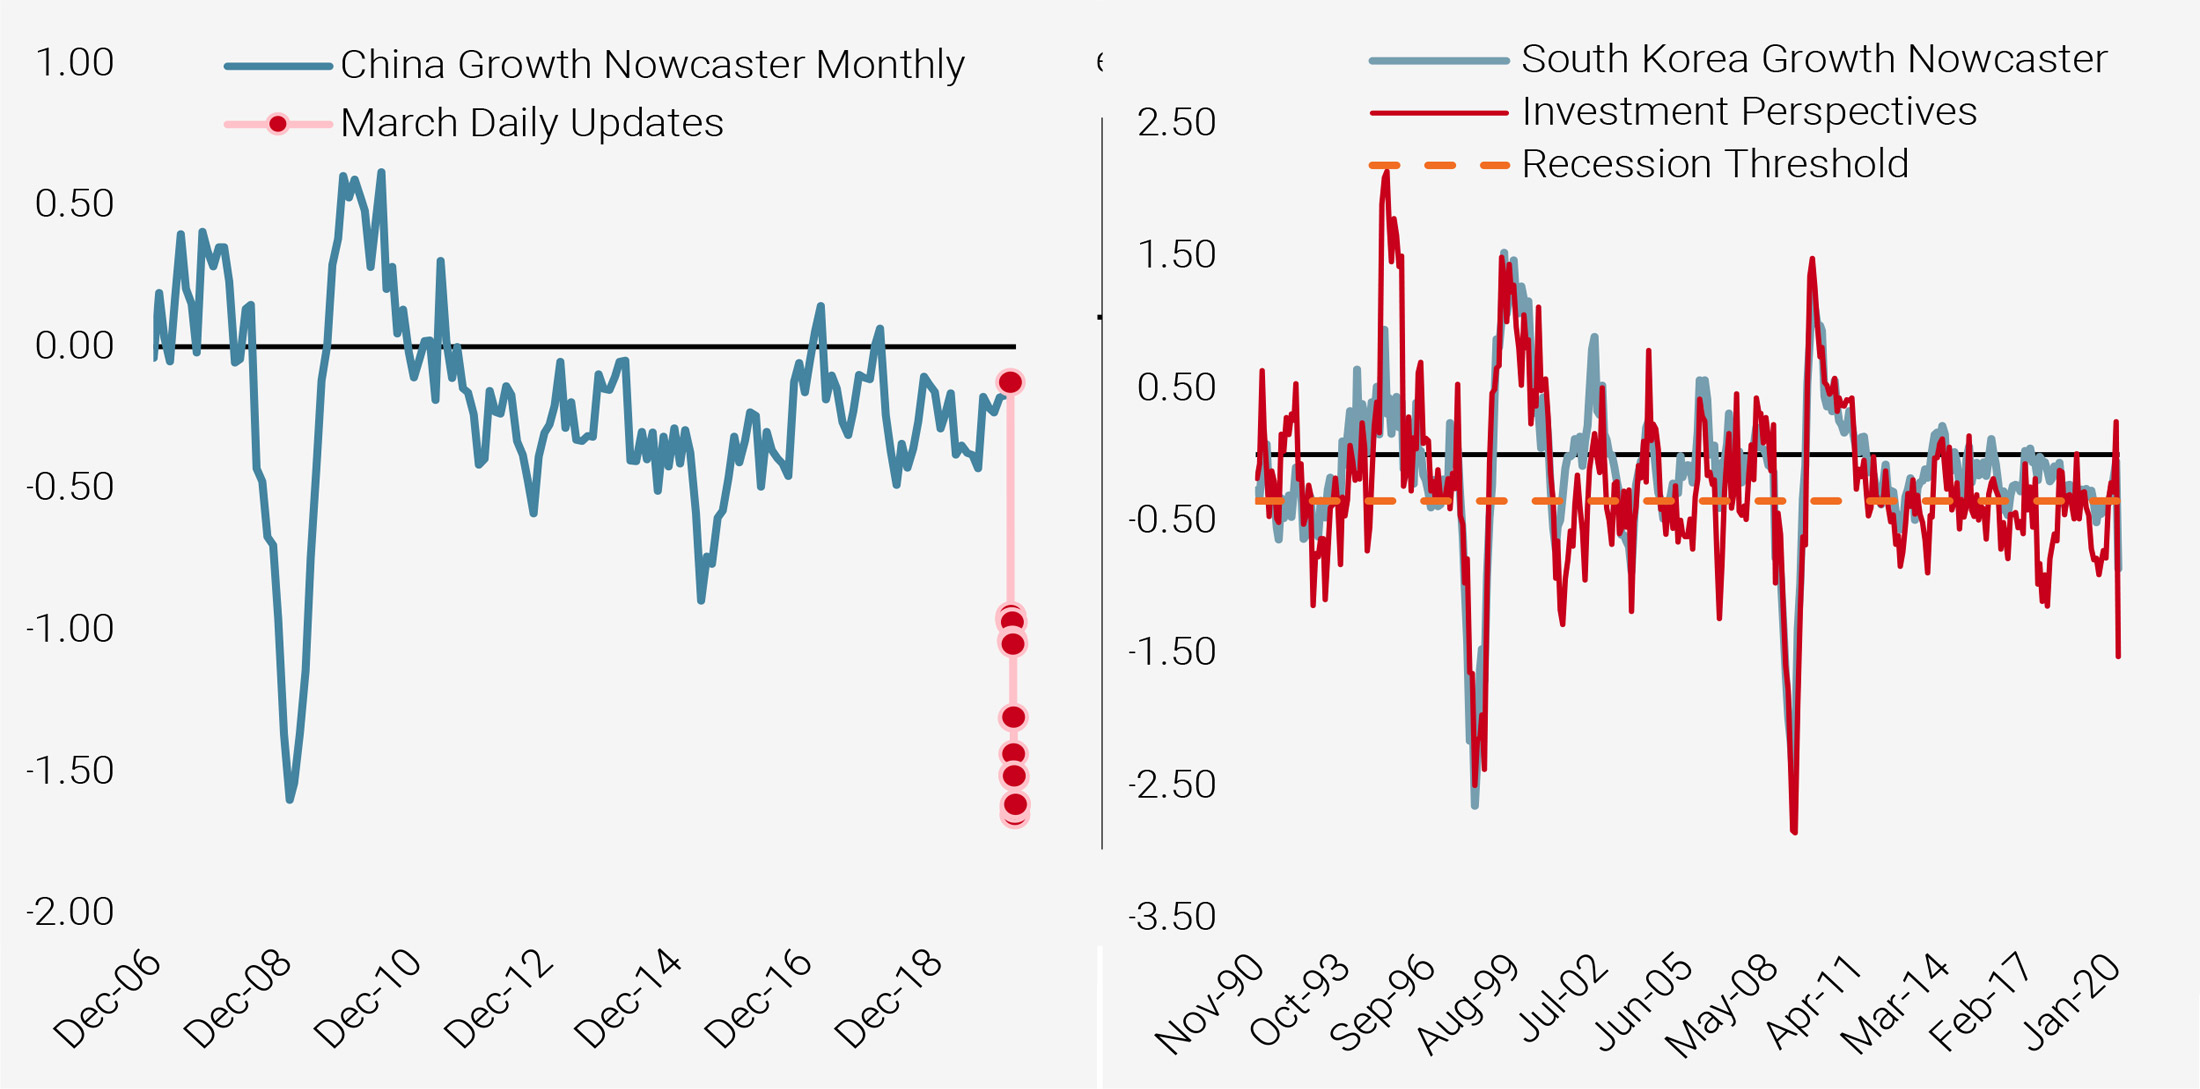
- The data in Asia shows a large and significant shock. In China, the shock seemed to be of a similar order of magnitude as the 2008 crisis up until March. The shock focuses more on services than on industry and affects demand, production expectations and, increasingly, the housing market. In South Korea, the shock is of a similar magnitude, with an additional feature: a collapse in investment perspective as future demand looks volatile and capacity production has decreased markedly, lowering the interest for CAPEX. Both these elements are illustrated in Figure 3. The daily estimates from our China Growth Nowcaster in March show the rapidity of the decline in economic conditions. The South Korea Growth Nowcaster highlights the significant and coincident decline in investment perspectives. From both cases, we learned two things: the deterioration can be fast and extraordinary.
Figure 3: China Growth Nowcaster (left) and South Korea Growth Nowcaster (right)
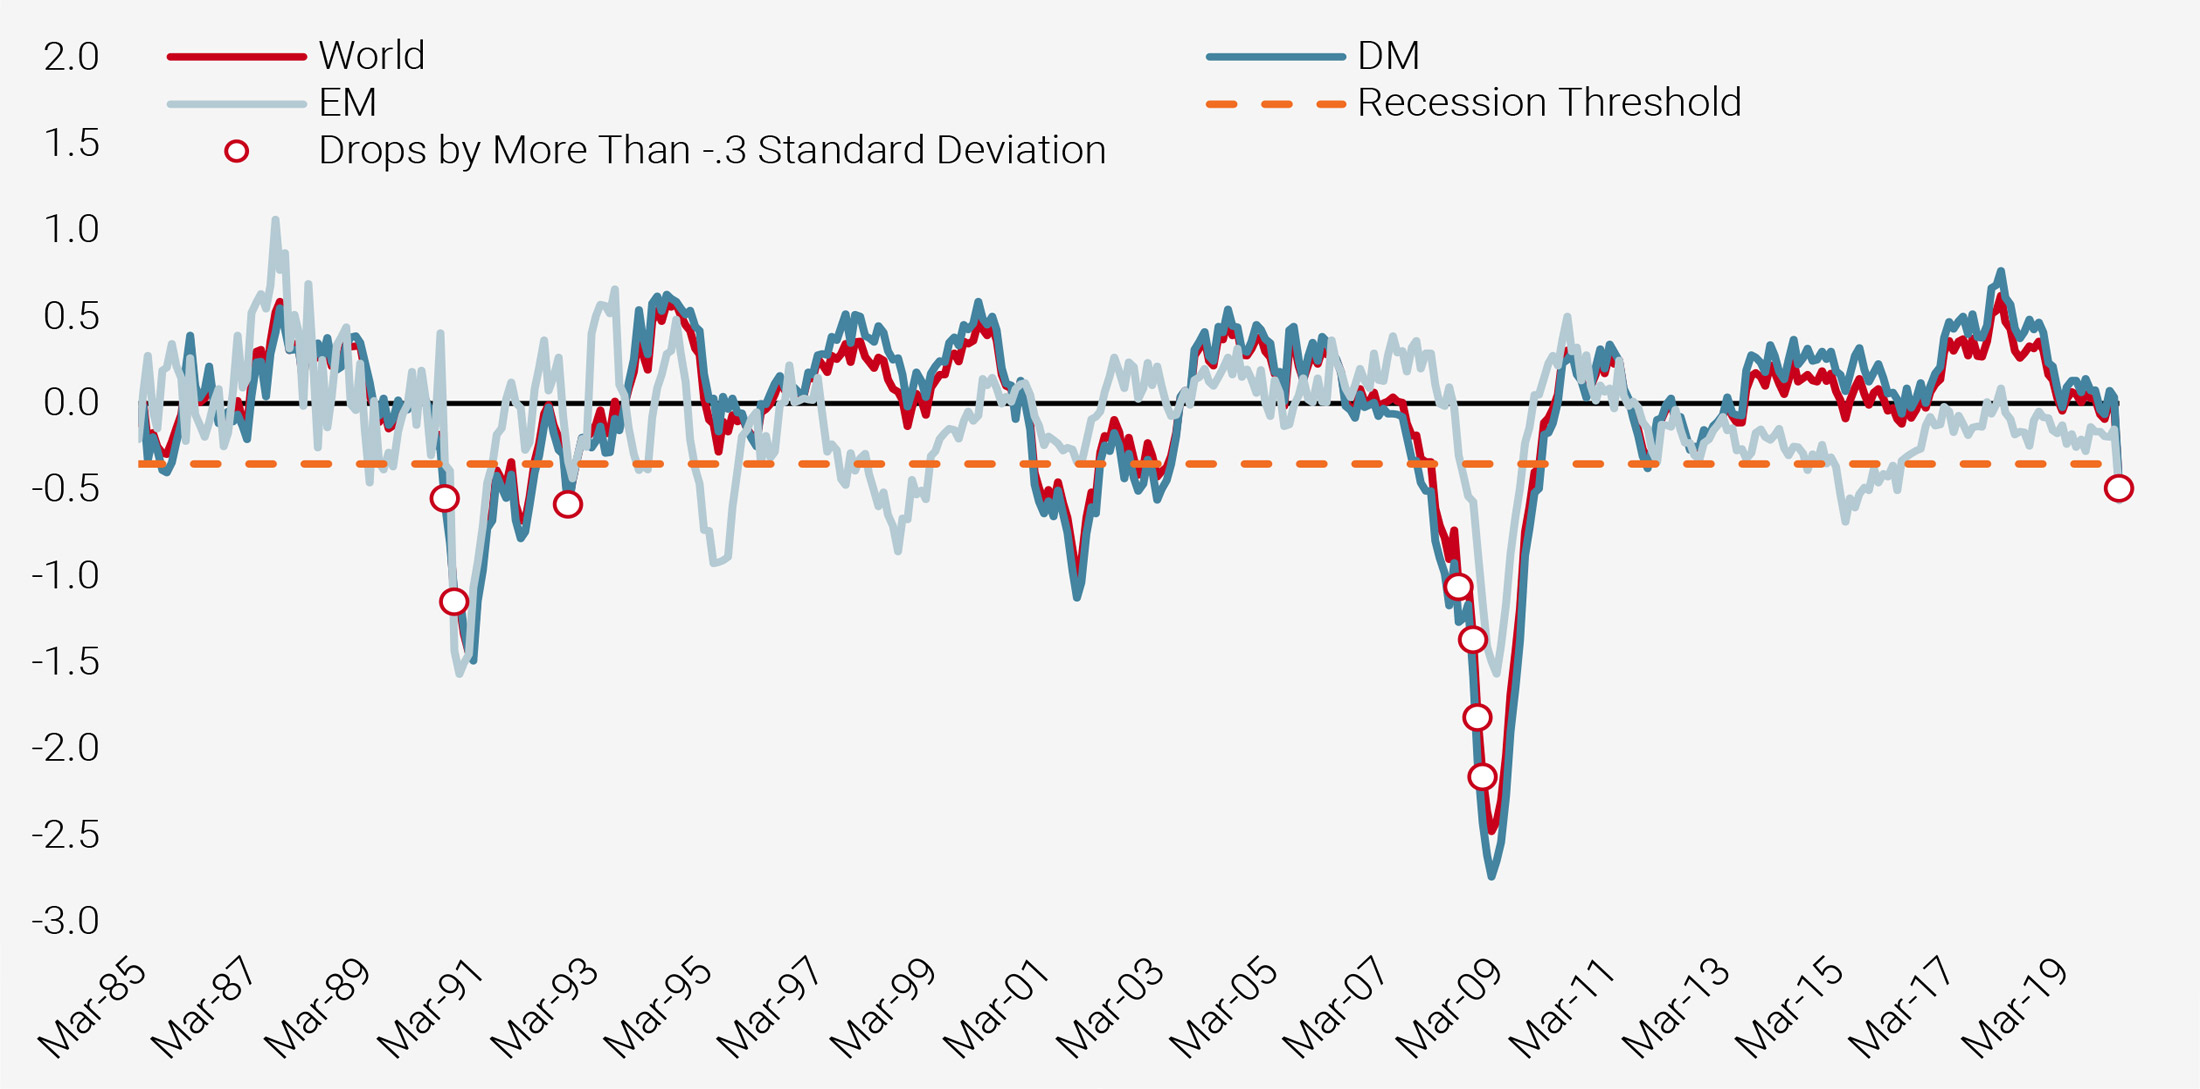
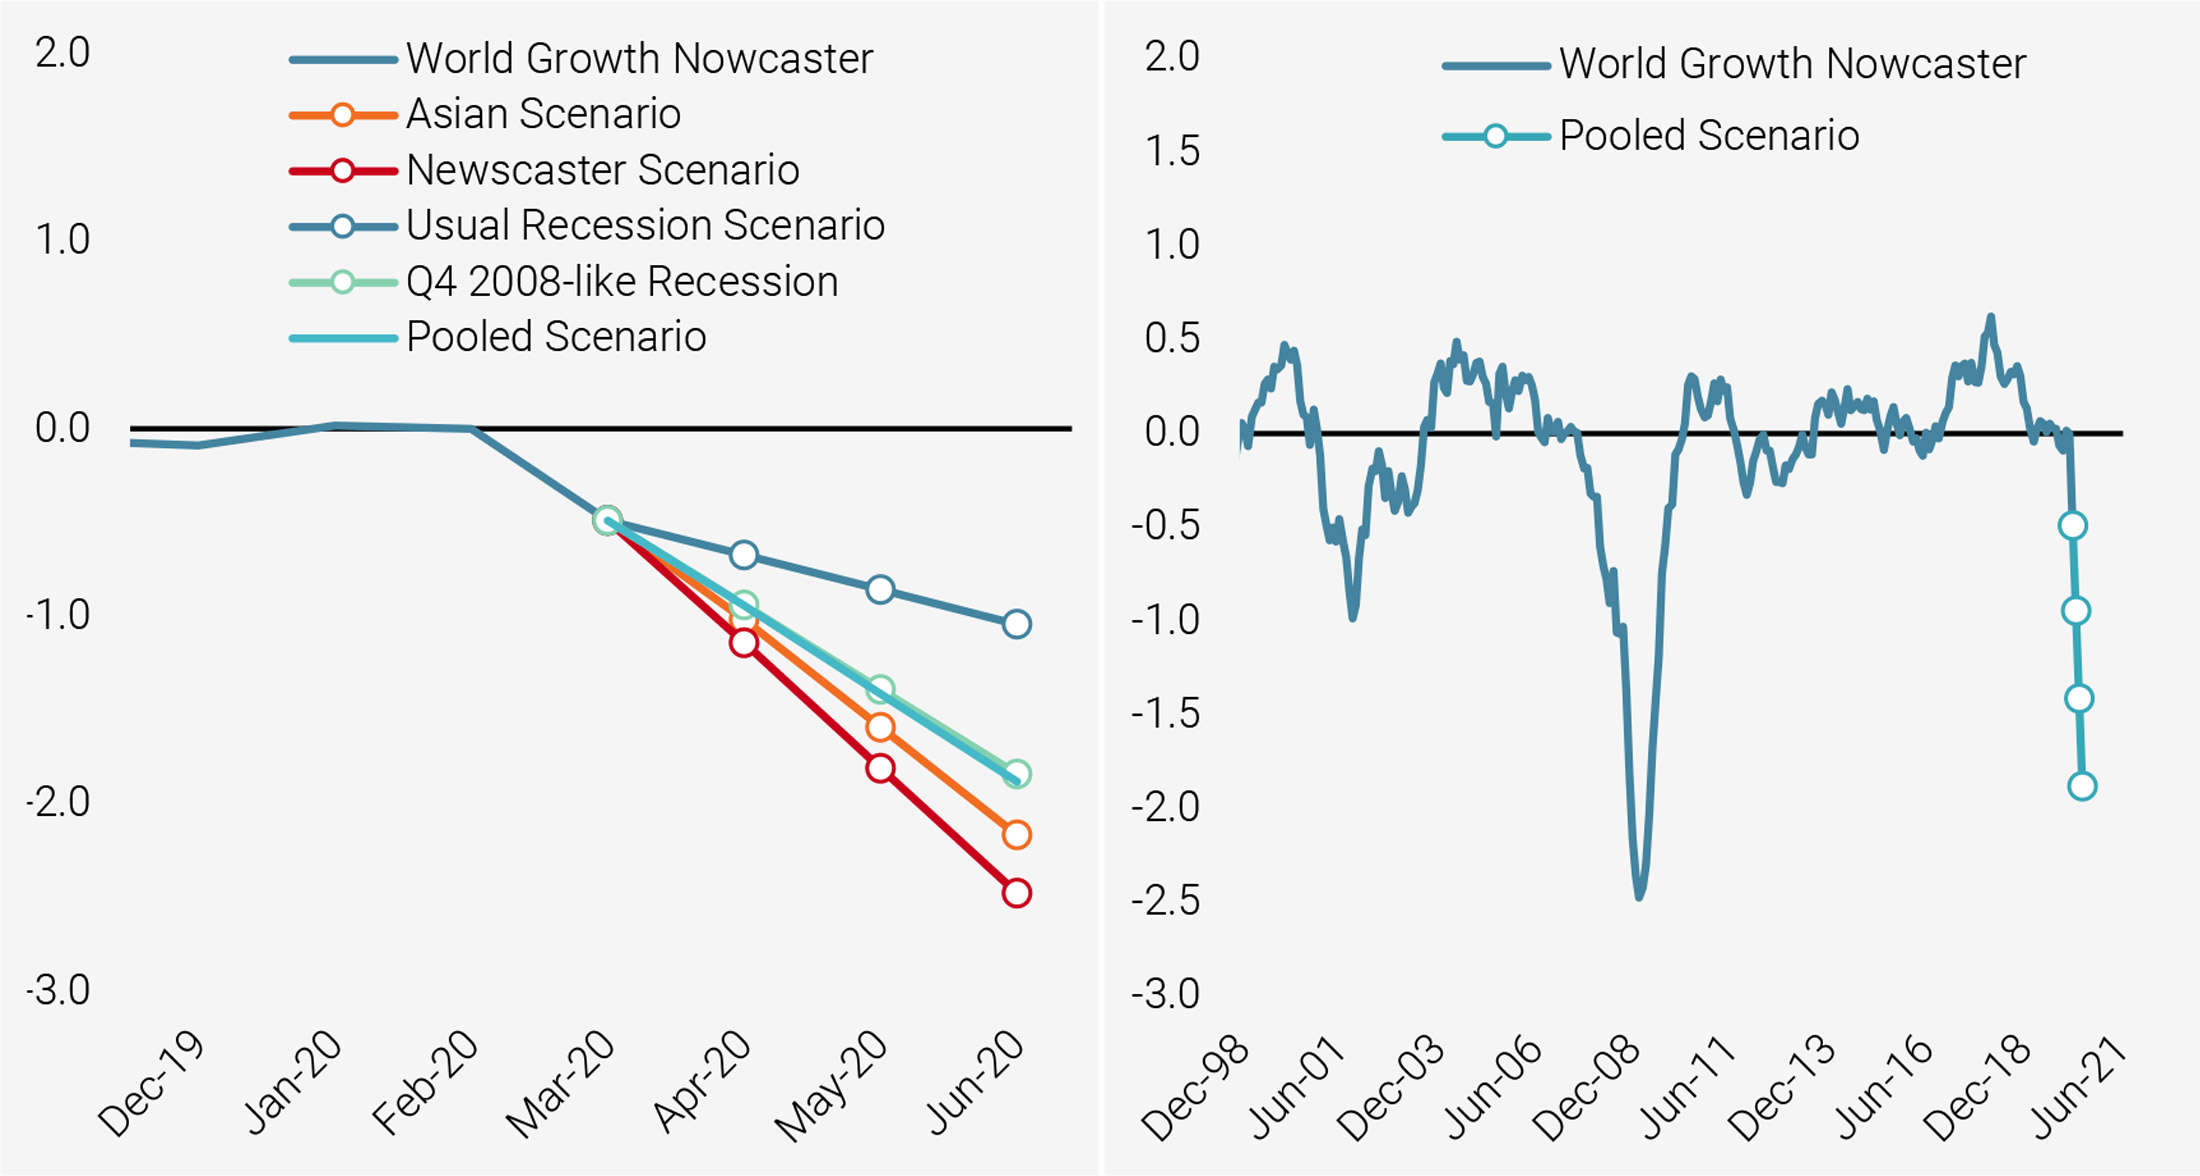
- When comparing the pace of the data deterioration in the US and in Europe, it is consistent with the worst moments of the past three recessions (1990, 2001 and 2008). Our World Growth Nowcaster declined by -0.3 standard deviations within a month, crossing the threshold separating expansion from recession on 27 March. Figure 4 shows historically the key moments when such a large change in a large aggregation of macro data last happened. Out of the eight cases, one is March 2020, another is October 1992. Apart from these cases, the rest of these rapid drops happened during the worst moments of the 1990 and 2008 recessions, two very significant world recessions. Such large and rapid declines in macro data are therefore rare and indicative of significant economic damage. This move is very much in line with our expectation of a -5% quarterly (non-annualised) decline in GDP growth for both the US and Europe. China’s fate is closely linked to these two, but the lack of transparency in its economy makes such a forecast more difficult. Nonetheless, it is hard to see how China could go unchallenged while its two largest clients experience such consumption contraction.
Figure 4: World Growth Nowcaster over the Long Run
We have combined these different elements into a spectrum of scenarios that extrapolate the currently declining readings of our indicators:
- A ‘standard’ recession using the average evolution of our Nowcasters across the last three recessions,
- A ‘2008-like’ scenario matching the current rapid deterioration in macro data to that in the fourth quarter of 2008,
- A ‘Newscaster’ scenario based on the deterioration seen in that indicator,
- An ‘Asian scenario’ that uses leading macro data from China, South Korea, and Taiwan,
- And finally a ‘pooled’ scenario averaging the above possibilities.
These scenarios are presented in Figure 5 below. In our view, this analytical approach is essential to deal with the unique features of the COVID-19 shock: gauging the extent of its impact requires reliable measures and we are firm believers in combining multiple reliable forecasts. Our current expectations are leaning toward the worst of these scenarios, inspired both by our Newscaster indicator and by the Asian experience. The recent intensity and speed of the decline in the US and European macro indicators also plays a significant role in this assessment.
Figure 5: World Growth Nowcaster Scenario for Q4 2020
Is enough help on the way?
Coordinated stimulation from fiscal and monetary authorities could help to alleviate part of the burden of this macro shock, so it is critical to assess these measures. Starting with fiscal policy, over the last month we have seen governments in Europe and in the US implementing various fiscal measures in order to help offset part of the impact of the lock-down. Two types of measures have been discussed: (1) direct spending of money to offset part of the losses in incomes and (2) funding loans to limit the number of defaulting businesses, especially small- and medium-sized ones that are most at risk.
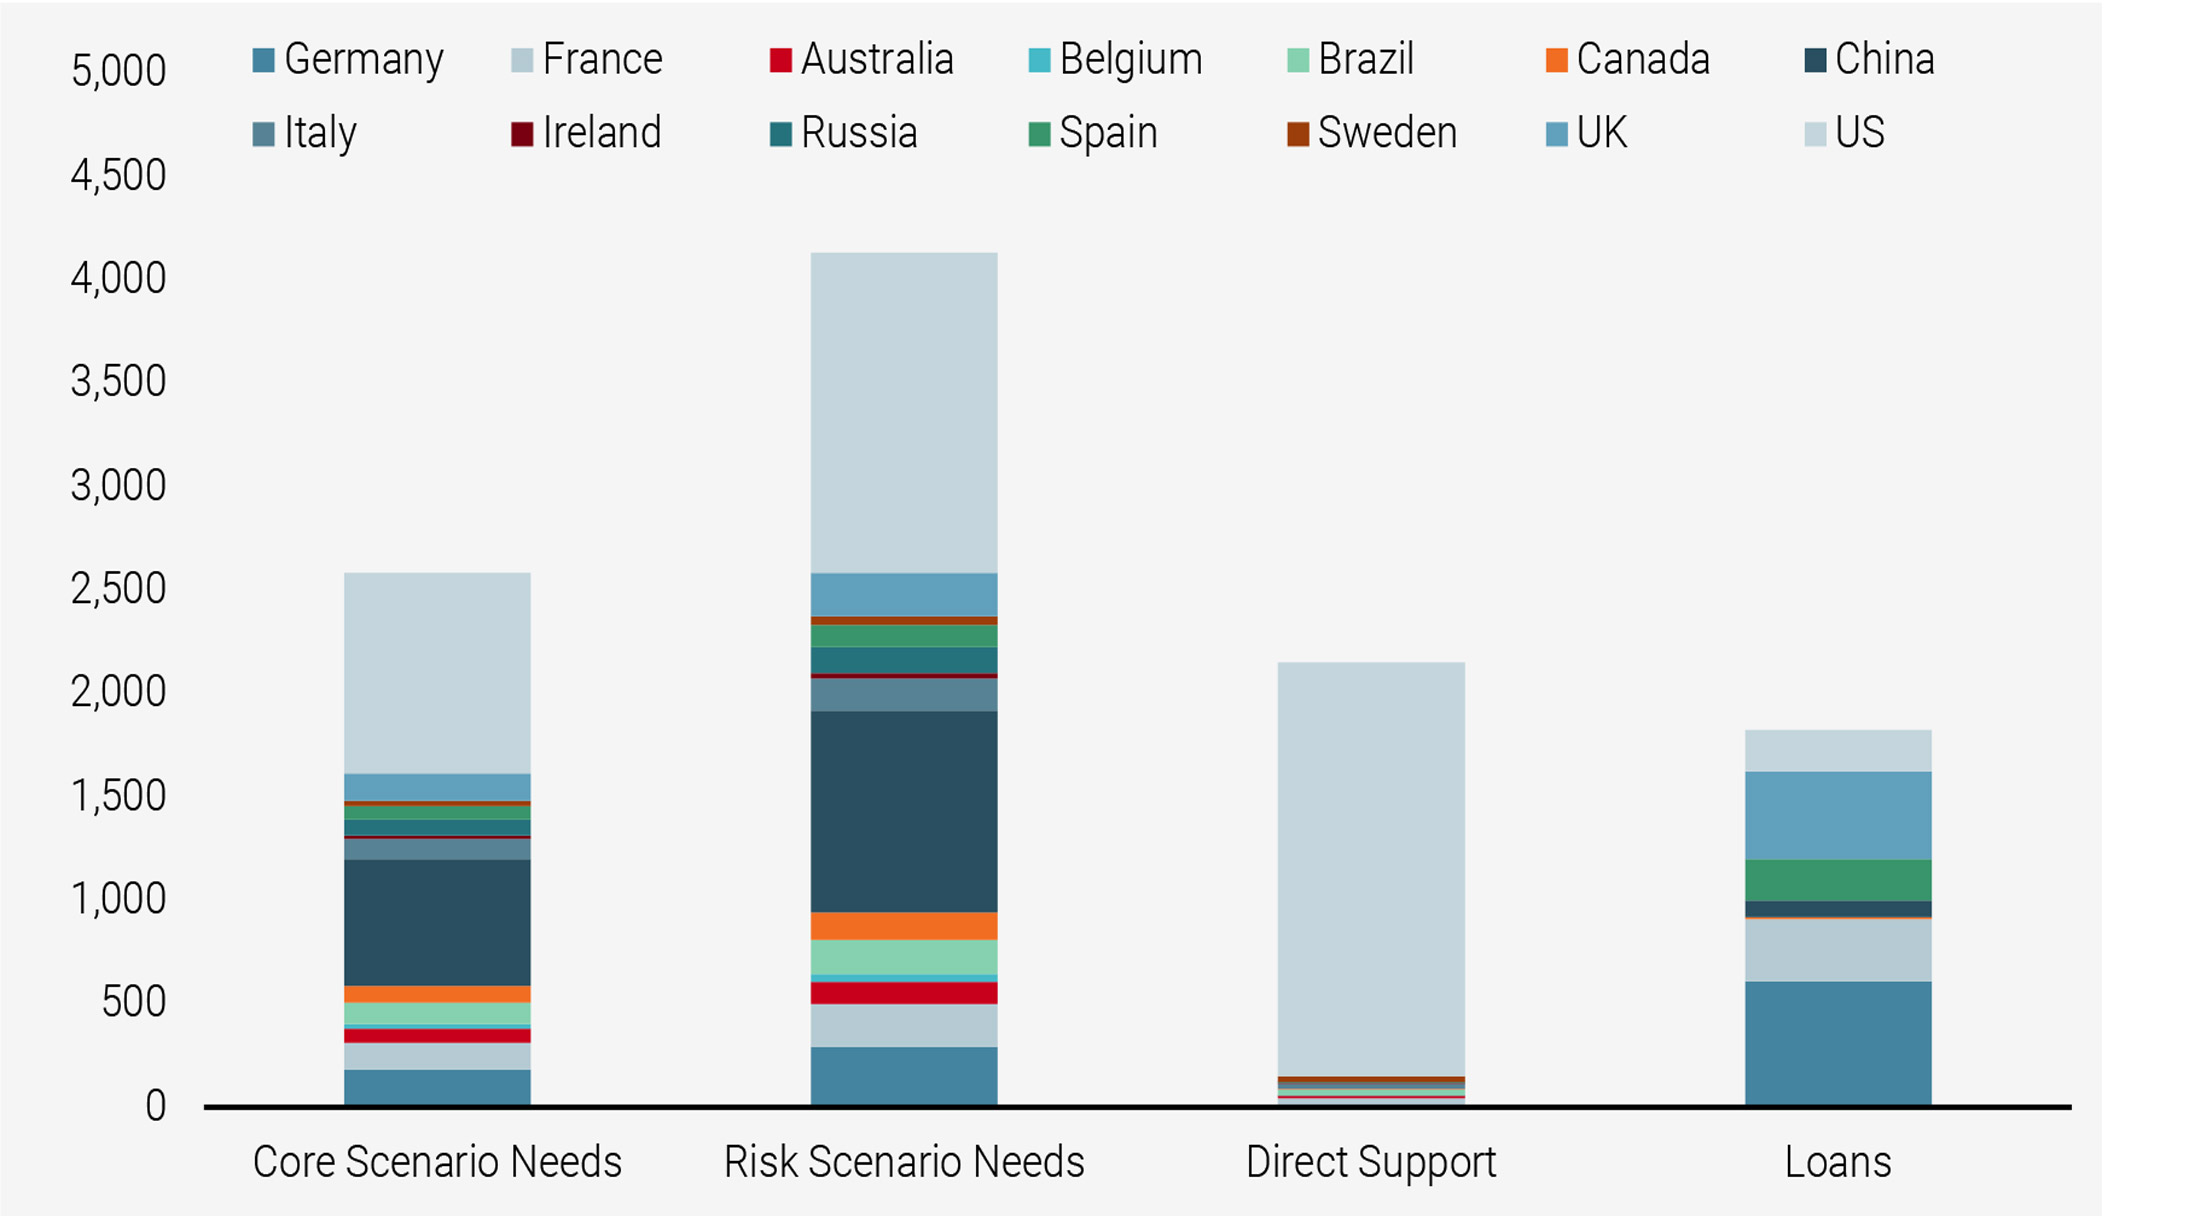
Figure 6 compares the potential GDP destruction in our -5%/-8% pandemic simulation (illustrated in Figure 1) expressed in billions of US dollars. It also compares those figures to what governments have been offering in terms of ‘direct support’ and ‘loans’. Our first conclusion is that in aggregate enough money has been gathered to face the needs arising from the core scenario of a 5% GDP contraction. Indeed, between direct support and loans, more than enough has been pledged to deal with the roughly USD 2.5 trillion damage that COVID-19 will likely bring to the world economy. However, the money promised is extremely uneven from two angles: most of it is actually coming from the US (about USD 2tn) while the rest of the proposed help is through loans, meaning that SMEs will bear the burden of the cost. We think this situation is not without risk: European SMEs would continue to struggle while the US taxpayers will have to give away 1% of GDP growth for the next ten years to repay this 10% increase in their debt to GDP.
Whichever way we look at it, we find limited comfort in this situation. While the aggregate amount of available money seems enough to overcome the needs of our core scenario, its imbalance creates a risk of failure that we think many may overlook. It also implies renewed central bank activism in order to prevent rates from increasing too much across the G10 world, as the fiscal premium required by investors to hold long-term bonds will likely increase with the rising debt of these countries.
Figure 6: Potential GDP Destruction in our Scenario vs. Proposed Fiscal Spending (USD bn)
Sentiment: Markets need liquidity
Once again, central banks have a very significant role to play and not only on the macro front. The Fed showed remarkable commitment to defend its economy and keep markets afloat, albeit with a remarkable lack of success. Its role here is two-fold: to ensure the US Treasury can finance its debt increase at a low cost while maintaining ample liquidity for US assets.
The liquidity element has become key for the Fed recently. First, as highlighted in Figure 7, our market Stress Nowcaster shows readings we have not seen for 12 years. This real-time indicator combines three types of data in order to assess the level of stress across markets: liquidity elements (such as TED spreads), credit spreads observed on derivatives markets, and a large spectrum of implied volatilities. This indicator is currently highlighting that stress conditions in March have been extremely high: our indicator is a z-score, meaning that it ranges in normal times between -2 (low stress) to +2 (high stress). Any reading above 2 should happen about 2.5% of the time, and the indicator reached 2.65 on 9 March. This level shows the compounded impact of very expensive hedges (options and CDS) as well as a significant drying up of liquidity across cash markets. This context surely has a sense of déjà-vu that the Fed could not ignore, creating a desperate call for its intervention.
Figure 7: Market Stress Nowcaster over the Long Run
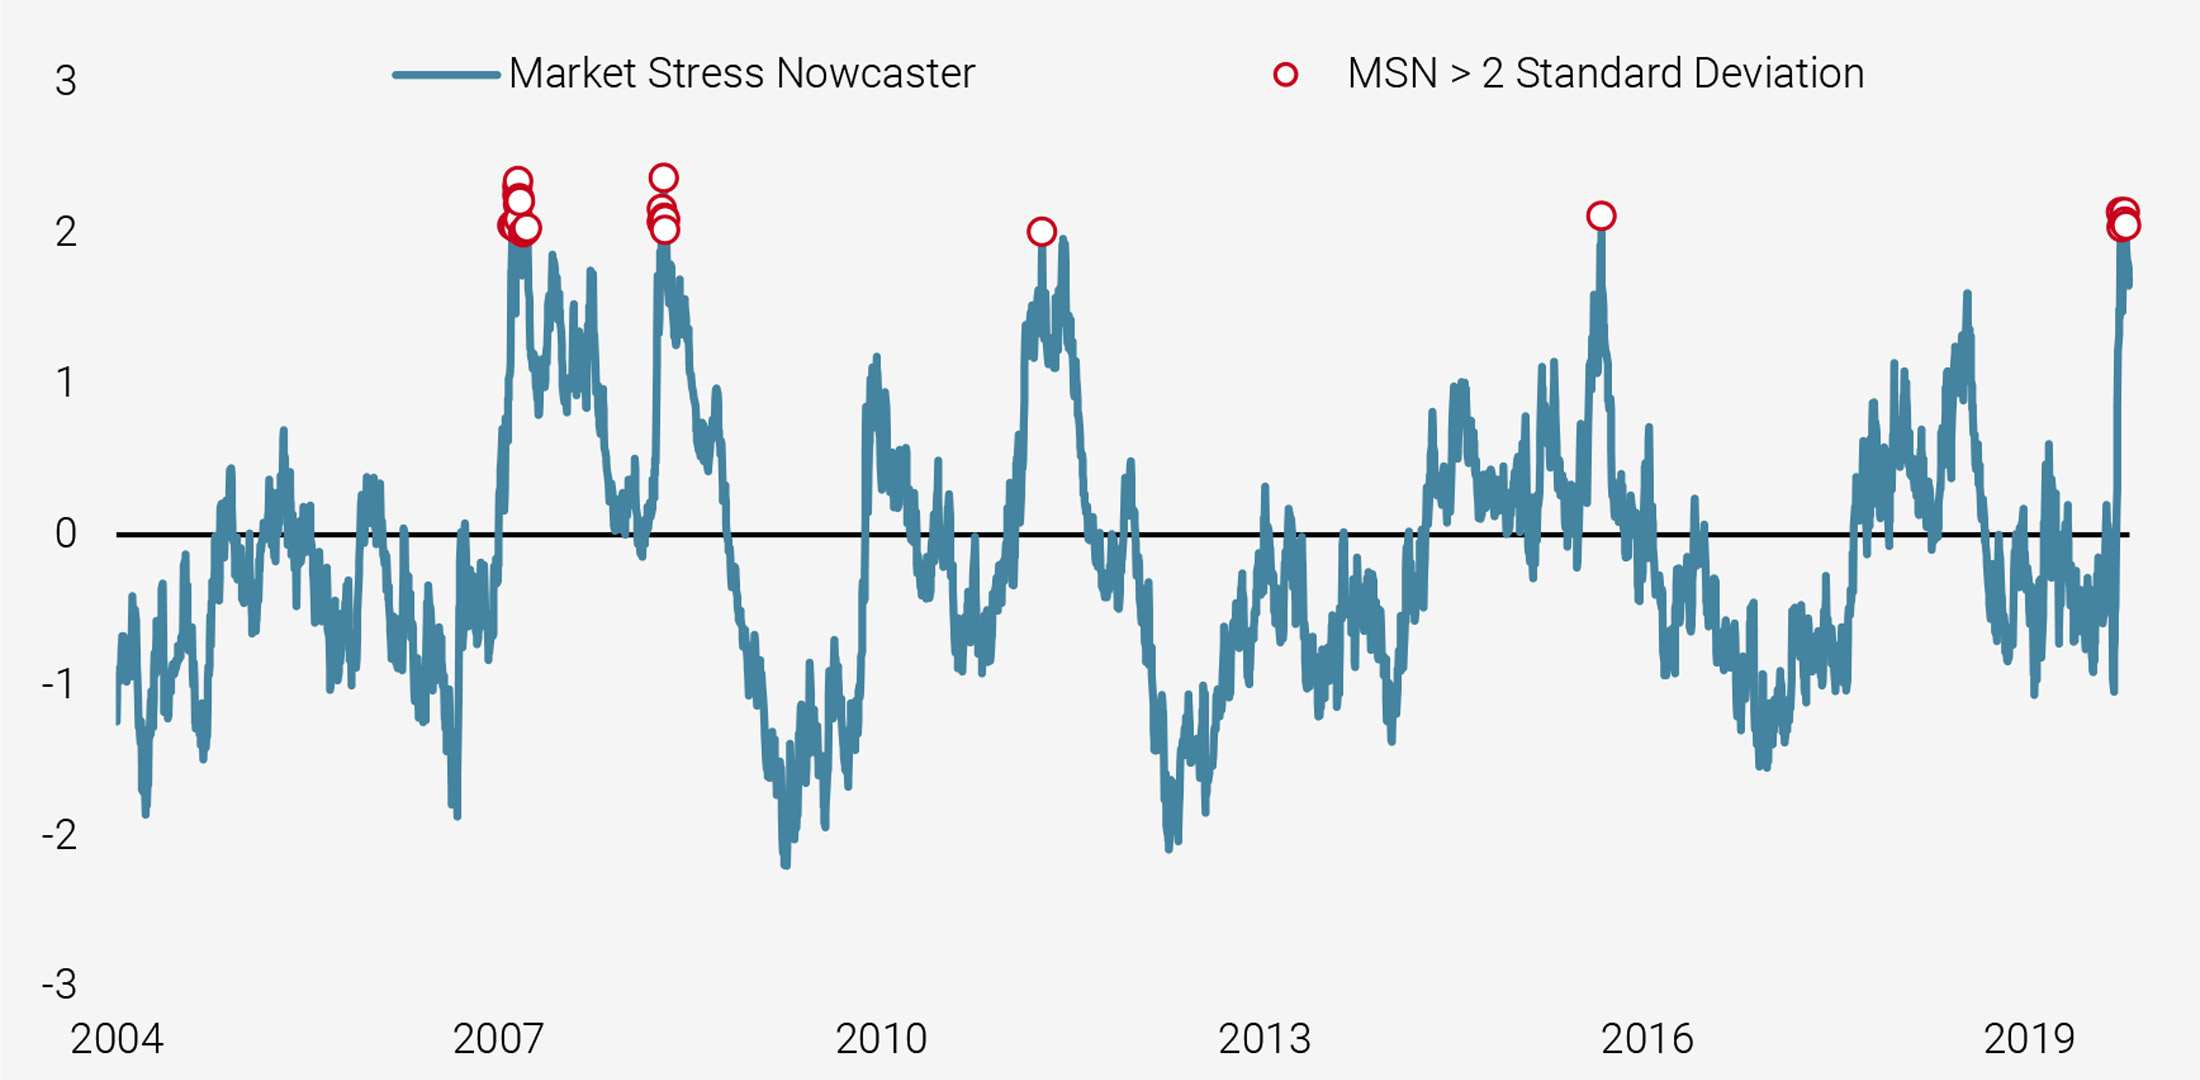
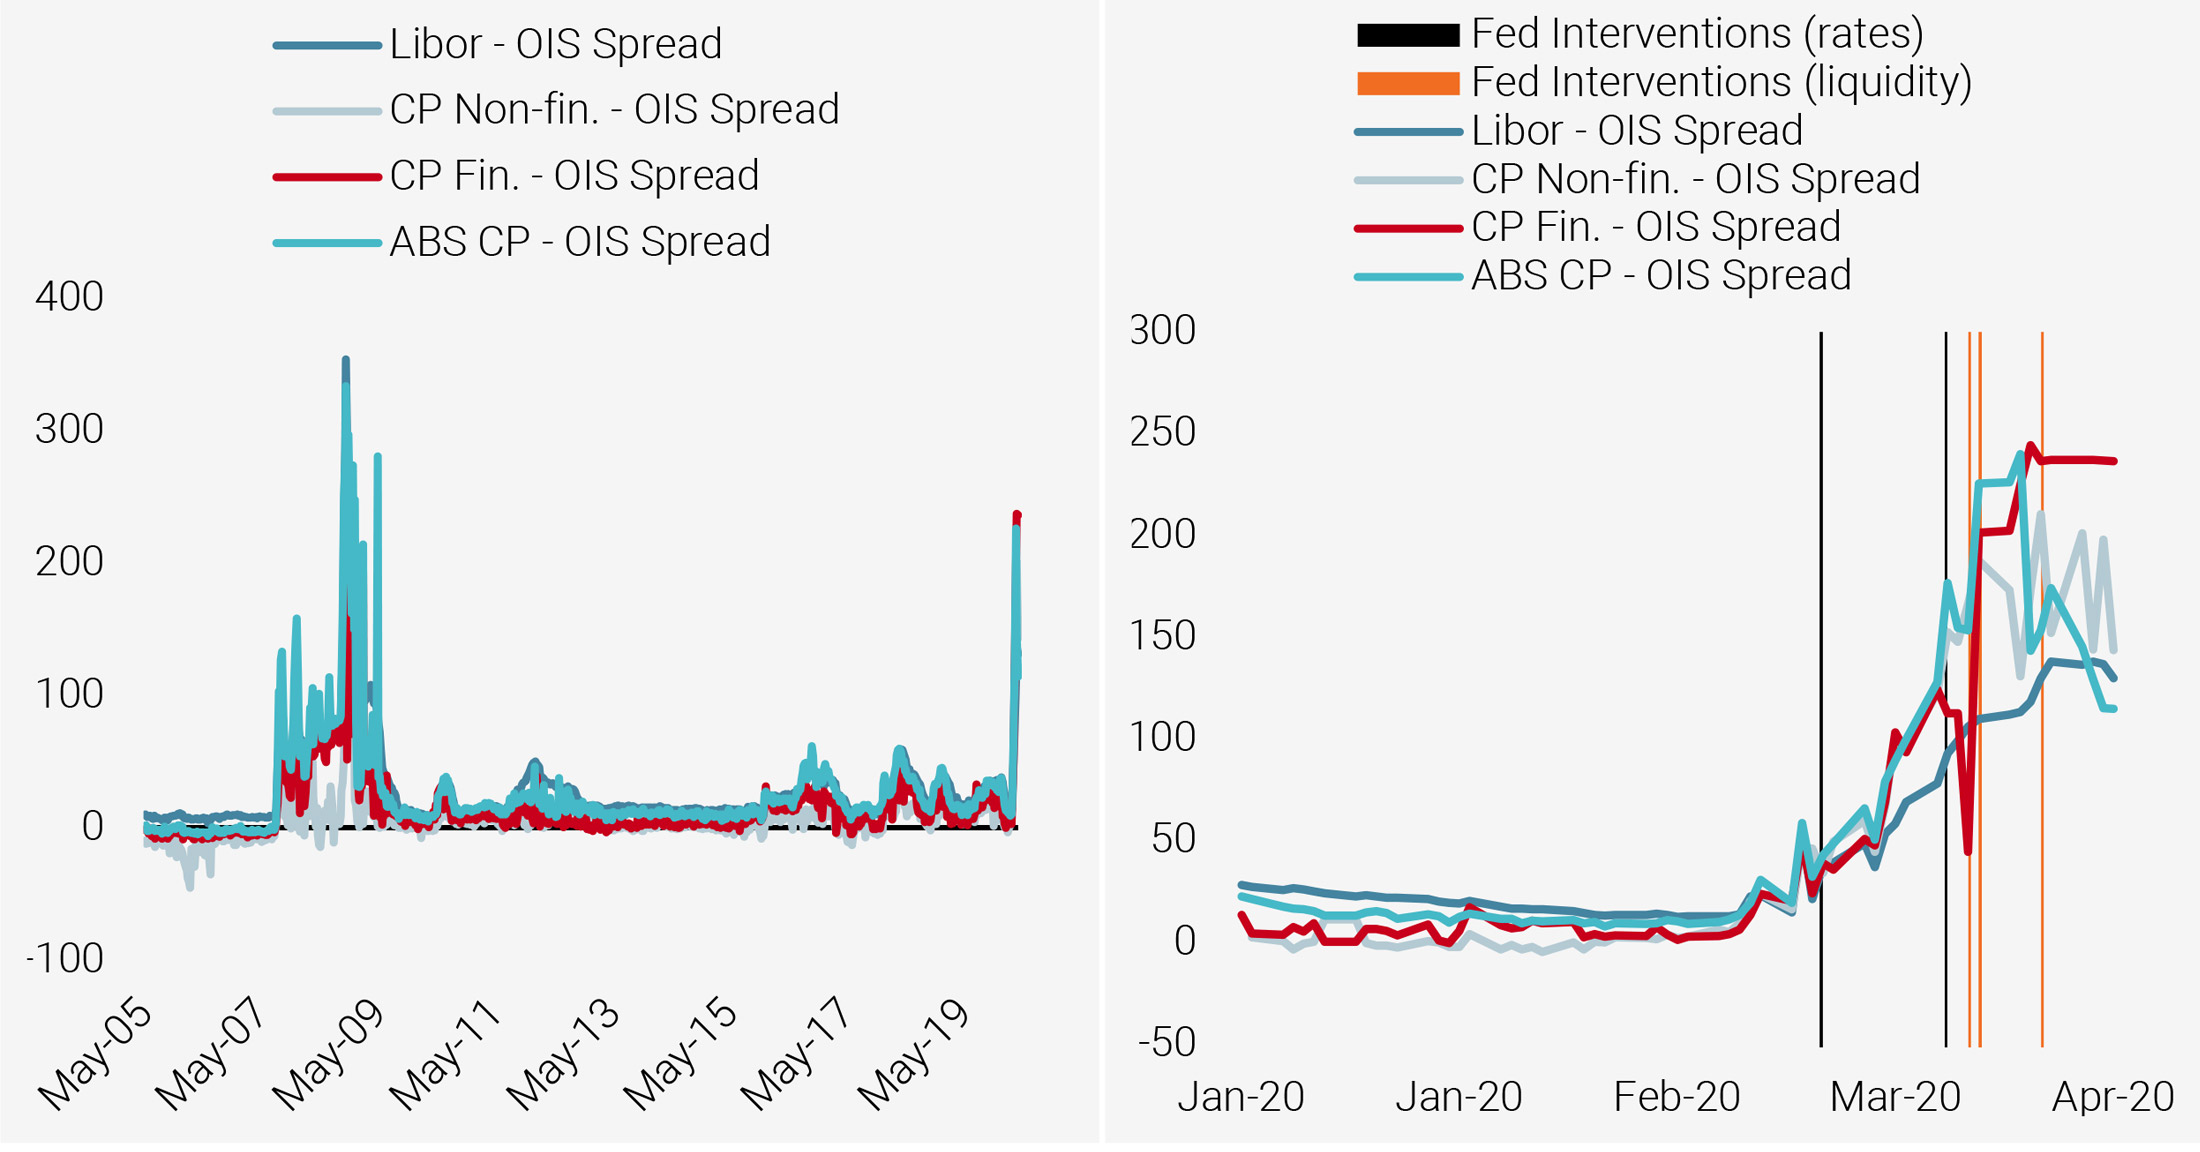
Figure 8 aims to dissect this call for help and then compare it to how the Fed reacted. When looking at cash markets, market observers look at the difference between lending rates and the central bank fixing rate (the OIS swap rates). Figure 8 shows the evolution of these spreads for different cash rates, from Libor to different kinds of commercial paper. Across the month of March, these spreads increased markedly, reaching levels comparable to 2008. This implies a significant premium is required to lend money over short periods, as the near-term default risk of various participants is seen as higher than before and higher than in the future. An echo of this situation is the fact that short-term credit spreads have also reached levels that are higher than those of longer-term bonds. This situation is extremely concerning, as it is a known catalyst of default waves and the Lehman default comes to the fore of everyone’s mind. The Fed had to do something. During the first two weeks of March, the Fed focused on lowering rates in order to bolster economic activity and make sure that the cost of money remained low for the Treasury. However, its focus then changed rapidly. On 17 March, it announced the creation of the Primary Dealer Credit Facility (PDCF). On 18 March, it created a Money Market Mutual Fund Liquidity Facility (MMLF) while coming to the market on the 23 March to announce that it would do whatever it takes to maintain USD liquidity. The asset-backed commercial paper spread did marginally decline after the third announcement, but other spreads remain significantly elevated. For the first time in a long time, Fed action failed to a certain extent to reassure markets.
Compared to 2008, the scale and speed of the Fed reaction was much larger. Yet, three times in a row, the market’s reaction to the Fed showed signs of disappointment. Equity markets rose immediately on the Fed’s announcements before declining around market close. US equities declined by more than 6% on average following the Fed announcements over the past three weeks, while US high yield credit spreads widened by 90 bps. In the meantime, the TED spread has reached 119 bps, a level reached in September 2007 (see Figure 8). We think this liquidity issue is the perfect catalyst for already negative market sentiment. In our tail scenario, this liquidity problem could lead to a domino effect. The Fed and the ECB buying bonds will only provide liquidity for some fixed income markets, leaving other assets in a potential liquidity squeeze, especially investment solutions such as ETFs. This is a crucial path-dependency in the current context: if markets move lower, investors will need to deleverage and demand for liquidity could outstrip supply, further increasing the downside tail-risk. Should this scenario materialise, there is room for an additional downturn across markets with liquidity playing a key role. Central banks are likely to remain centre stage, mainly in order to cushion the magnitude of the potential market shocks that we could see in Q2.
Figure 8: Cash Market Liquidity Indicators over the Long Run (left) and More Recently (right)
Discerning valuation opportunities from traps
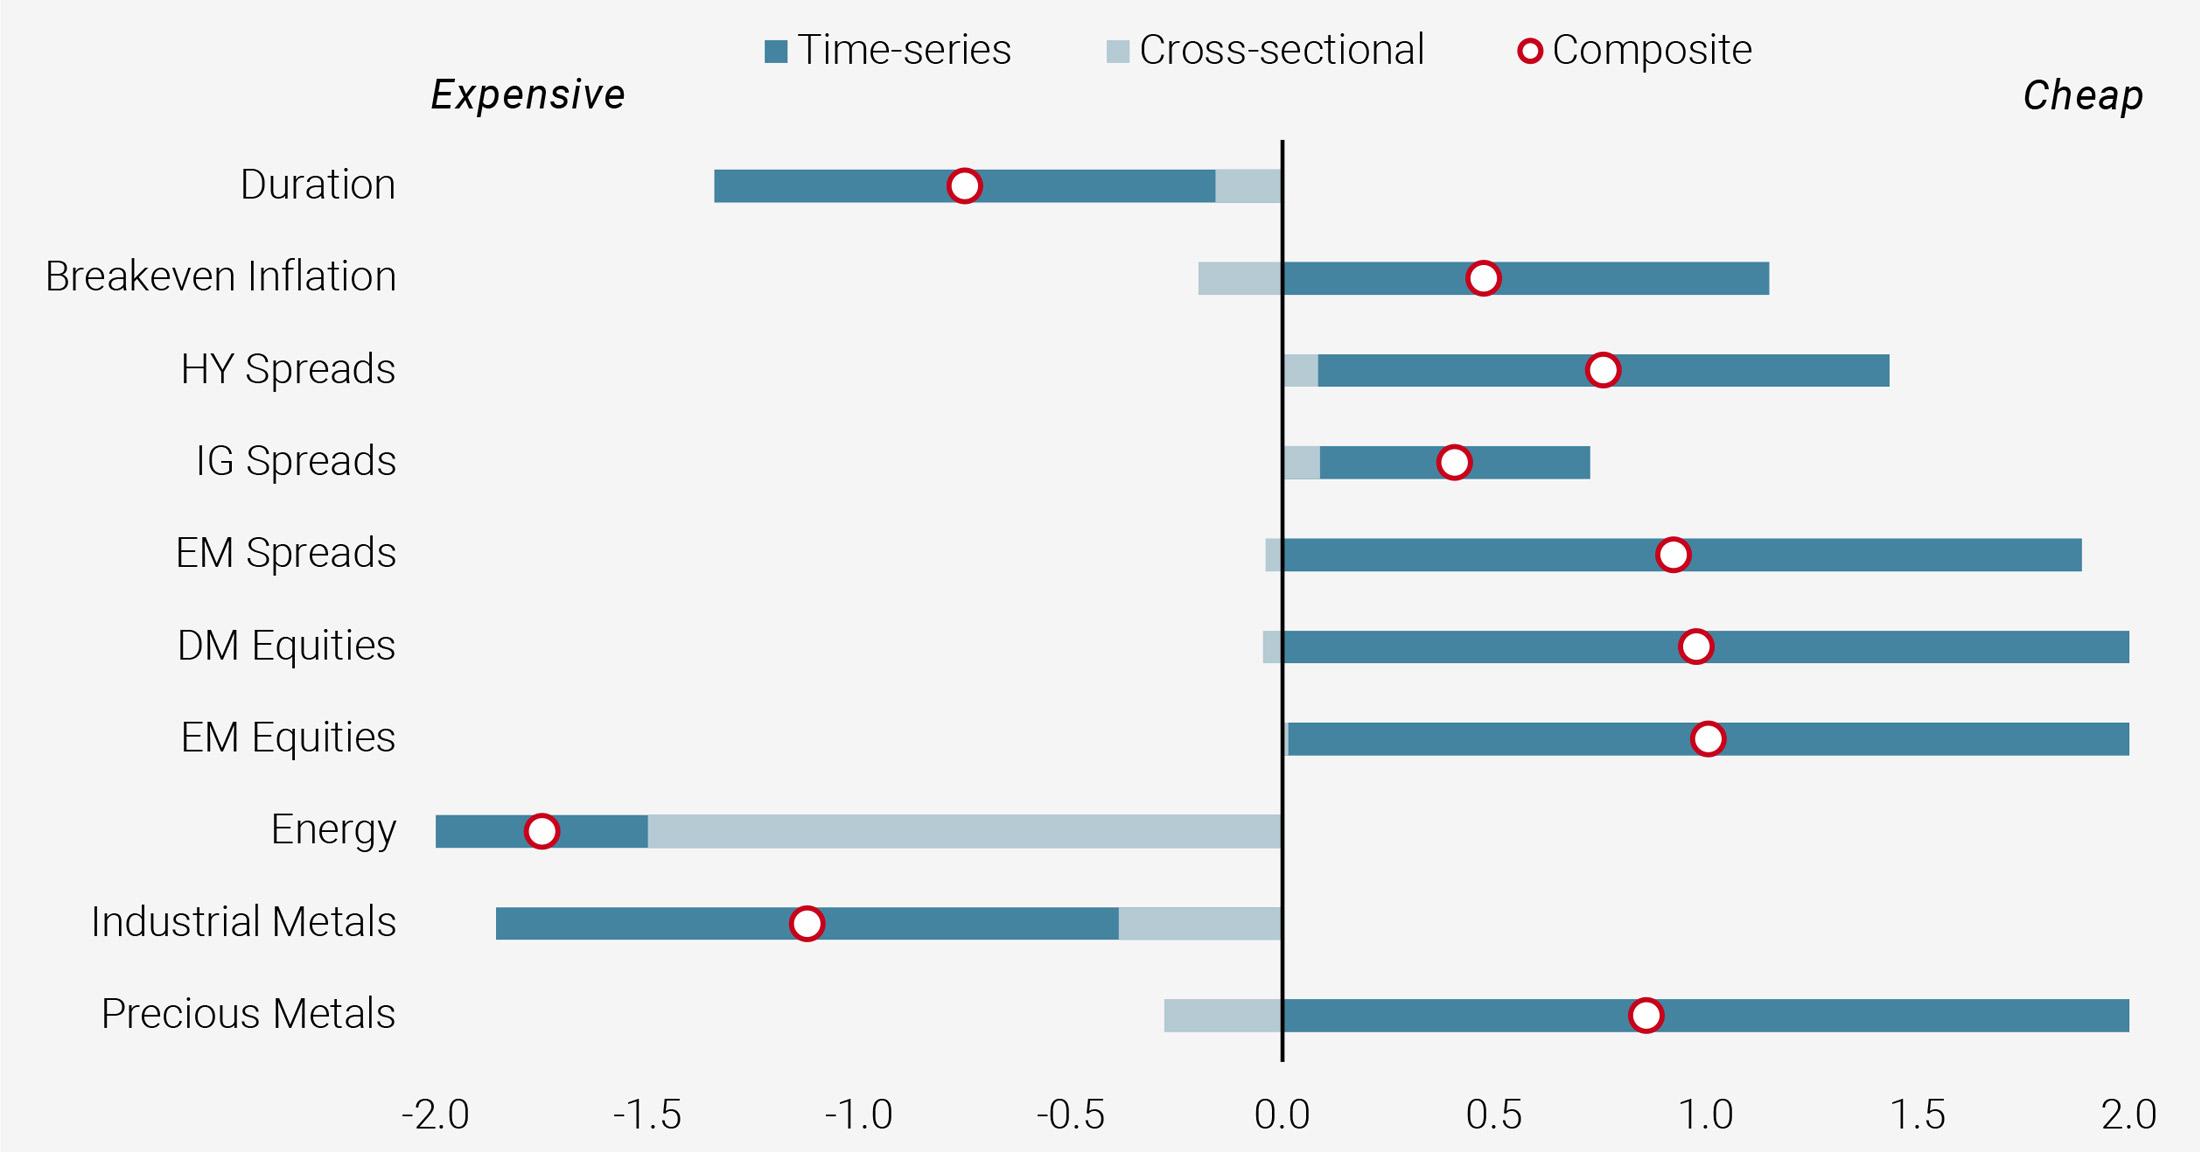
One key dimension that has shown significant improvement since the beginning of the year is valuation. The year started with nearly all assets exhibiting expensive valuations, as measured by carry. After the strong performance of nearly all risk premia in 2019, assets were so expensive relative to their own history that this time-series perspective on valuation offset any relative value opportunities when examining carry from a cross-sectional perspective. However, with the sell-off in growth-oriented assets, there are now clear valuation gaps. Figure 9 summarises the current context from these two perspectives, where we can see how many risk premia are very cheap relative to their own history (as measured by carry).
Figure 9: Risk Premia Valuation Scores (from -2 to +2)
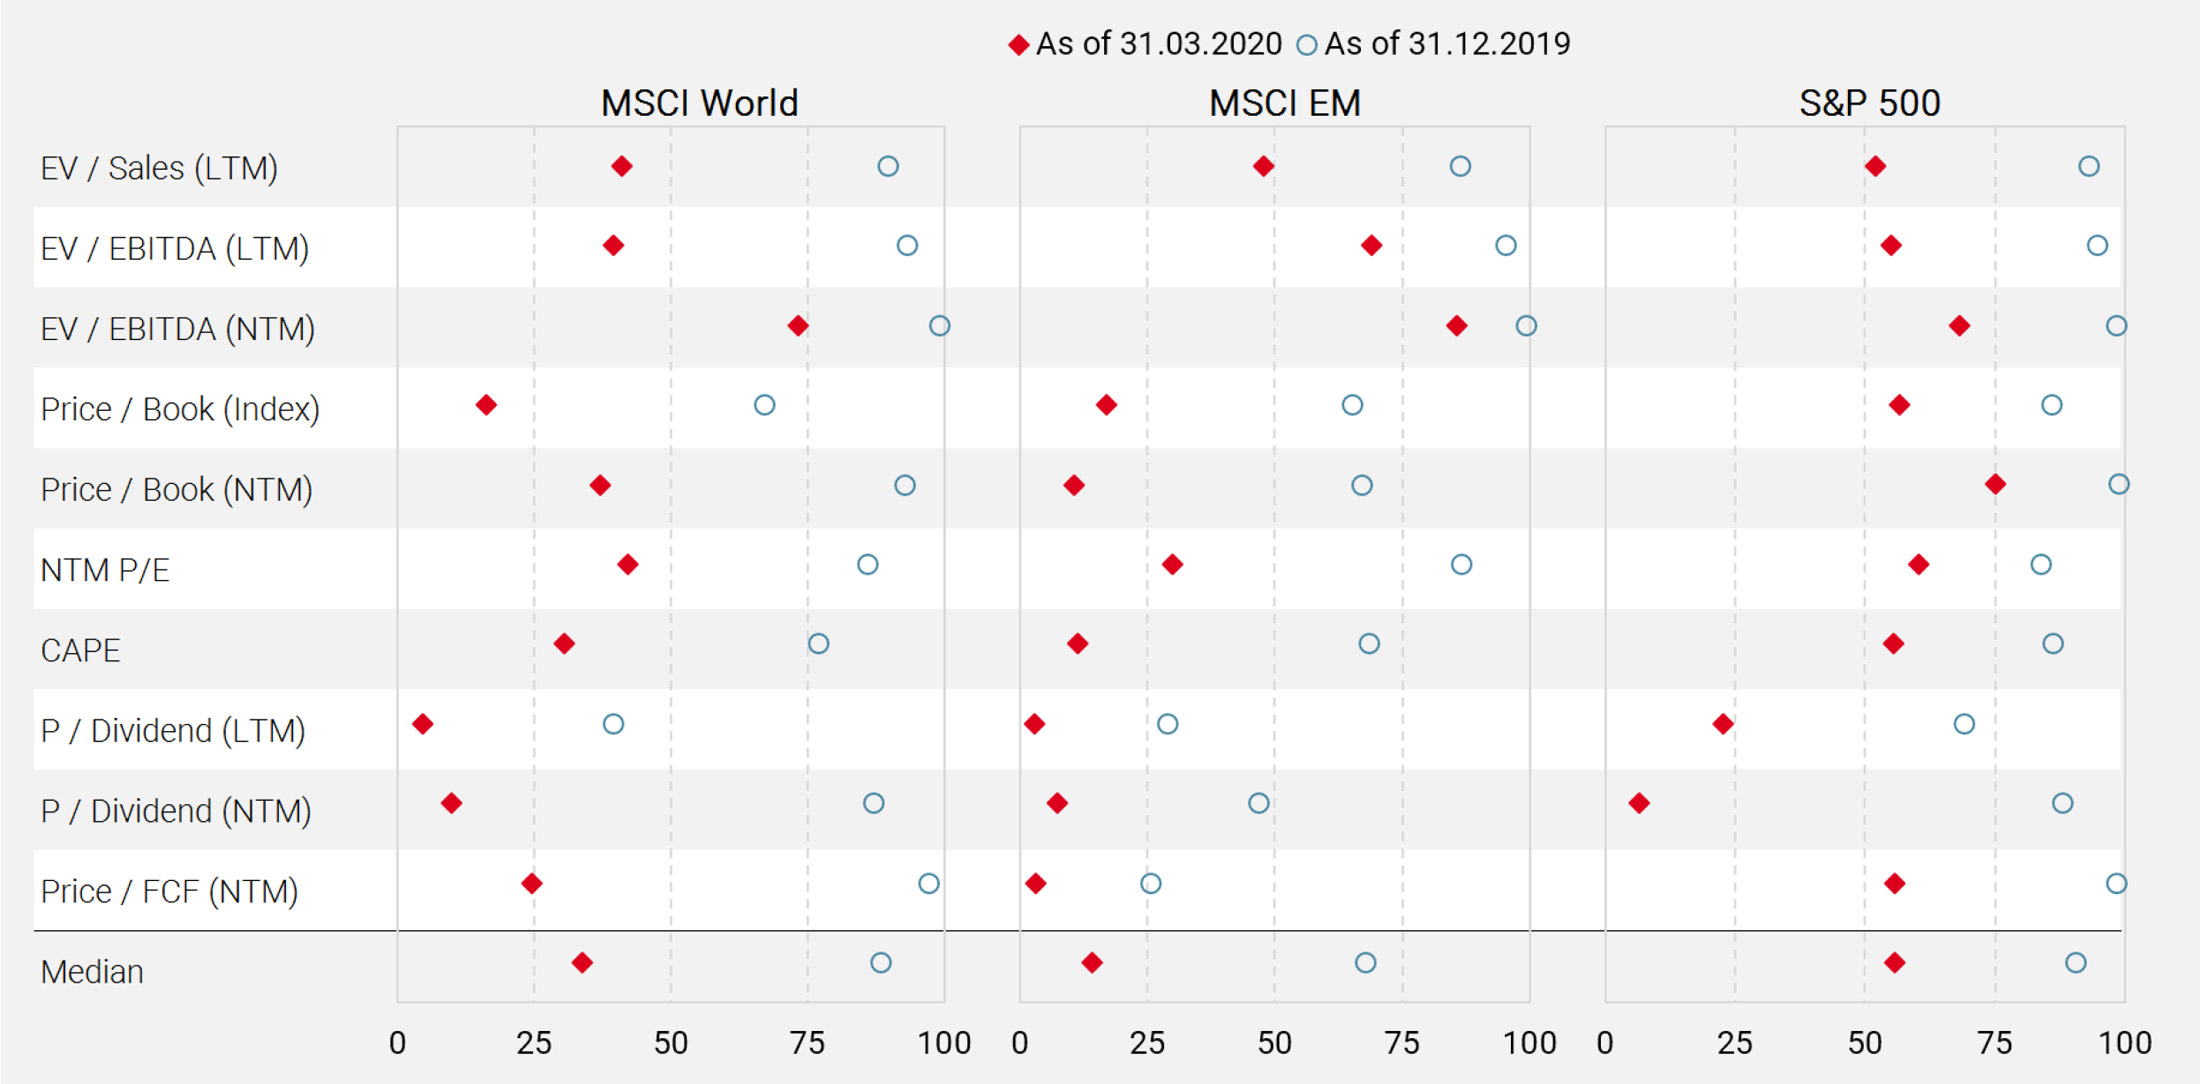
Naturally, given the macro conditions discussed above, it is critical to examine if these are real valuation opportunities and not traps. In the case of equities, it is helpful to consider a range of valuation metrics often considered by investors. Figure 10 shows a few of these measures for developed and emerging market equities, as well as the S&P 500, in terms of historical percentiles in order to make comparisons easier. Whether assessing the value of stocks relative to their sales, earnings, book value, dividends, or cash flows, it is clear they have become less expensive. Indeed, for the broad equity market, the median valuation percentile is solidly below its long-term median. From a purely historical perspective, the expected returns are quite attractive: at these levels, developed equities have delivered an average monthly return of 2.2%, emerging equities 1.1%, and the S&P 500 1.3%.
Figure 10: Historical Percentiles of Equity Valuation Metrics
However, it is important to disentangle the drivers of these valuation metrics. In particular, there has been a significant adjustment of stock prices but many of the corporate fundamentals used to assess these prices either do not yet account for the impact of COVID-19 (since they are backward-looking) or have not been fully adjusted (since analysts are still trying to grapple with the uncertainty of the virus’s impact for forward-looking measures). For example, consider analyst estimates for earnings per share (EPS) growth in 2020, which is used to determine the 12-month forward P/E ratio (Figure 11). While EPS growth estimates have fallen significantly over the last month, they are still pointing to a mild earnings recession of about -6% for developed equities, and -4% for emerging market equities and the S&P 500 for this year. For comparison, at the height of the 2008 crisis, US real GDP contracted by 4% from Q2 2008 to Q2 2009, during which time EPS fell by 31% for firms in the S&P 500 in aggregate. If a similar relationship holds today, under our core scenario of US GDP contracting by 3% this year, EPS would likely fall by over 20% (and over 45% in our risk scenario). We expect that as macro data is released and earnings season kicks off in a few weeks, analyst estimates will be further revised down heavily and investors will begin to ascertain the depth of the slowdown.
Figure 11: Analyst Estimates for 2020 EPS Growth (yoy)
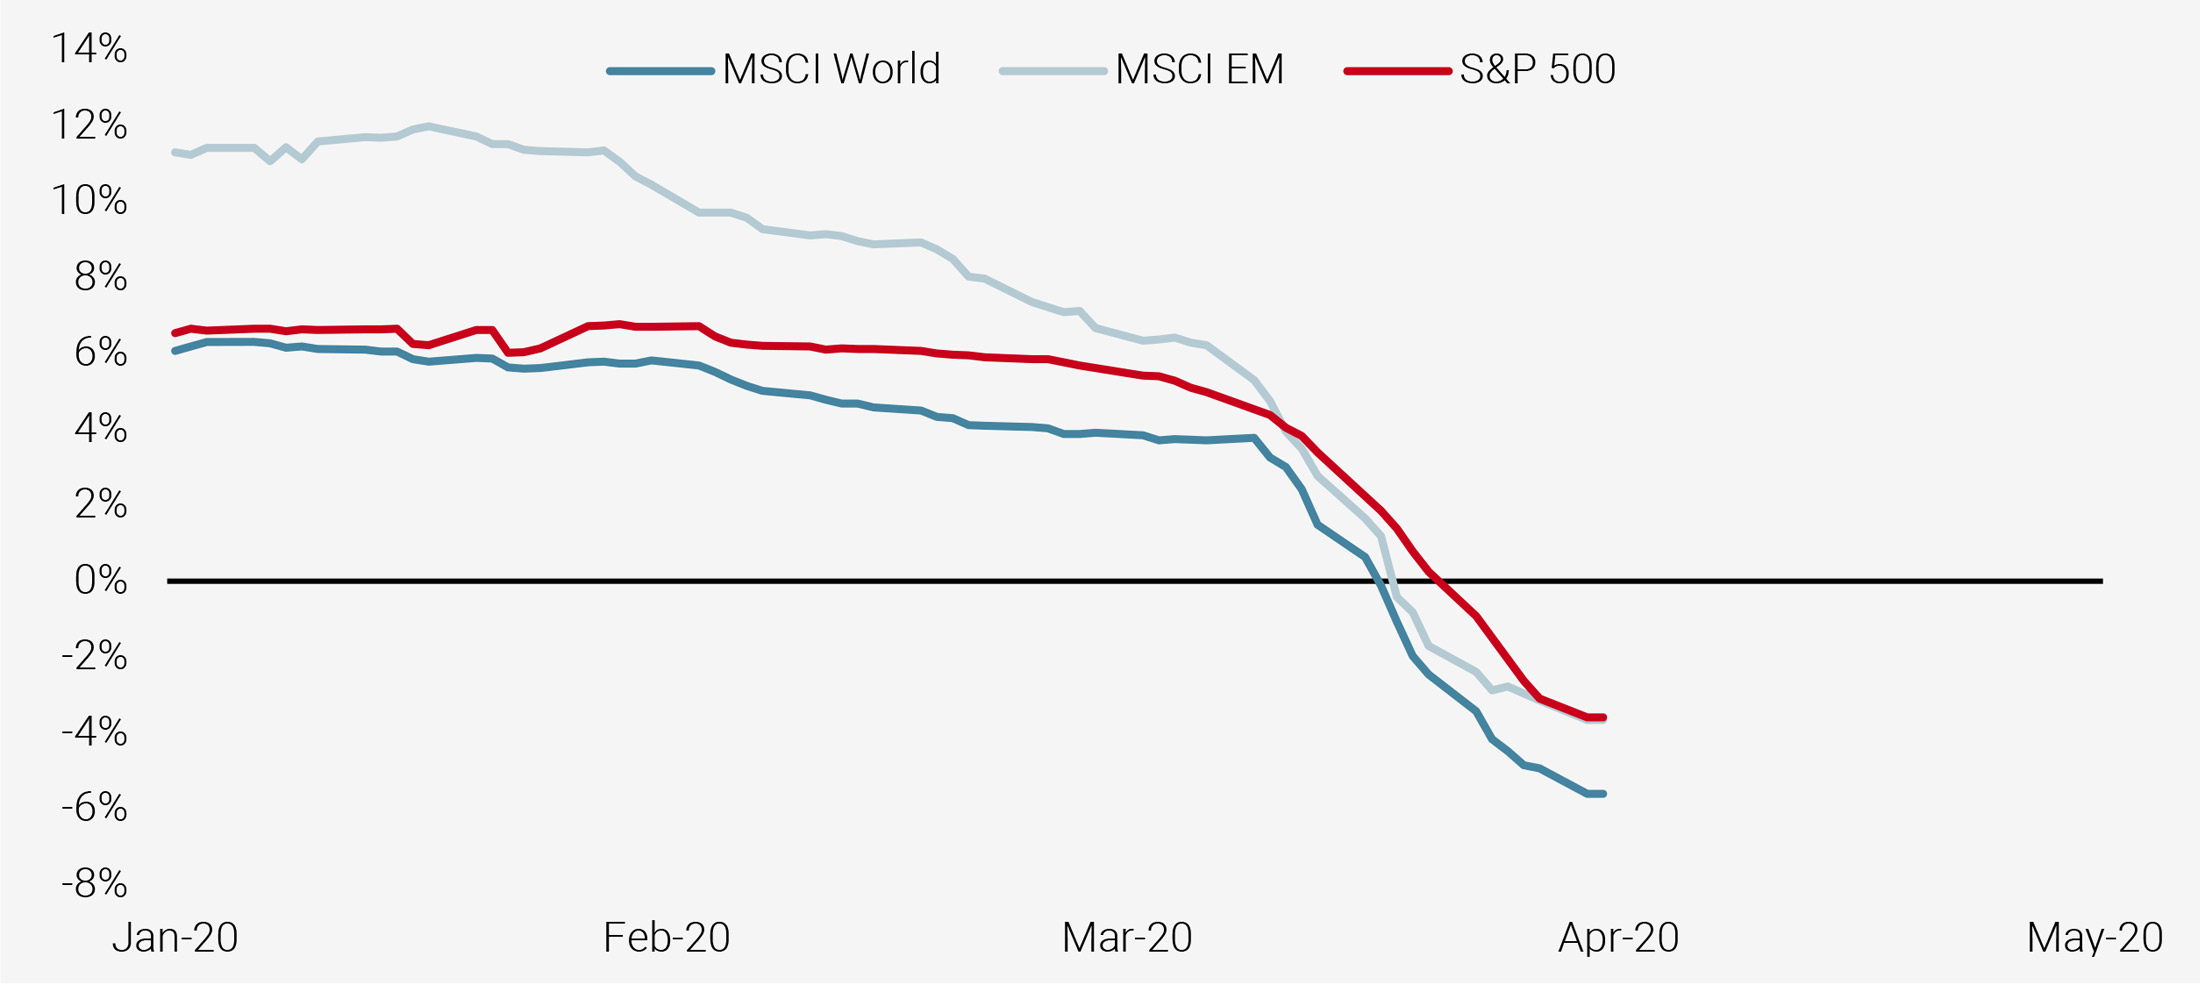
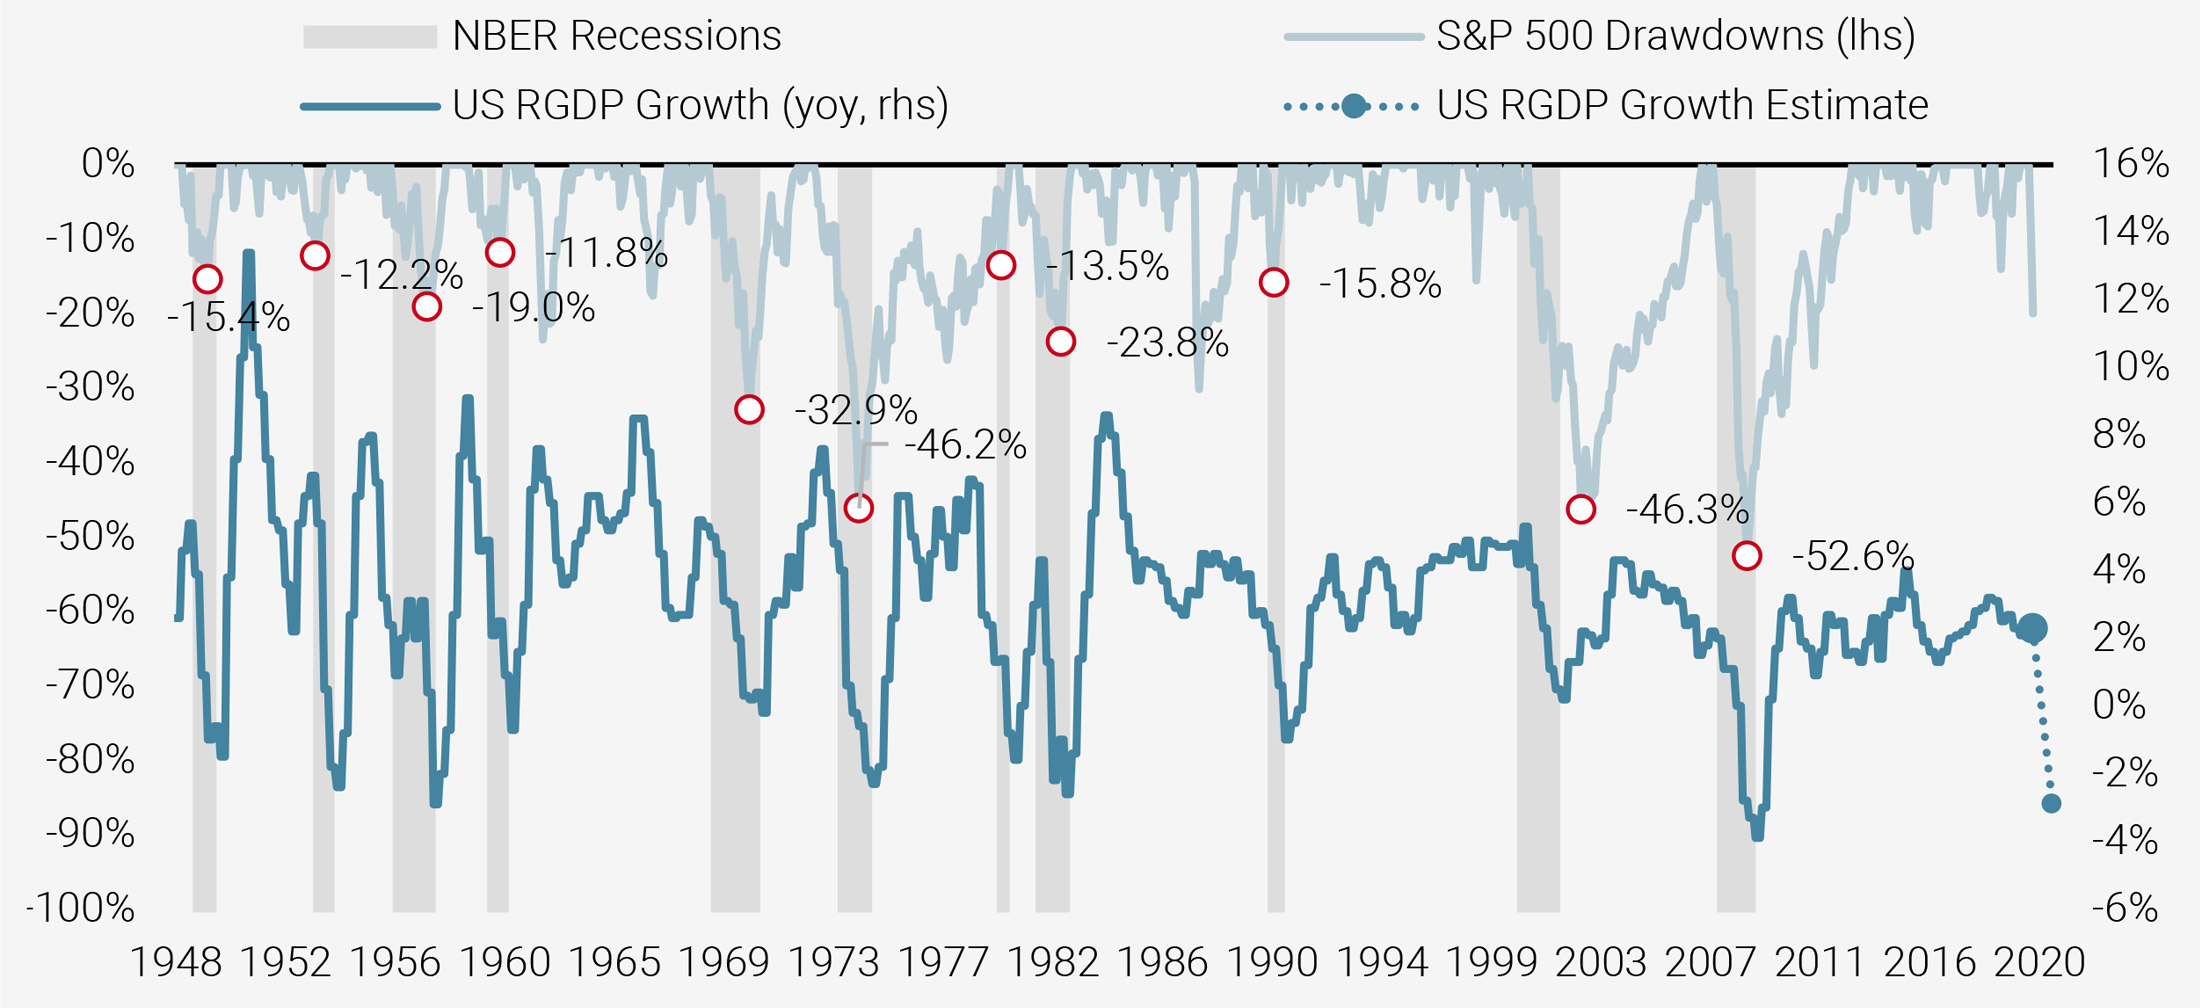
Figure 12 provides a long-term context for the current situation, examining what drawdowns in equity markets look like during recessionary periods. In the chart, we focus on the US in order to get a long historical picture and because many of our concerns for economic growth are centred on the US. As the chart shows, the immediate post-World War II period saw large swings in growth as the economy regained its footing. Equity drawdowns remained relatively mild, however: sentiment was strong during the 1950s as investors looked ahead to a stable future. Indeed, the S&P 500 was able to avoid a bear market until 1970, when a nearly decade-long expansion ended. Since then, there have been a couple of short-lived recessions (early 1980 and late 1990) with mild equity drawdowns. However, most of the remaining recessions (1973-1974: end of Bretton Woods and oil crisis; 1981-1982: Volcker rate hikes to fight inflation, 2001: tech bubble-burst, 2007-2009: GFC) saw significant sell-offs that make the recent 34% peak-to-trough on the S&P 500 seem relatively sedate. It is these additional perspectives on valuations that make us hesitant to capitalise on the significant re-rating of equities. Until earnings expectations fall to more realistic levels, prices correct further, or there is a clear improvement in the spread of the virus, we view equity valuations to be more likely a trap than an opportunity at this point.
Figure 12: S&P 500 Drawdowns during US Recessions
Similar to equities, corporate credit spreads are now exhibiting attractive valuations based on historical patterns. Figure 13 puts the level of spreads into perspective, demonstrating how, ordinarily, these levels would point toward attractive risk-reward, at least based on history (high hit ratios, large carry to harvest, and attractive returns beyond carry).
Figure 13: Credit Spread Metrics
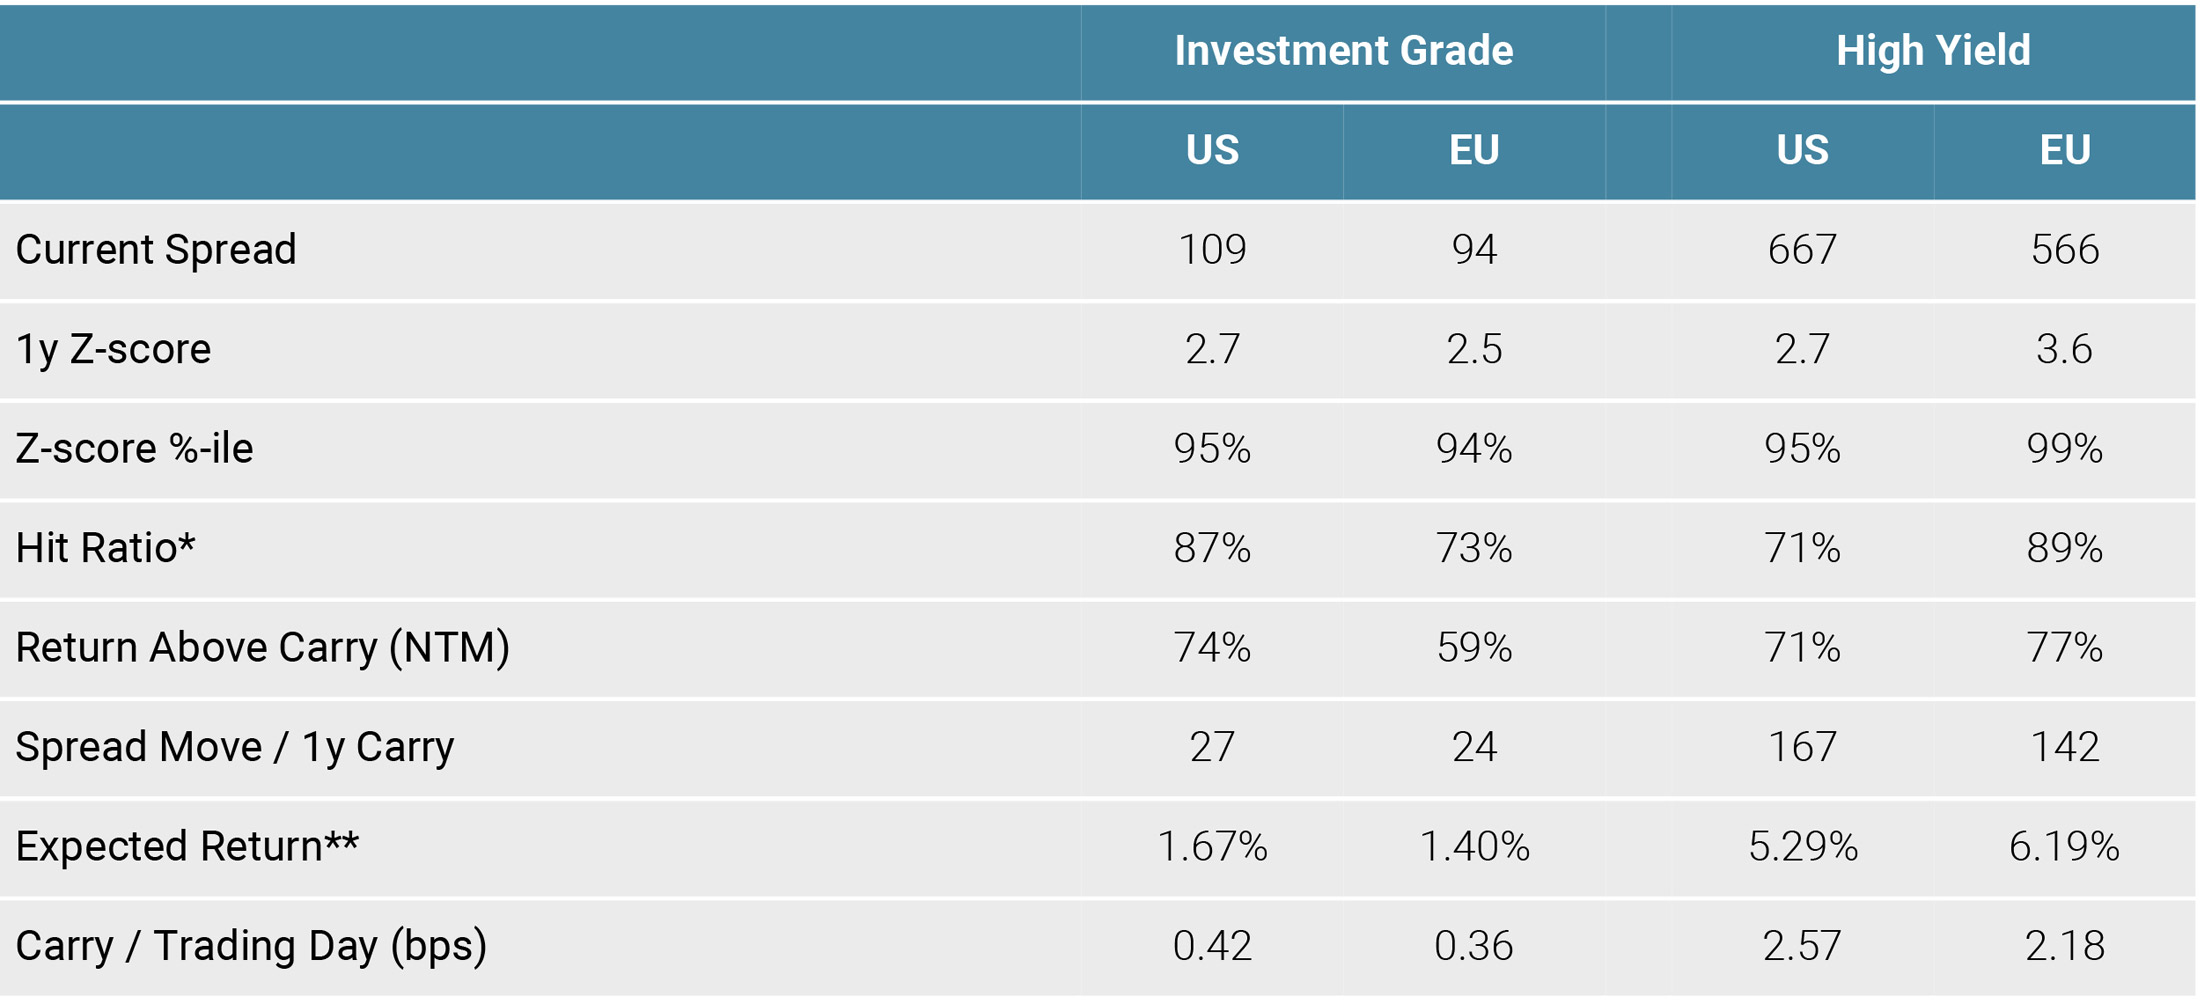
** Weighted average historical distrubtion of 1y forward returns from current spread levels
Source: Bloomberg, Unigestion, as of 31.03.2020
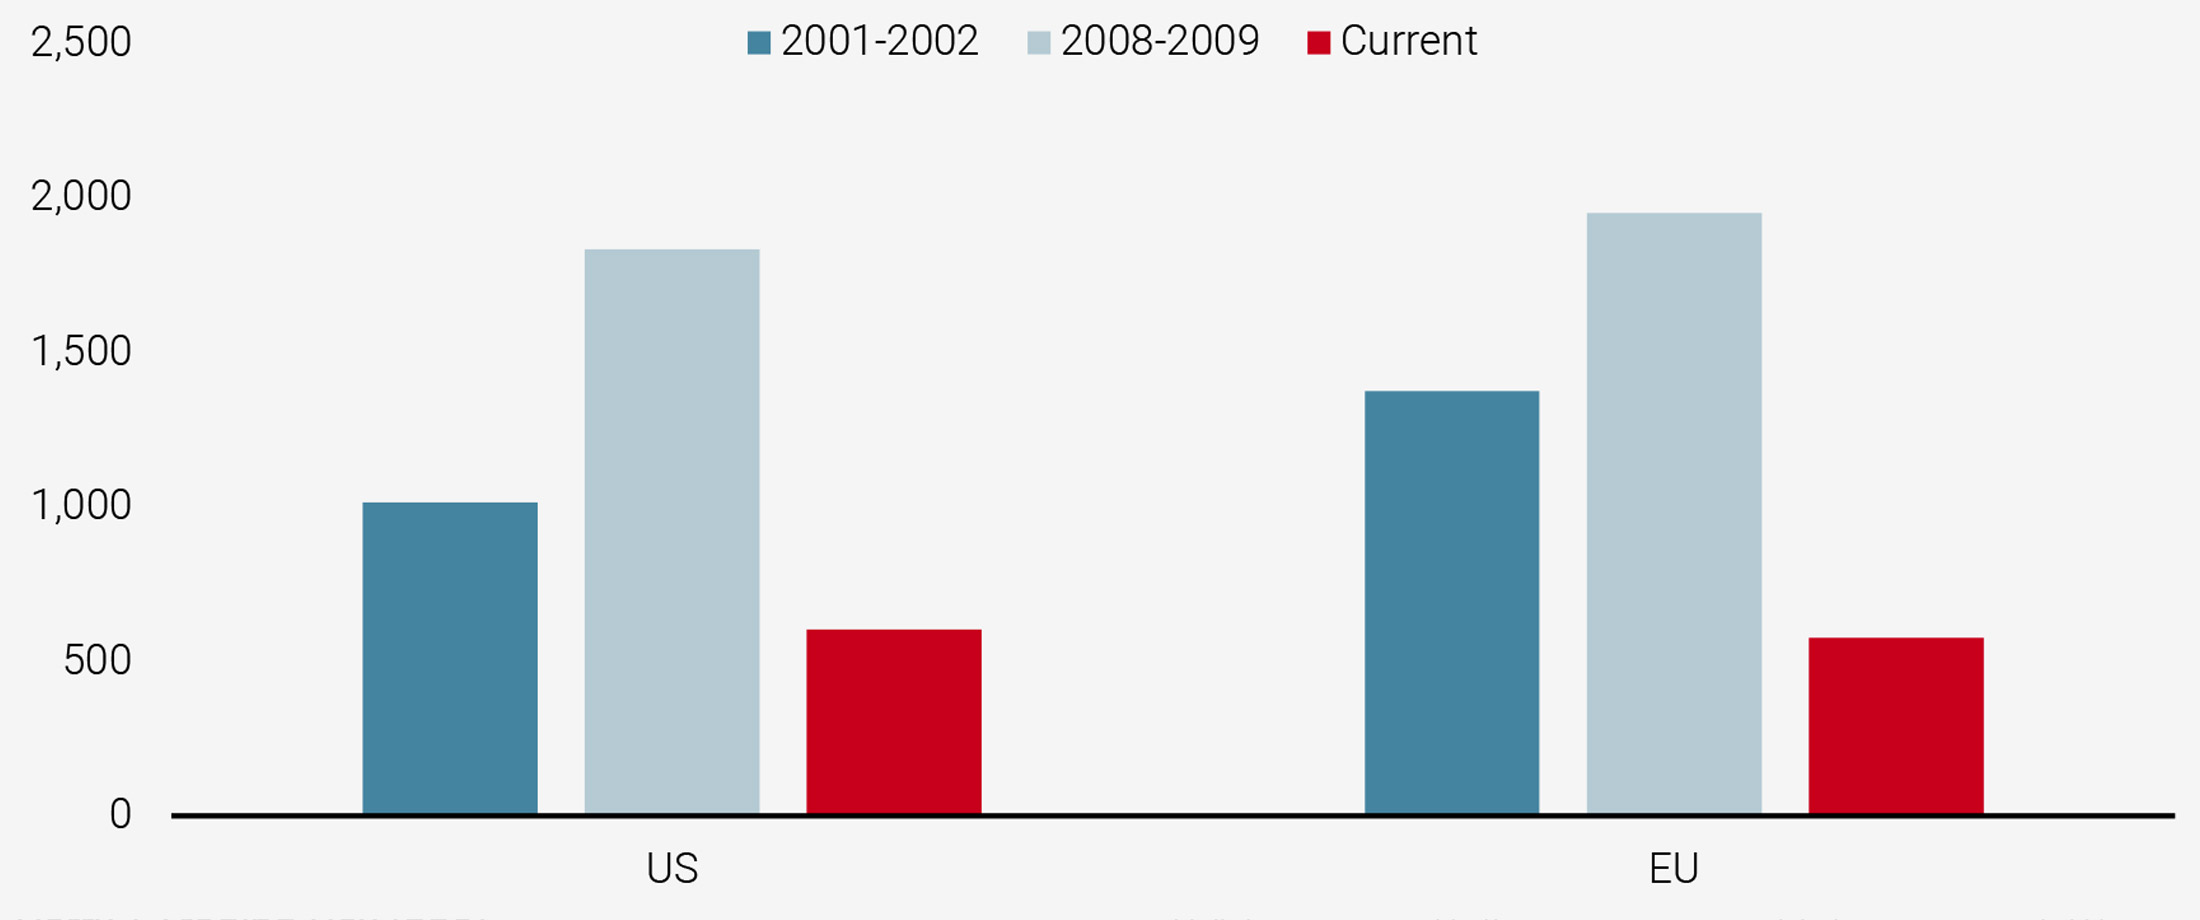
However, overlaying the current macro context also raises the question as to whether this is an opportunity or a trap at this point. As illustrated in Figure 14, high yield spreads in the US and Europe peaked much higher during previous recessions than their current levels, suggesting that, despite the spread widening we have seen thus far, credit markets are still not fully pricing in the economic slowdown that is hurtling toward the global economy.
Figure 14: High Yield Credit Spreads (peak during 2001-2002 and 2008-2009)
Too early to be positive
In conclusion, when balancing the three sides of our dynamic investment process, we see a risk (the macro situation), a tail-risk (volatile and liquidity-dependant market sentiment) and a potentially deceptive set of opportunities (valuations). Our dynamic allocation entering into this quarter is defensive: our core scenario is that most people underestimate the consequences of the COVID-19 recession. This macro element is the number one reason for our pessimism: we think that markets are too optimistic in their perception of the impact of the lockdowns on the real economy. We notably expect earnings contraction to undershoot current, overly optimistic projections and believe high yield spreads to be at risk. This underestimation combined with sentiment could push markets down to lower levels, as the ability of central banks to prevent these drops is clearly in question. We expect to see better valuation opportunities ahead as we believe our macro scenario will be confirmed by the data. Over the upcoming quarter, we expect to keep an underweight to equities and high yield bonds, while being more constructive on investment grade bonds for three reasons. First, we expect markets to show greater discrimination for higher quality assets at the expense of higher beta assets. Second, central bank asset purchase programmes of investment grade bonds should support the market. Third, when combining both the previous elements, the risk-reward in investment grade markets has clearly improved. The failed attempts of the Fed to soothe markets and very low yields lead us to expect disappointing performance from government bonds should we see another round of market declines.
We will become more constructive when we see three triggers: (1) an improved health/macro situation, (2) a convincing fiscal/monetary response, and (3) attractive valuations based on realistic expectations. None of these conditions are in place today, and so we remain defensive.
Important Information
This document is provided to you on a confidential basis and must not be distributed, published, reproduced or disclosed, in whole or part, to any other person.
The information and data presented in this document may discuss general market activity or industry trends but is not intended to be relied upon as a forecast, research or investment advice. It is not a financial promotion and represents no offer, solicitation or recommendation of any kind, to invest in the strategies or in the investment vehicles it refers to. Some of the investment strategies described or alluded to herein may be construed as high risk and not readily realisable investments, which may experience substantial and sudden losses including total loss of investment.
The investment views, economic and market opinions or analysis expressed in this document present Unigestion’s judgement as at the date of publication without regard to the date on which you may access the information. There is no guarantee that these views and opinions expressed will be correct nor do they purport to be a complete description of the securities, markets and developments referred to in it. All information provided here is subject to change without notice. To the extent that this report contains statements about the future, such statements are forward-looking and subject to a number of risks and uncertainties, including, but not limited to, the impact of competitive products, market acceptance risks and other risks.
Data and graphical information herein are for information only and may have been derived from third party sources. Although we believe that the information obtained from public and third party sources to be reliable, we have not independently verified it and we therefore cannot guarantee its accuracy or completeness. As a result, no representation or warranty, expressed or implied, is or will be made by Unigestion in this respect and no responsibility or liability is or will be accepted. Unless otherwise stated, source is Unigestion. Past performance is not a guide to future performance. All investments contain risks, including total loss for the investor.
Unigestion SA is authorised and regulated by the Swiss Financial Market Supervisory Authority (FINMA). Unigestion (UK) Ltd. is authorised and regulated by the UK Financial Conduct Authority (FCA) and is registered with the Securities and Exchange Commission (SEC). Unigestion Asset Management (France) S.A. is authorised and regulated by the French “Autorité des Marchés Financiers” (AMF). Unigestion Asset Management (Canada) Inc., with offices in Toronto and Montreal, is registered as a portfolio manager and/or exempt market dealer in nine provinces across Canada and also as an investment fund manager in Ontario and Quebec. Its principal regulator is the Ontario Securities Commission (OSC). Unigestion Asia Pte Limited is authorised and regulated by the Monetary Authority of Singapore (MAS). Unigestion Asset Management (Copenhagen) is co-regulated by the “Autorité des Marchés Financiers” (AMF) and the “ Danish Financial Supervisory Authority” (DFSA). Unigestion Asset Management (Düsseldorf) SA is co-regulated by the “Autorité des Marchés Financiers” (AMF) and the “Bundesanstalt für Finanzdienstleistungsaufsicht” (BAFIN).
Document issued: April 2020.