MiViews Q3 2020: The Recovery Is Not Priced In Yet
- Macroeconomic data points to accelerating economic improvement from here.
- A lower discount rate, rather than earnings growth, explains much of the rally thus far.
- Investor positioning remains cautious and markets have yet to fully price in a recovery.
- We see two key risks in our recovery thesis: the Q2 earnings season and the US election.
Overview
Triggered by lockdown measures, the current recession is unique in several key ways, but governments and monetary policy makers contained it quickly and efficiently. Their collective response has effectively dealt with a large part of the left tail risk – i.e., defaults and liquidity droughts – leading markets to respond positively. Credit spreads have tightened, equity prices have increased and liquidity has markedly improved.
However, when we look at financial markets, we struggle to find any pricing of the recovery itself: we see the recovery in macro data, but not yet in market data. In the coming quarters, we expect to see this pricing materialise, although we think this is unlikely to be linear: the period we are experiencing is unusual and markets are averse to surprises.
This staircase-shaped recovery will likely be a bumpy ride, with episodes of volatile consolidation alternating with periods of positive returns for growth assets. The macro recovery should continue, investor positioning should broadly become pro-growth while valuations are cheaper than the consensus view. To investors, we say: keep your positive bias for growth assets as we have not yet seen the full extent of the recovery.
The World Economy is Recovering
Over the last quarter, macro data has consistently pointed towards a recession. Economic conditions remain precarious but we think investors’ attention should be focused on what is ahead. What matters now is the pace with which we will exit this recession because the rate of this recovery will likely drive the macro side of a portfolio’s allocation. “V”, “W”, “square root”: what recovery shape will play out? We think the answer lies in the data.
Our proprietary Growth Nowcasters are essential for assessing the potential shape of the recovery. These indicators gather a large cross section of data at a country level, focusing on what is typically indicative of a recession in all the economies that we monitor. During the past quarter, we have seen a large and broad-based decline in the underlying economic time series of these indicators. At the end of March, 67% of the data was declining, with limited disparities. In the US, this number reached 78%, 82% in the Eurozone and 58% for China. The bulk of this decline is due to a deterioration in developed economies, with emerging economies either lagging (Latin America) or leading (East Asia).
What we are currently observing is the reversal of this negative trend, and we see three noteworthy elements in this reversal.
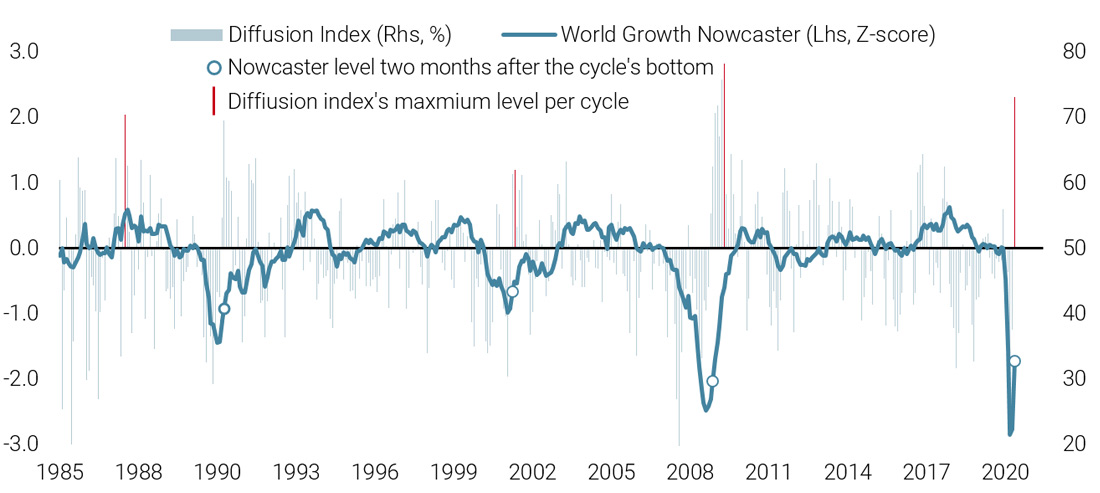
First, as per the data, the recovery thus far has been as rapid to the upside as it was to the downside. In early June, 74% of the 1,300 economic data constituents that comprise our indicators were on the rise, a symmetric movement to what we observed on the way down. This symmetry is not limited to the diffusion index of our indicators. As shown on Figure 1, our World Growth Nowcaster is rising almost as fast as it dropped. Also, the pace of the increase two months after the macroeconomy’s trough is the fastest observed in 30 years – Figure 1 makes this point very clear. This is a first step towards a V-shape recovery: both the breadth and the scale of the improvement are pointing in that direction.
The fact that this improvement trend is corroborated by other independent data sources makes it more credible. It follows indications coming from a wide spectrum of higher frequency data. Our proprietary “Newscaster”, a media news flow indicator, has shown early signs of improvement since the end of March that have gained momentum since then. The indicator has sent a more cautious message as the growth rate of the pandemic has increased but remains higher than two months ago. As of the beginning of July, its message is more positive.
Our Inflation Nowcasters, another consistently improving element, are also on the rise again. According to these indicators, inflation surprise risk has moved from very low to a more neutral level. This recovery reflects not just the partial normalisation in the price of energy commodities, the most macro-sensitive components of inflation – namely wage growth and capacity utilisation rates – have also embarked on this improvement trend. In the US, the Atlanta Fed’s Wage Growth Tracker index moved from 3.3% yearly growth in March to 3.5% in May. The US capacity utilisation rate crept up from 64% to 64.8% and Europe has broadly followed a similar evolution, according to European Commission surveys. High frequency data and inflation data are therefore pointing in the same direction as growth data: the worst is behind us, while the economic recovery looks rapid.
Figure 1: World Growth Nowcaster and Diffusion Index
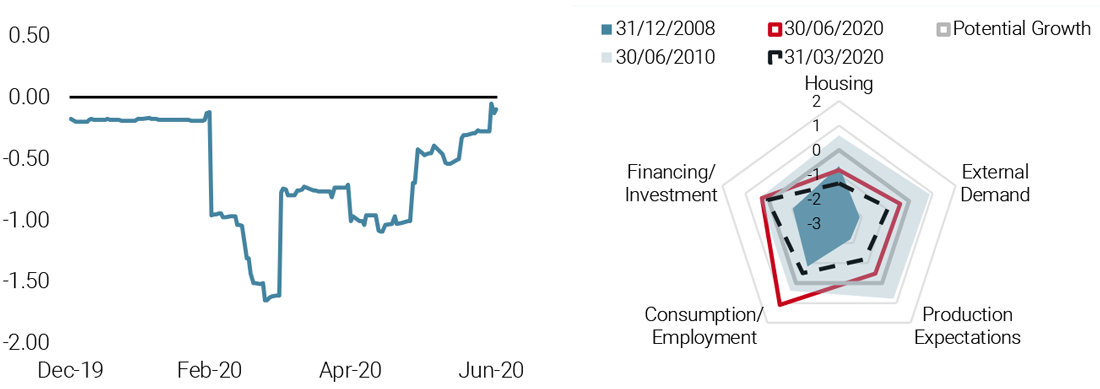
The second element is what we are seeing in our Chinese Growth Nowcaster. China was the first country to enter into a lockdown and the first to exit from it. The country showed an extreme deterioration in its data flow, captured with a lag in our indicators (see Figure 2). Currently, China’s economy appears to have fully normalised, as shown on the left hand chart. Looking at the underlying data, any imbalances in the recovery look limited from the decomposition shown in the right-hand part of Figure 2. Consumption has made a strong recovery while Production Expectations are now nearing their neutral level (“Potential Growth”). The Financing/Investment component gathers different data to measure the stimulation plans introduced by the central government. This component has been essential for the Chinese economy to survive the lockdowns and remains a positive factor for now.
Figure 2: Chinese Growth Nowcaster and Its Decomposition
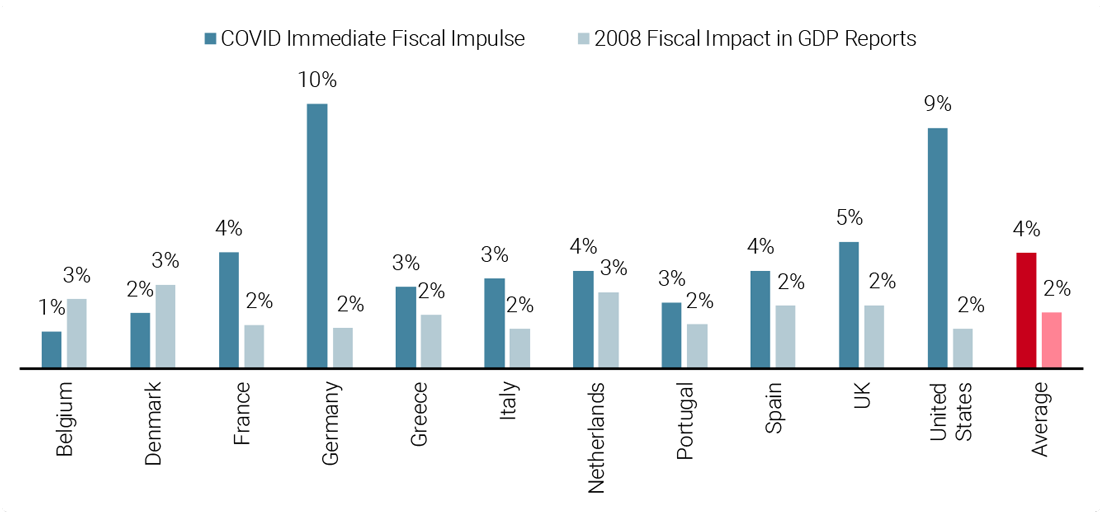
The third element that gives us confidence in the continuation of the recovery is the scale of fiscal and monetary stimulation. Much has already been said about the actions of central banks: they acted – essentially led by the Fed – fast and furiously to limit tail risks in the economy and in markets. What will make a difference now is fiscal policy. Figure 3 draws a comparison between the fiscal stimulus deployed in 2008 and the stimulus that has been pledged by governments to deal with the lockdown shock. On average, numbers are twice those injected in 2008. These two shocks can hardly be compared given their different nature and scale, but we believe this strong commitment will be essential for reducing a large portion of the left tail risk and increasing the likelihood of a swift recovery.
Figure 3: Governments’ Response to the Covid’19 Crisis Compared to 2008 (% GDP)
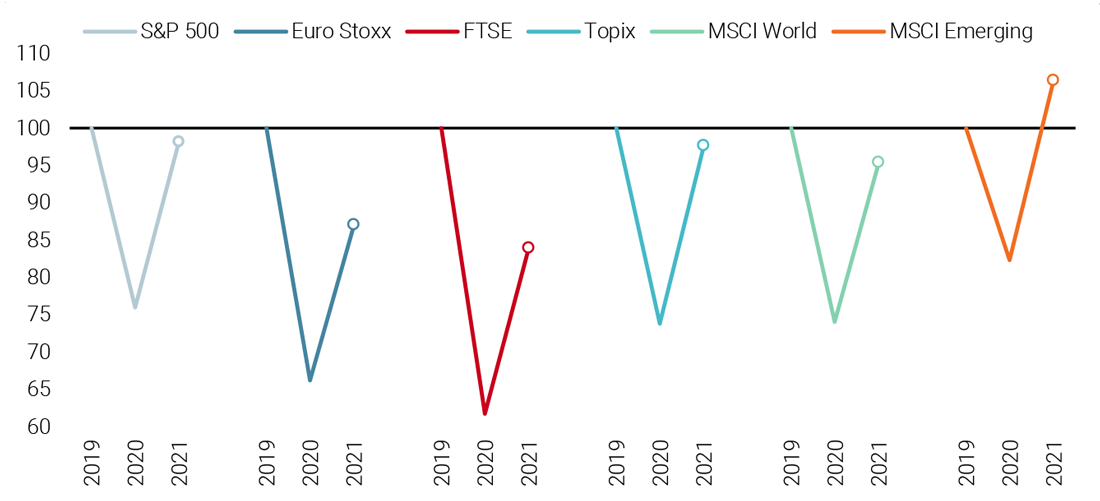
We are not the only ones expecting this type of a rapid recovery. When looking at equity analyst expectations for 2020-2021 earnings, the picture is the same. As detailed in Figure 4, analysts are expecting a V-shaped recovery, albeit with a certain degree of heterogeneity. In the US, earnings are expected to be back up to their 2019 levels by 2021. In emerging markets, this recovery is expected to happen before the end of 2021. Less surprising, firms in Europe, Japan, and the UK are expected to need more time to complete their turnaround. By and large, we agree with this economic scenario.
For now, it is at odds with the scenario of economists working for private and public entities. For the US, private economists (as per Bloomberg’s poll) expect this recovery to happen by 2022, not 2021. In Europe, GDP growth from 2020 to 2022 should remain negative (-1.2% cumulated growth over three years). To some extent the ECB is more positive than this, expecting the cumulated growth over these three years to sit at around 0%, similar to the Fed which expects +2% real growth between 2020 and 2022 in the US. The difference between this promising earnings growth scenario and the GDP growth one could come from margins, which should be supported by firms’ cost control measures.
Figure 4: Earnings Recovery Expected by Analysts
Overall, our expectations are more positive than these forecasts for now, given the breadth of the recovery. We expect a GDP recovery by the end of 2021 in the US, while the Eurozone should have normalised before the end of 2022. We think this scenario is supported by the breadth of the recovery in the data, the extent of the recovery already seen in China and the potential size and scale of pledged fiscal stimulation.
Do we expect this recovery to be a straight line? No, we do not, for a number of reasons. Local lockdowns could harm regional economies temporarily. In the US, savings still amount to 23% of disposable income. Consumer surveys are still at low levels in spite of their improvement. This implies that the second leg of this V-shaped scenario that we expect will probably take a shape closer to that of a staircase, with periods of low growth combined with acceleration periods. In the end, we are still expecting a fast and significant economic improvement and we are more positive on the macro front than the consensus.
However, a puzzle remains: the left tail risk has clearly been mitigated by stimulus and the recovery is now taking shape. Markets have rallied and yet they remain short of pricing in a recovery: we still see pockets of pessimism and we think their reversal will act as a driving force over the next quarter.
The Sentiment Puzzle
At the trough of the current market shock, the price of hedging derivatives (volatility and CDS) reached very high levels. This reflected the very concerning left tail risk that hung above investors’ heads: the risk of large-scale defaults and more severe dividend cuts, with liquidity drying up across markets. As central banks and governments stepped in, this risk of a systemic collapse fell. As a result, the valuations on hedging instruments that reflected this systemic risk premia were trimmed.
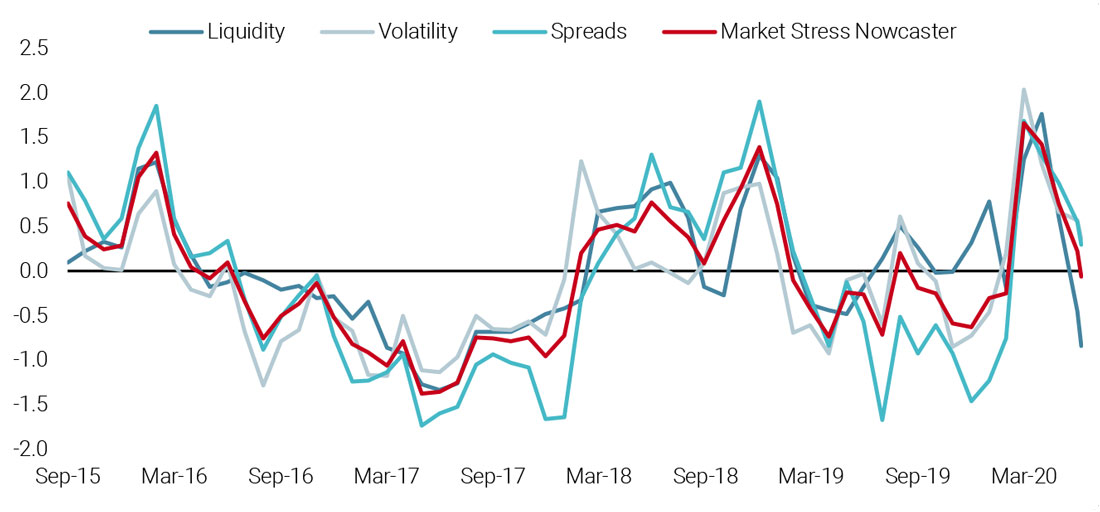
Our Market Stress Nowcaster tracked these different phases, as illustrated in Figure 5. The liquidity, credit spreads and volatility components all picked up at the start of the crisis. Following multiple interventions, systemic risk came under control and volatility and spreads came down. Slightly later, the liquidity premium itself improved. For now, as shown in Figure 5, all three components have clearly improved. Our aggregated Market Stress Nowcaster – the combination of all three elements – has come down from the 2-3 standard deviation zone to a zero level. This zero level means a neutral level for market stress risk. The normalisation of risks led investors to decrease their hedging demand, but not to the extent of pricing the recovery itself.
By way of comparison, in Figure 5, the 2017 period was a period of solid economic growth: the very low stress across markets led our indicator to reach a -2 standard deviation level. For the time being, we see a cross-section of indicators showing that we are still a long way from that level of investor confidence. The VIX index remains at 27 with an historical average of 20 and a low point at 8.5 (1991-2020). US high yield spreads are hovering around 6% versus an historical average of 5% and a low point at 2.35% (1994-2020). Equity options’ skew has barely declined from March to the beginning of June. Across all these dimensions, one conclusion remains: pricing in a lower left tail risk does not mean pricing in an economic recovery.
Figure 5: Unigestion Market Stress Nowcaster
Looking at the derivatives market is one thing, looking at investor positioning is another. We think that the second leg in this post-crisis bull market should see further improvement on the derivatives side, but only modestly so. However, current investor positioning suggests there could be more potential fuel ahead for growth assets. We examine investor positioning through several lenses, including the measured dependency of aggregate investors on equity markets (a proxy for money managers’ equity exposure) and flows into and out of equity mutual funds and ETFs (a proxy for retail investors’ buying and selling).
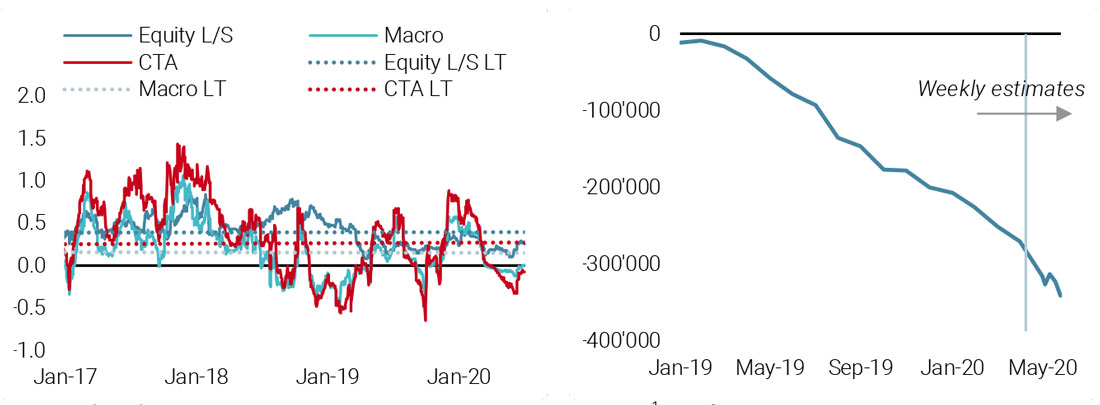
Figure 6 shows the first of these estimates across three types of investors: Equity Long/Short (L/S), Macro and CTA hedge funds. According to this indicator, we have seen an increase in their respective beta to equities since the end of May. However, CTAs and Macro hedge funds’ beta remains negative, indicating they are not long equities as this point. Moreover, for all three investors, their beta remains below their long-term historical average, suggesting they remain under-exposed. The right-hand side of Figure 6 shows our second perspective: net flows for equity mutual funds and ETFs. The conclusion it gives is the same as the betas: we have not yet seen a marked improvement in investor positioning and outflows remain the norm in spite of the market rallying. In a nutshell, the economic recovery is unfolding – at least in the data – but investors have not yet bought into it. Could this be due to valuation?
Figure 6: Implied Beta to DM Equities (left) and Long-term Mutual Fund Net Flows (right, USD m)
Valuation could explain this sentiment conundrum. Since the equity market lows, prices are now much higher. As of the end of June, the S&P 500 index’s year-to-date performance is broadly flat while the Euro Stoxx 600 index is at -12% and the MSCI Emerging Markets index is at -8%. The drop has been sharp, but the rise looks equally impressive. This may give the impression to investors who did not buy into this bull market that they have missed the boat. We think this is the wrong impression: this rise in equities is strongly tied to the fall in interest rates following the actions of many central banks. As rates went down, the discount factor, which multiplies cash flow in any analyst’s model, rose significantly. According to our estimates, a drop in long-term rates by 100 basis points is the equivalent of a short-term increase in earnings by 20%. Using the MSCI World index as a prototypical example, the 700-point decline in the index at the start of the crisis was eliminated to a large extent by this duration effect, leading to a “fair” discount cash-flow model price of USD 2,250: that is about the level where we stand as of the end of June. What our analysis is showing is that rates explain most of the rise in equities, not the pricing of a recovery in earnings.
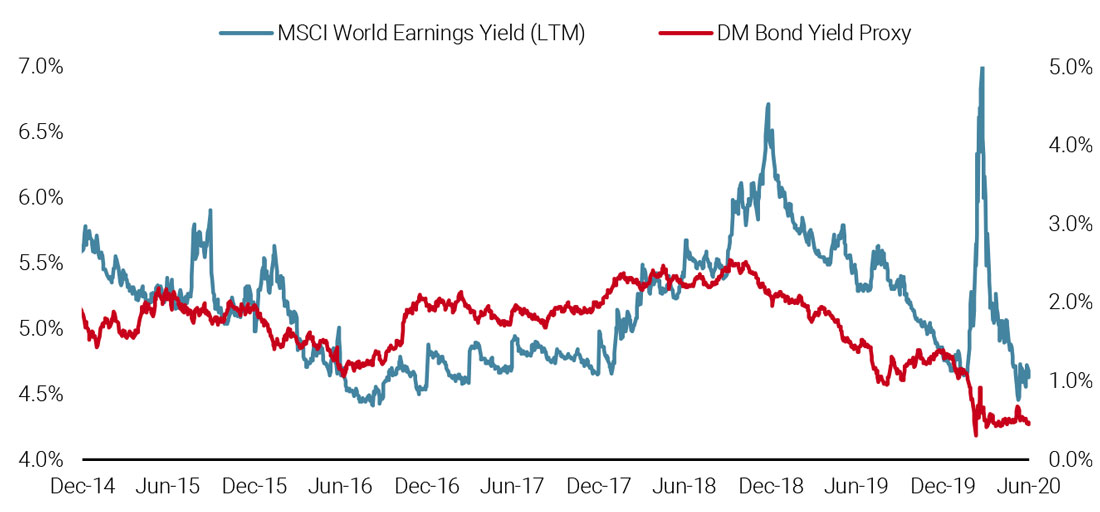
Another way of looking at this phenomenon is to compare the earnings yields of equities to interest rates, as in Figure 7. Investors often choose between investing in equities or bonds, hence earnings yields and interest rates typically exhibit a close relationship. However, as of the end of June, earnings yields remain above bond yields, even if they may be low relative to their own history. As this relationship normalises and investors start to reflect rising expectations of a recovery, the MSCI World should gain another 600 points in the coming two to three years, according to our model, which implies an additional 30% of future performance. This simple calculation further corroborates our view: looking ahead, as investors start to include the recovery in their plans, growth assets should establish a positive trend.
Figure 7: Developed Market Equities Earnings Yield Vs. Developed Market Bond Yields
Two Key Additional Risks Lie Ahead
We believe in the V-shaped recovery. However, it will come with additional risks beyond further lockdowns that could make it a bumpy ride. We see two key risks for the coming quarter: one likely benign – the earnings season, and one potentially more severe – the US election.
This month’s earnings season will provide a broad perspective on the depths of the COVID-19 crisis. Unlike last season, when companies were merely exposed to the beginning of some lockdowns (and some even benefited from the pull-forward of demand), this past quarter has seen firms hit by the full impact. Importantly, investors are well aware of this, and expectations are therefore low for sales and earnings growth (-13% for sales and -30% for earnings versus Q2 2019 for the S&P 500). However, given the unprecedented nature of the shock, there is considerable uncertainty around even these low expectations. Many firms also pulled their guidance for sales and earnings this year, with less than 10% of firms in the S&P 500 maintaining a company estimate for 2020 EPS. In our view, this creates a potential for positive asymmetry in the market reaction to earnings results, where firms that fall short of expectations will not be punished as harshly as firms who beat theirs are rewarded. A similar dynamic played out during the Q1 2020 earnings season, and we think there is a good chance we will see a repeat this season. According to our Growth Nowcaster, this quarter’s year-on-year contraction in earnings should be about -15%.
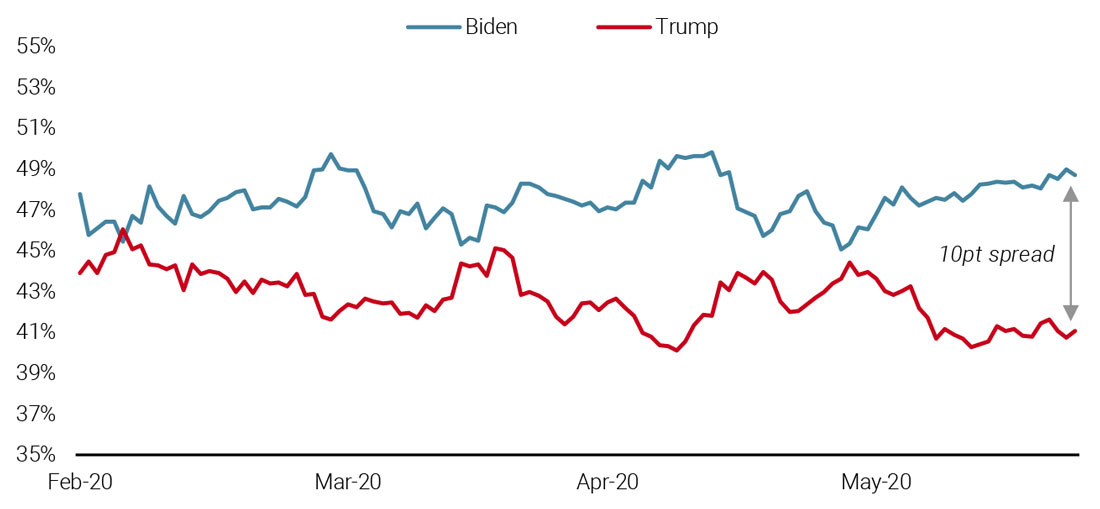
Another key downside risk is the upcoming US election. President Trump’s standing among the American public has taken a significant hit due to the anaemic federal response to the coronavirus and his difficulty facing the rapid change in American sentiment on race relations. According to FiveThirtyEight, his disapproval rating has risen to nearly 56.5%, while his approval rating is down to about 40.5%. To put these numbers into historical context, only three presidents going back to the end of World War II saw similar ratings at this point in their presidency: Harry Truman (who did not run for a second term), Jimmy Carter (who lost re-election), and George H.W. Bush (who lost re-election). Not surprisingly, presidential election polls now show a significant move towards Senator Joe Biden, whose 10-point lead on President Trump would overcome any edge Mr. Trump may have in the electoral college system.
Figure 8: US Presidential Polling
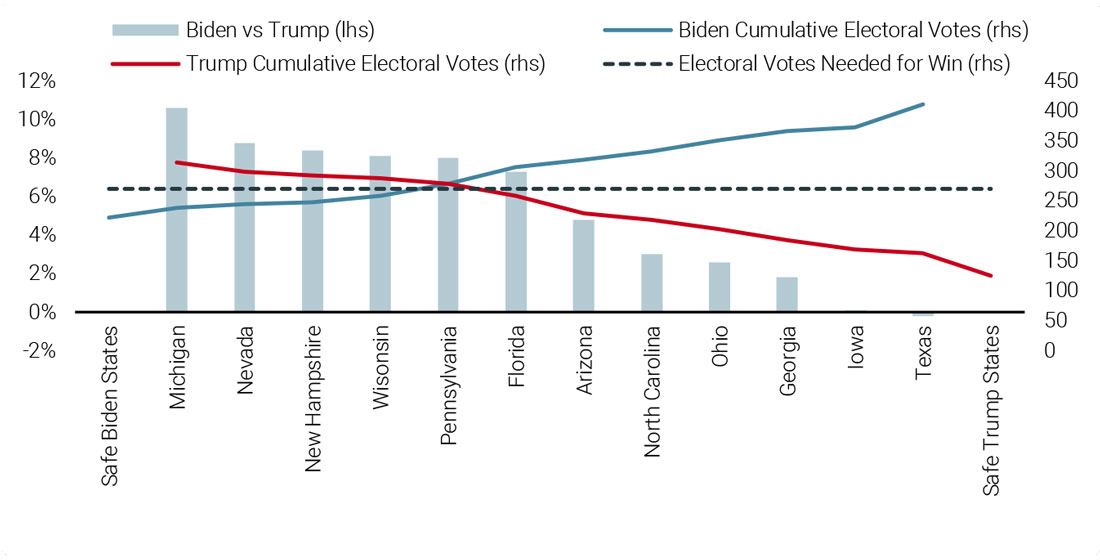
Indeed, given Biden’s strong polling numbers, the electoral map does not favour Trump as much as it did in 2016. Figure 9 aims to show the incremental impact of states currently considered toss-ups in the respective cumulative electoral votes for Biden and Trump. It assumes Biden and Trump win their “safe” states, leaving Biden with 222 electoral votes and Trump with 125 to start. We sort the toss-up states left to right by the relative polling of Biden versus Trump, hence the states to the left side (e.g., Michigan, Nevada, etc.) are more favourable for Biden while those on the right (e.g., Iowa, Texas) are less so. The blue line then charts Biden’s electoral vote total as he progressively picks up states that are most favourable to him, from left to right. The red line charts Trump’s total electoral vote count as he wins states most favourable to him, from right to left. As the chart shows, Biden just needs the first five of these (from Michigan to Pennsylvania) to win the presidency, whereas Trump would need to pick up eight states (from Texas to Pennsylvania) to win a re-election. In particular, in this scenario, he would need to win Florida and Pennsylvania, where Biden currently holds a 7% and 8% lead, respectively. The election is still four months away, and much can change between now and then, including a potential “reversion to the mean.” However, Trump needs to turn the momentum around quickly or Biden’s lead will be cemented heading into Election Day.
Figure 9: Paths to the White House
Many people may be focused on the presidential election but the Senate election is perhaps even more consequential. Our base case remains that if Republicans continue to hold a majority in the Senate, Democrats will be unable to pass significant legislation, most important of which is a repeal of the corporate tax cut for markets. Currently, Republicans hold 53 of the 100 Senate seats, with Democrats holding 45 and joined by two independents (Bernie Sanders of Vermont and Angus King of Maine). As things stand, Democrats are expected to safely hold 48 seats (including the two independent seats), matching the Republicans’ 48 safe seats. This leaves four toss-up seats: Iowa, Maine, Montana, and North Carolina, all of which are currently held by Republicans. If Democrats win two of these and the presidency, they will have control of both the executive and legislative branches of government. Opinion polls for these races are scarce, but they are all currently competitive with the Democrats ahead (though often within the polling error range). As the election approaches and more polls come out in these states, we will be monitoring them closely to assess if the Democrats stand a real chance of taking control of the presidency and Congress. This would give them the ability to enact legislation that would be significant headwinds to risky assets, especially US equities.
Gaining Momentum
The economic recovery seems well under way, with some potential for positive surprises but investors are not yet convinced. They believe that the left tail risk has decreased and are not buying the V-shape of the recovery. It shows in their positioning but we do not think investors should be too intimidated by market valuations. In our view, the third quarter should see a recovery in pricing now that the lower rate environment has hit valuations fully. This positive scenario comes with two risks: the earnings season is a smaller risk and the start of the US election is a larger one. For now, our conviction is reflected in a broad exposure to credit and equities in order to profit from a pick-up in the recovery.
1For the most up-to-date figures about the fund industry, please visit http://www.ici.org/research/stats
Important information
This document is provided to you on a confidential basis and must not be distributed, published, reproduced or disclosed, in whole or part, to any other person.
The information and data presented in this document may discuss general market activity or industry trends but is not intended to be relied upon as a forecast, research or investment advice. It is not a financial promotion and represents no offer, solicitation or recommendation of any kind, to invest in the strategies or in the investment vehicles it refers to. Some of the investment strategies described or alluded to herein may be construed as high risk and not readily realisable investments, which may experience substantial and sudden losses including total loss of investment.
The investment views, economic and market opinions or analysis expressed in this document present Unigestion’s judgement as at the date of publication without regard to the date on which you may access the information. There is no guarantee that these views and opinions expressed will be correct nor do they purport to be a complete description of the securities, markets and developments referred to in it. All information provided here is subject to change without notice. To the extent that this report contains statements about the future, such statements are forward-looking and subject to a number of risks and uncertainties, including, but not limited to, the impact of competitive products, market acceptance risks and other risks.
Data and graphical information herein are for information only and may have been derived from third party sources. Although we believe that the information obtained from public and third party sources to be reliable, we have not independently verified it and we therefore cannot guarantee its accuracy or completeness. As a result, no representation or warranty, expressed or implied, is or will be made by Unigestion in this respect and no responsibility or liability is or will be accepted. Unless otherwise stated, source is Unigestion. Past performance is not a guide to future performance. All investments contain risks, including total loss for the investor.
Unigestion (UK) Ltd. is authorised and regulated by the UK Financial Conduct Authority (FCA) and is registered with the Securities and Exchange Commission (SEC). Unigestion Asset Management (France) S.A. is authorised and regulated by the French “Autorité des Marchés Financiers” (AMF). Unigestion Asset Management (Canada) Inc., with offices in Toronto and Montreal, is registered as a portfolio manager and/or exempt market dealer in nine provinces across Canada and also as an investment fund manager in Ontario, Quebec and Newfoundland & Labrador. Its principal regulator is the Ontario Securities Commission. Unigestion Asia Pte Limited is authorised and regulated by the Monetary Authority of Singapore. Unigestion Unigestion Asset Management (Düsseldorf) SA is co-regulated by the “Autorité des Marchés Financiers” (AMF) and the “Bundesanstalt für Finanzdienstleistungsaufsicht” (BAFIN). Unigestion SA has an international advisor exemption in Quebec, Saskatchewan and Ontario. Unigestion SA is authorised and regulated by the Swiss Financial Market Supervisory Authority (FINMA). Unigestion SA’s assets are situated outside of Canada and, as such, there may be difficulty enforcing legal rights against Unigestion SA.
Document issued: July 2020.