MiViews Q3 2022: Something’s Gotta Give
Head of Macro and Dynamic Allocation, Cross Asset Solutions
- Recession fears are growing while central banks continue to aggressively tighten to fight inflation.
- Although major central banks are now well engaged in the normalisation cycle, many are still well behind the curve, especially in developed countries.
- Although equity and bond markets have already suffered significant losses this year, they seem to have further room to fall before bottoming out.
Overview
The first half of 2022 ended on a truly sour note for financial markets, with central banks aggressively tightening while economies are weakening. In the past, any sign of a marked slowdown in the developed world would be met and resolved by the (in)famous Greenspan “put”, a quick and convenient fix to calm the markets and revive the economy via lower rates or quantitative easing, or a combination of both.
This time around is very different, as runaway inflation has basically tied the hands of policy makers, now desperately trying to catch up with the inflationary beast they have unleashed by keeping rates too low and for too long. This in turn has spooked the markets, leading to a broad based sell-off in equities and bonds with nowhere to hide besides inflation hedges such as commodities or breakevens. In June, however, the recessionary theme has made a comeback, as witnessed by some distinct rotations across and within asset classes. Although markets are now starting to price in a cooling of inflation and a peak in central bank hawkishness, we have yet to reach the lows in equity markets where we would be comfortable to reengage risk.
WILL RECESSION RISK CHANGE THE INFLATION FIGHTING?
Now that the inflation shock has truly entered the collective consciousness, another equally concerning term has entered into the fray again, namely recession. As shown in Figure 1 below, which compares the Google searches of “inflation” versus “recession”, the latter has made a pronounced comeback in the last few weeks, as the consequences of inflation across the board are starting to take their toll on the real economy. Indeed, worsening negative disposable income for households and lower margins hurting corporate profits have considerably increased uncertainty and elevated the risk of recession back towards the top of the list of concerns most economic agents have to contend with.
Figure 1: Google Searches for Inflation vs. Recession in Google Trend
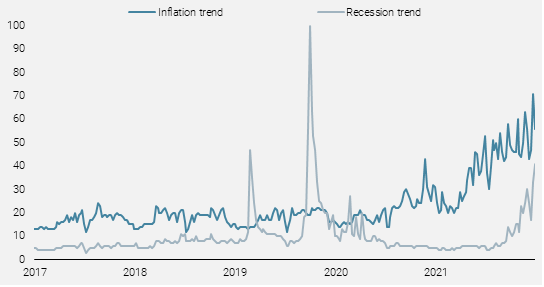
Sources: Bloomberg, Unigestion. Data as at 31.12.2021.
Our Global Growth Nowcaster, which monitors more than 80% of the world’s GDP in near real-time, confirms this trend, its one-year rate of change consistently declining over the first half of this year and now negative for most countries. Figure 2 also shows the shaded recession periods over the last 35 years as determined by the National Bureau of Economic Research (NBER). Interestingly, any decline of our Growth Nowcaster to its current depths was accompanied by a recession, as witnessed in 1990/91, 2001, 2007/2008 and 2020.
Figure 2: 1y Change in our Global Growth Nowcaster and NBER Recession
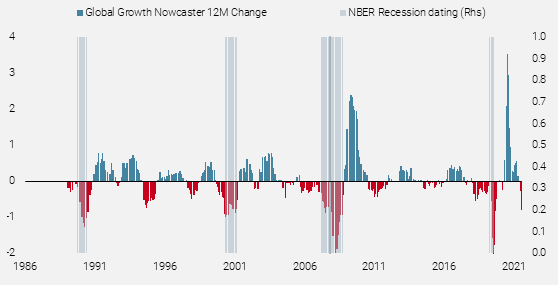
Sources: Bloomberg, Unigestion. Data as at 31.12.2021.
Historically, this kind of deceleration is concurrent with low or declining inflation. On average, a decline of -0.7 in our Global Growth Nowcaster over the last 12 months corresponds to a Global Inflation Nowcaster average of -0.36, but it is currently at 1.5. As for momentum, the aforementioned -0.7 decline in our growth indicator usually equates to a fall of -0.6 in our Inflation Nowcaster over 12 months. It is still positive at +0.2, despite the negative readings for our Growth Nowcaster’s (Figure 3 below).
Figure 3: Inflation vs Growth Nowcaster (1y change)
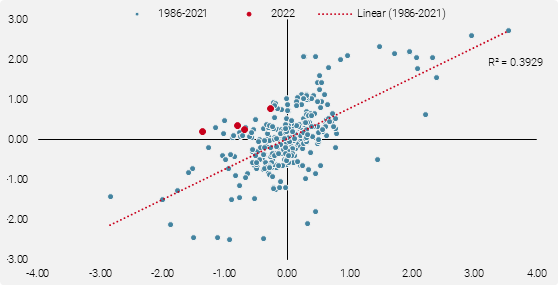
Sources: Bloomberg, Unigestion. Data as at 20.06.2022.
Investors adjusted their pricing and expectations accordingly in June, as large rotations were observed across and within asset classes, reflecting a shift from the previously inflation driven portfolio allocations and hedging activity to a more recessionary stance. As such:
- The Energy sector, the main beneficiary of the global inflationary context in 2022, underperformed Technology, the prior darling of the investment community when Covid engulfed the globe and caused a sharp recession. Moreover, “Value” stocks (which trade on the ability to generate cash) may continue to struggle as the previous “Growth vs Value” rotation reverses. Historical analysis suggests that “Value” outperforms as cycles turn, but fails to do so when earnings fall, which could be the case in the coming months.
- The Inflation macro basket, comprised of real assets such as inflation breakevens and commodities, posted relative losses to the Recession macro basket (-7.7% vs -1.7% in June), whose main component, duration, had so far suffered from the great normalisation of 2022.
- Rate cuts are priced in for end of 2023. The Dec22 and Dec23 Fed funds futures inverted in June as shown in Figure 4, indicating that the market expects the economy to crack and the Fed along with it by Q1 next year, which will oblige it to reverse course and end its aggressive hiking cycle.
Figure 4: December 2023 vs December 2022 Fed Funds Futures
Sources: Bloomberg, Unigestion. Data as at 20.06.2022.
CENTRAL BANKS STILL TRYING TO PLAY CATCH UP
Central banks aim to curb inflation through tighter financial conditions in order to slow down inflation pressures emanating from the demand side. History shows that when central banks attempt to guide inflation to their respective targets, the scale, timing, and duration of the tightening cycle are key to achieving this. This time around they have been very late in acknowledging the threat of persistent inflation and its effect on the economy, even qualifying it as mostly “transitory” until late last year. Given this delay, which has allowed headline inflation to surge near 10% in many developed economies, we believe that the path to normalisation will require an aggressive tightening cycle, which to this day looks far from over.
Figure 5a shows the average central bank rates of the G10 countries versus their average core inflation since the early 2000s. Up until the Great Financial Crisis of 2008, rates were consistently higher than core inflation across the board. It took a deep recession, various European crises, market scares in 2018 and finally Covid to bring rates down to zero, while inflation continued to hover around or below the generally accepted target of 2%. Meanwhile core inflation has surged past 4.3% in 2022, while central bank rates have barely budged in comparison, currently at 0.85%. This clearly demonstrated to what extent central banks are still way behind the curve, desperately trying to play catch up with runaway inflation.
Figure 5a: G10 Central Bank Average Rates and Average Core Inflation
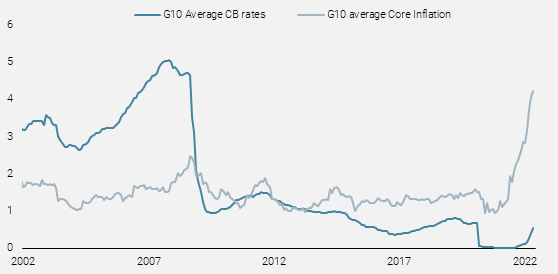
Sources: Bloomberg, Unigestion. Data as at 31.05.2022.
Likewise, emerging market central banks, which historically tend to follow the lead of their developed economies’ counterparts, have taken a considerable head start this time around, as shown in Figure 5b. Not only is it very rare for the emerging world to precede the G10 in such a manner, it also shows the extent of the policy mistake the “developed” central bankers made last year.
Figure 5b: G10 Central Bank Average Rates vs. Emerging Market Average Rates
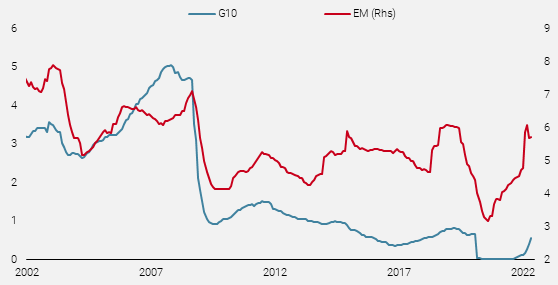
Sources: Bloomberg, Unigestion. Data as at 15.12.2021.
The main consequence of this error in timing is the resulting steep tightening path that central banks will need to take to catch up with what is priced in the market, as shown in Figure 6 by the various developed world’s short term interest rates markets.
Figure 6: 1Y1Y Overnight Index Swap (OIS) vs 1Y
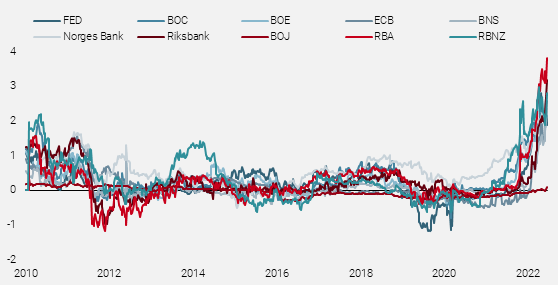
Sources: Bloomberg, Unigestion. Data as at 30.06.2022.
THE PREREQUISITE ELEMENTS TO CALL THE EQUITY BOTTOM
Over the first 6 months of the year risky assets corrected sharply lower, incorporating higher interest rates as reflected in the larger inflation premium. Nevertheless, we observed divergence within the repricing of growth oriented assets between high yield credits and equities. The combination of lower liquidity, a reversal in central bank balance sheet expansion, and higher nominal rates have caused high yield spreads to widen, and although they are still well below their COVID peak, they have reached the levels last seen during the late 2018 slowdown (Figure 7).
Figure 7: US HY Spreads vs. S&P500 PE Estimates
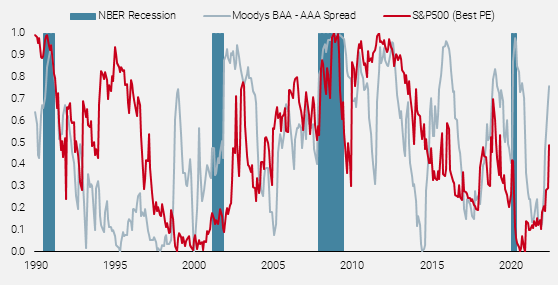
Sources: Bloomberg, Unigestion. Data as at 30.06.2022.
More importantly and unlike equities, where recent outflows have barely dented the strong post COVID inflows, about 75% of the post COVID flows into HY have reversed. Historically, credit spread markets lead the equity markets when it comes to recession pricing. Consequently, we will wait for the following things to happen before calling a bottom in equities and reengaging risk in our diversified portfolios:
- Lower inflation expectations: central banks will not reverse their hawkish stance until they get inflation back under control. This means that we will need to see monthly increases shift from a 0.5% to 0.7% range to 0.2% to 0.3%.
- Correction in earnings expectations: current expectations for 2022 earnings growth are positive and still too high. History shows that a recession entails a 15% decline in earnings.
- Outflows and a VIX capitulation spike: contrary to the fixed-income space, which has seen large outflows this year, equity flows have slowed but are still positive on a year-to-date basis. We expect outflows following the Q2 earning seasons and a spike in VIX to 40 that could mark the capitulation and the last phase of bear market.
- We believe that a peak in monetary policy normalisation will equate to a flat US 2-10Y curve and nominal rates at 3.5%, combined with negative earnings growth for 2022 that would push the SP500 to 3400/3500, 10% lower than current levels and 30% below the all-time high. This should result in a VIX above 35, which in turn would signify a better risk/reward for equities and bonds, as most of the recession risk and the inflation shock would be priced in at that point.
CONCLUSION
Although monetary policy was the panacea to cure all economic ills and market crises over the past few decades, central banks can no longer use this magic wand to dispel the challenges they face today: runaway inflation and a recession looming on the horizon. Indeed, the disinflationary “goldilocks” narrative – an economy not too hot and not too cold -, that had supported risk assets for so long, has morphed into an inflation fighting offensive, belatedly taken on by policy makers, now robbed of their weapon of choice to prevent further financial meltdown. As such, the markets have room to spiral lower, at least to levels more befitting to the dilemma we are currently confronted with.
IMPORTANT INFORMATION
This document is provided to you on a confidential basis and must not be distributed, published, reproduced or disclosed, in whole or part, to any other person.
The information and data presented in this document may discuss general market activity or industry trends but is not intended to be relied upon as a forecast, research or investment advice. It is not a financial promotion and represents no offer, solicitation or recommendation of any kind, to invest in the strategies or in the investment vehicles it refers to. Some of the investment strategies described or alluded to herein may be construed as high risk and not readily realisable investments, which may experience substantial and sudden losses including total loss of investment.
The investment views, economic and market opinions or analysis expressed in this document present Unigestion’s judgement as at the date of publication without regard to the date on which you may access the information. There is no guarantee that these views and opinions expressed will be correct nor do they purport to be a complete description of the securities, markets and developments referred to in it. All information provided here is subject to change without notice. To the extent that this report contains statements about the future, such statements are forward-looking and subject to a number of risks and uncertainties, including, but not limited to, the impact of competitive products, market acceptance risks and other risks.
Data and graphical information herein are for information only and may have been derived from third party sources. Although we believe that the information obtained from public and third party sources to be reliable, we have not independently verified it and we therefore cannot guarantee its accuracy or completeness. As a result, no representation or warranty, expressed or implied, is or will be made by Unigestion in this respect and no responsibility or liability is or will be accepted. Unless otherwise stated, source is Unigestion. Past performance is not a guide to future performance. All investments contain risks, including total loss for the investor.
Unigestion (UK) Ltd. is authorised and regulated by the UK Financial Conduct Authority (FCA) and is registered with the Securities and Exchange Commission (SEC). Unigestion Asset Management (France) S.A. is authorised and regulated by the French “Autorité des Marchés Financiers” (AMF). Unigestion Asset Management (Canada) Inc., with offices in Toronto and Montreal, is registered as a portfolio manager and/or exempt market dealer in nine provinces across Canada and also as an investment fund manager in Ontario, Quebec and Newfoundland & Labrador. Its principal regulator is the Ontario Securities Commission. Unigestion Asset Management (Düsseldorf) SA is co-regulated by the “Autorité des Marchés Financiers” (AMF) and the “Bundesanstalt für Finanzdienstleistungsaufsicht” (BAFIN). Unigestion SA has an international advisor exemption in Quebec, Saskatchewan and Ontario. Unigestion SA is authorised and regulated by the Swiss Financial Market Supervisory Authority (FINMA). Unigestion SA’s assets are situated outside of Canada and, as such, there may be difficulty enforcing legal rights against Unigestion SA.
Document issued: July 2022.