Revisiting the case for alternative risk premia
Most asset classes and investment styles suffered in 2018 and alternative risk premia (ARP) were no exception. In this paper, we explore the reasons behind the poor performance of ARP last year, including systematic drivers, such as the macroeconomic environment and valuations, as well as some idiosyncratic factors, which compounded the challenging conditions.
Despite delivering disappointing returns over the past 12 months, we maintain our conviction in the fundamental rationale for investing in ARP strategies. We believe ARP present one of the most effective liquid alternative solutions for investors seeking uncorrelated sources of return for three main reasons:
- Positive long-term performance: ARP strategies have delivered positive returns over the long run with a very low correlation to traditional assets, particularly equities. They have recovered well from similar, short-term setbacks in the past.
- Market conditions are evolving: Unfavourable macroeconomic conditions and market stress caused by inflation surprises tend to be transient in nature. As monetary policy and growth prospects become clearer, many ARP tend to deliver better performance, irrespective of equity or bond market performance.
- Diversification benefits: Even in 2018, ARP strategies performed with a very low correlation to equities and bonds. This will be increasingly important in the years ahead as the expected risk-return profile of traditional assets is set to decline.
The Macroeconomic Context in 2018
After 2017, a year characterised by the broadest strong and synchronised growth momentum since before the great financial crisis, 2018 painted a very different picture. The market turmoil in February 2018 gave a hint of a regime shift, as the “easy money” and “low volatility” period came to an end. Rising volatility and the change in correlations both across and within assets have been key game changers for market dynamics, and we have seen central banks working towards solutions to set the world back on a higher growth/inflation track.
Global growth showed clear signs of deceleration and ongoing dispersion in performance, reflecting the dispersion in macroeconomic fundamentals, monetary policy and pricing in each region. At the same time, tighter global liquidity incentivised investors to favour cash over risky assets broadly. In an environment where cash is king, risky assets, traditional or alternative, are likely to underperform. While a few alternative risk premia (ARP) strategies performed well, most recorded low or negative returns in down markets during the year. Equity Value and Trend Following strategies – often praised for their downside protection benefits – delivered particularly large negative returns in 2018. Importantly, with the exception of periods of global deleveraging, as in 2008 or 1929, investors’ preference for cash over risky assets rarely lasts long and indeed, in January 2019, we saw investors moving back into risky assets.
At Unigestion, we believe that despite exhibiting a low correlation to traditional asset classes in general, ARP still show some sensitivity to macroeconomic conditions (see our paper ‘A Macro Risk-Based Approach to Alternative Risk Premia Allocation’ for more information). We will therefore begin by analysing the macroeconomic environment in 2018.
Looking back over the year, we could say that it was a tale of two regimes, where higher–than-expected inflation pressures gave way to a full-blown market stress episode during the fourth quarter. Inflationary pressures tend to be bad for most risk premia, as they are likely to lead to higher rates as central banks try to keep inflation in check. As the price of a security can be defined by the present value of future expected cash flows, higher rates mean a larger number at the denominator, hence a lower equilibrium price, all other things being equal.
Using 28 years of simulated data for a range of ARP, we studied their performance in inflationary and market stress regimes compared to their full sample average performance. The reason for removing the full sample average is to discard the hindsight bias that might be present in historical simulations of these risk premia. As can be seen in Chart 1, these periods have led to lower-than-average Sharpe ratios for most risk premia, in all categories.
Chart 1: Average Excess Sharpe Ratios During Inflation or Market Stress Regimes
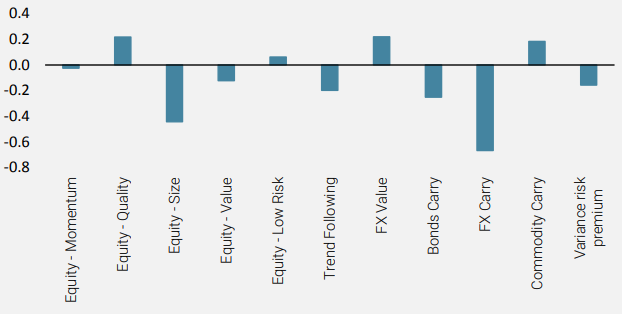

Inflationary and market stress regimes have historically led to lower-than-average Sharpe ratios for most risk premia.

We also examined the same data during periods of interest rate tightening. We defined those as periods starting with the first rate hike by the US Federal Reserve and ending with the last month before the first rate decrease. Since 1990, there have been three such tightening episodes: March 1997 to December 2000, June 2004 to August 2007, and from December 2015 to date. As shown in Chart 2, data from these periods of interest rate tightening reveals an even bleaker picture: with the exception of Equity Momentum, all other risk premia tend to underperform their long-term average return.
Chart 2: Average Excess Sharpe Ratios During Monetary Policy Tightening
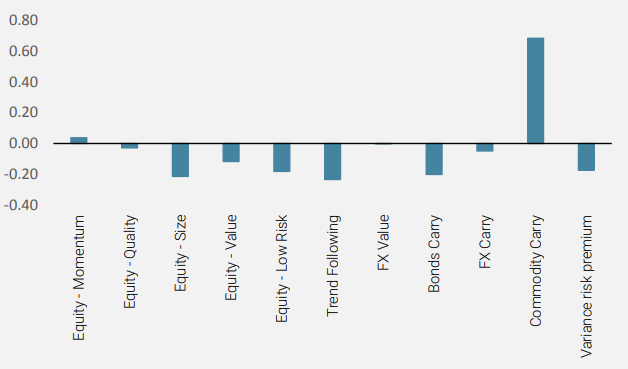
In other words, the combination of monetary policy tightening with already less favourable macroeconomic conditions has a compounding negative effect on average risk premia returns. From that perspective, the disappointing results from 2018 become less surprising.
Nevertheless, while the macroeconomic environment sheds some light on the poor behaviour of ARP overall, we conducted further analysis into the individual strategies that suffered the most in 2018, namely Equity Value, Trend Following, EM FX Carry and Volatility Carry.
Market Context: High Dispersion and Increasing Volatility
The changing macroeconomic context we described earlier was a clear game changer for market dynamics, and we saw increasing dispersion throughout the 2018, as well as significantly higher volatility.
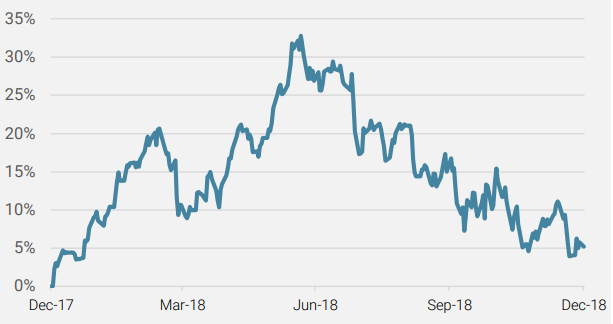
While the US equity market was still leading other regions in 2018, the high dispersion within US equity indices had a significant impact on equity factors, notably Equity Value (and, to a lesser extent, Equity Size). Indeed, by the end of June, a small number of outperforming stocks (Apple, Amazon, Microsoft and Netflix) had contributed more than 80% to the performance of the S&P 500 index and up to 90% to the return on the NASDAQ 100 index. As illustrated in Chart 3 below, the NYSE FANG index had outperformed the S&P 500 TR Net index by more than 30% by mid-year.
While the US equity market was still leading other regions in 2018, the high dispersion within US equity indices had a significant impact on equity factors.
Chart 3: Outperformance of the NYSE FANG index vs. the S&P 500 index
Furthermore, both in terms of valuation and size, the NYSE FANG index proved to be significantly more expensive (as shown in Chart 4), with a considerably higher average market cap (USD 346 trillion versus USD 47 trillion).
Chart 4: Price-to-Earnings Ratio of the NYSE FANG vs. the S&P 500
The high dispersion between the NYSE FANG index and the rest of the market explained most of the disappointing behaviour of Equity Value and, to a lesser extent, Equity Size.
The high dispersion between these very few stocks and the rest of the market explained most of the disappointing behaviour of Equity Value and, to a lesser extent, Equity Size, as both factors are by construction short these names.
A Fast-Changing Environment: Trend Following Strategies Need Trends
Trend Following strategies also significantly disappointed in 2018. Most Trend Following strategies used by ARP managers fall into the range of medium to long-term trend following. As a result, these strategies will usually work well when there are established trends, whether they are on the upside or downside. 2018 was characterised by very fast-changing environments, with themes – and corresponding market reactions – shifting significantly from month to month. A way to illustrate this lack of trend is to show how often the monthly performance of assets has changed signs (i.e. moved from positive to negative or vice versa) from one month to the next in 2018, and compare that to the long-term average of such changes.
Chart 5: Frequency of Monthly Performance Sign Changes vs. Long-Term Average
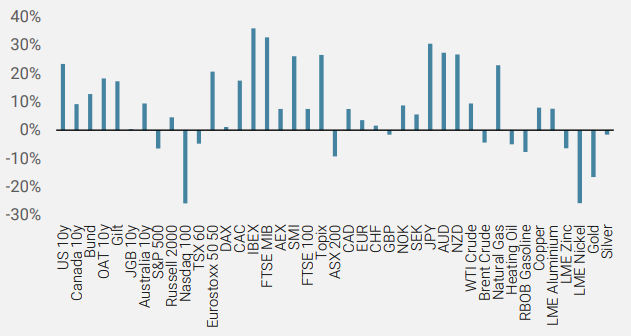
With the exception of the uptrend in the NASDAQ 100 index and, to some extent, commodities (metals), there was no real trend in equities and bonds, explaining the disappointing performance of Trend Following strategies.
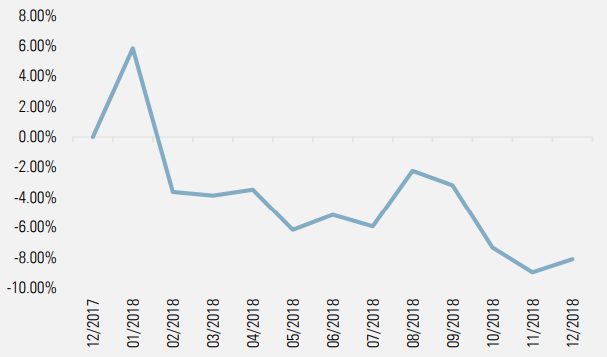
Chart 5 shows that for more than two thirds of some of the most common contracts traded in Trend Following strategies, performance tended to switch signs more than on average. With the exception of the uptrend in the NASDAQ 100 index and, to some extent, commodities (metals), there was no real trend in equities and bonds. Indeed, in many instances, this frequency was more than 20% above average. While this chart does not show the amplitude of said moves, it clearly illustrates how unstable the environment was in almost all asset classes, exactly the type of environment where Trend Following strategies are expected to struggle, explaining the disappointing performance of these strategies. Chart 6 shows the performance of the SG Trend index, which tracks the performance of the 10 largest trend following CTAs.
Chart 6: Performance of the SG Trend Index in 2018
Idiosyncratic Drivers
As explained previously, the macroeconomic and monetary policy backdrop as well as the market environment were unfavourable for ARP strategies as a whole. Unfortunately, idiosyncratic events further compounded these worse-than-average conditions.
The February Volatility Blow-Up
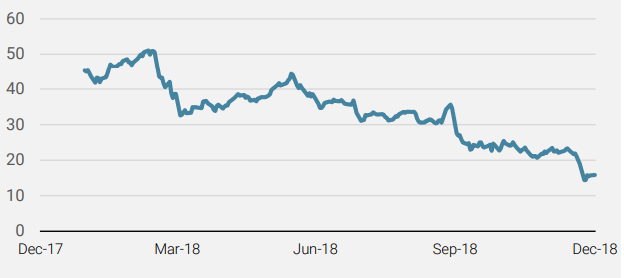
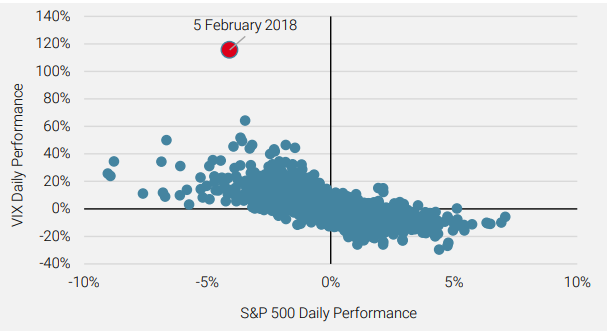
The market turmoil in February 2018, driven by the reassessment of inflation expectations mentioned earlier, triggered a spike in volatility. This was reflected in the huge convexity in the VIX curve, with the front VIX future contract spiking 113% on 5 February 2018, three times as much as the second-largest spike on record (24 June 2016, when it rose +36% following the Brexit referendum). This unprecedented move considerably hit Volatility Carry strategies: the short S&P 500 futures used as a hedge in that strategy have not been able to fully offset the losses on the short VIX positions, as the ratio between the size of the moves of the VIX versus the S&P 500 was much higher than its historical average.
The unprecedented spike in volatility in February 2018 considerably hit Volatility Carry strategies.
Chart 7: Ratio of Movements in the VIX vs. the S&P 500 Index
The Collapse of the Turkish Lira
2018 was an eventful year on the geopolitical stage and the spotlight was on emerging markets (EM) over the summer, when Turkey’s crisis worsened on the back of high inflation, an excessive current account deficit and foreign currency debt. Consequently, the Turkish lira fell by 28% against the US dollar in August, hitting EM FX Carry strategies significantly. The situation in Turkey and, to a lesser extent, in Brazil, highlighted the difficulties faced by emerging countries, most specifically those with persistent macroeconomic imbalances. Emerging FX Carry strategies underperformed as a result.
The Turkish lira fell by 28% against the US dollar in August, hitting EM FX Carry strategies significantly.
A Strong Conviction
Despite these disappointing results in 2018, our conviction in the long-term investment case for ARP remains strong for several reasons:
- Strong long-term performance: Returns from ARP strategies can be volatile and there have been 12-month periods of similarly negative performance in the past. However, all show positive performance over the long run with a very low correlation to traditional assets, most specifically equities. It is worth reiterating that ARP strategies are not new – they have been successfully exploited by hedge funds for decades and have recovered from such setbacks in the past.
- Market conditions are evolving: Unfavourable macroeconomic conditions and market stress caused by inflation surprises tend to be transient in nature. As monetary policy and growth prospects become clearer, many ARP tend to deliver better performance, irrespective of equity or bond market performance. In December 2015, for example, ARP strategies delivered negative performance after the European Central Bank disappointed the markets at the beginning of the month. This was followed by strong positive returns in January and February 2016 when equity markets fell sharply.
- Low correlation of returns: The diversification benefits of ARP still hold true. Even in 2018, the SG Multi Alternative Risk Premia index delivered a 0.1 beta to MSCI AC World USD index and a 0.2 beta to the Bloomberg Global Aggregate USD-hedged index. Uncorrelated sources of return such as these are becoming increasingly important in the current market environment. The expected risk-return profile of traditional assets is likely to decline as global economic activity slows and monetary policy normalises. Correlations between traditional assets are increasing and a mix of traditional asset classes is unlikely to deliver the same risk-adjusted returns in the future as it has over the past ten years. With diminishing net returns from hedge funds since the Global Financial Crisis, ARP present one of the most effective, liquid alternative solutions for investors looking for cost-efficient and transparent diversification.
Returns from ARP strategies can be volatile and there have been 12- month periods of negative performance in the past. However, all show positive performance over the long run with a very low correlation to traditional assets.
It is also important to highlight the positive contribution that ARP can make when investors need it most. In 2018, our Uni-Global Alternative Risk Premia fund proved its ability to add value during periods when traditional assets performed particularly poorly, notably in February, March and October.
In February 2018, for example, most risk premia suffered, but more defensive strategies, such as FX Value, Bonds Carry and Equity Low Risk, recorded positive returns, as expected during market turmoil. Our Uni-Global Alternative Risk Premia fund held up well in this environment, returning -0.6% (gross of fees), compared to a fall of 3% for the SG Multi Alternative Risk Premia index, which tracks the performance of a representative peer group.
By diversifying our portfolio, and dynamically adjusting our allocations throughout the month, we managed to contain the drawdown. Diversification also played its part in March and October, helping our fund to return +1.8% and +1.5%, respectively (gross of fees), as compared to the MSCI AC World USD index, which lost -2.1% and -7.5%, respectively.
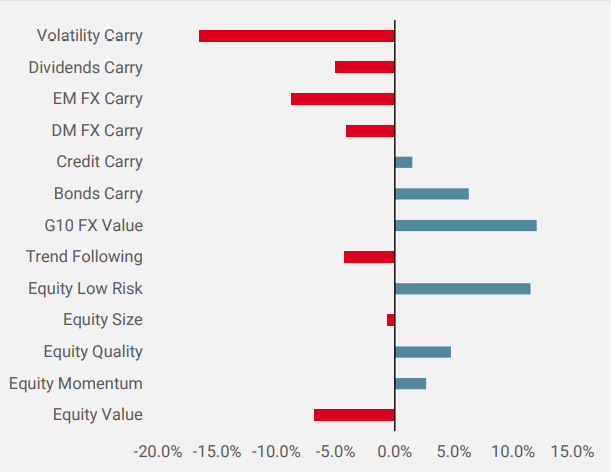
While a static approach might seem like the lowest risk option, such a choice is actually an active decision in itself, as different ARP behave differently in different market or economic regimes. Chart 8 illustrates the significant dispersion in performance among ARP in 2018. These results reinforce our conviction that dynamic allocation across a diverse range of ARP is essential to achieve optimal risk-adjusted returns. The dynamic component of Uni-Global Alternative Risk Premia, which aims to adapt the strategic portfolio to the current environment, returned a positive performance in 2018, adding 52bps to overall performance.
Dynamic allocation across a diverse range of ARP is essential to achieve optimal risk-adjusted returns.
Chart 8: Performance of Different Risk Premia in 2018
Conclusion
ARP strategies generally delivered negative returns in 2018, hampered by an unfavourable macroeconomic backdrop and several idiosyncratic events that drove investors out of risky assets and into cash. Despite these disappointing results, long-term performance remains positive, with a very low correlation to traditional assets, particularly equities. Moreover, the particular combination of adverse macroeconomic and market conditions that prevailed in 2018 is unlikely to persist, as we do not see signs of global deleveraging. Indeed, investors have moved back into risky assets in 2019, helping ARP strategies to recover part of last year’s losses. As the name makes clear, ARP are risk premia i.e. they offer investors compensation for taking on risk in the same way a buy-and-hold position in bonds or equities is rewarded over the long term. Over the short term, and especially when investors deleverage, risk premia can be volatile, and alternative risk premia are no exception.
ARP are, in our view, an essential component of a balanced portfolio. Our analysis shows that a strategic allocation to ARP can significantly enhance the risk-return profile of a diversified portfolio, which will become increasingly important given the more challenging outlook for equities and bonds.
Important Information
Past performance is no guide to the future, the value of investments can fall as well as rise, there is no guarantee that your initial investment will be returned.
This document has been prepared for your information only and must not be distributed, published, reproduced or disclosed by recipients to any other person.
This is a promotional statement of our investment philosophy and services only in relation to the subject matter of this presentation. It constitutes neither investment advice nor recommendation. This document represents no offer, solicitation or suggestion of suitability to subscribe in the investment vehicles it refers to. Please contact your professional adviser/consultant before making an investment decision. Where possible we aim to disclose the material risks pertinent to this document, and as such these should be noted on the individual document pages.
Data and graphical information herein are for information only and may have been derived from third party sources. Unigestion takes reasonable steps to verify, but does not guarantee, the accuracy and completeness of this information. As a result, no representation or warranty, expressed or implied, is or will be made by Unigestion in this respect and no responsibility or liability is or will be accepted. All information provided here is subject to change without notice. It should only be considered current as of the date of publication without regard to the date on which you may access the information. An investment with Unigestion, like all investments, contains risks, including total loss for the investor. Unless otherwise stated, data source is Unigestion, estimated as at 31 December 2018.
Unigestion SA is authorised and regulated by the Swiss Financial Market Supervisory Authority (FINMA). Unigestion (UK) Ltd. is authorised and regulated by the UK Financial Conduct Authority (FCA) and is registered with the Securities and Exchange Commission (SEC). Unigestion Asset Management (France) S.A. is authorised and regulated by the French “Autorité des Marchés Financiers” (AMF). Unigestion Asset Management (Canada) Inc., with offices in Toronto and Montreal, is regulated in Canada by the securities regulatory authorities in Ontario, Quebec, Alberta, Manitoba, Saskatchewan, Nova Scotia, New Brunswick and British Columbia. Its principal regulator is the Ontario Securities Commission. Unigestion Asia Pte Limited authorised and regulated by the Monetary Authority of Singapore.
Uni-Global – Alternative Risk Premia is a compartment of the Luxembourg Uni-Global SICAV Part I, UCITS IV compliant. This compartment is currently authorised for distribution in Austria, Belgium, Denmark, Finland, France, Germany, Ireland, Italy, Luxembourg, Netherlands, Norway, Spain, UK, Sweden, Switzerland and Singapore. In Italy, this compartment can be offered only to qualified investors within the meaning of art.100 D. Leg. 58/1998. Its shares may not be offered or distributed in any country where such offer or distribution would be prohibited by law. All investors must obtain and carefully read the prospectus which contains additional information needed to evaluate the potential investment and provides important disclosures regarding risks, fees and expenses. Unless otherwise stated performance is shown gross of fees in USD and does not include the commission and fees charged at the time of subscribing for or redeeming shares.
Document issued February 2019