As market participants switch their focus towards reopening, the Momentum factor, which bets that the previous (losers) winners will continue to (under) perform, has been rapidly changing. By examining the changing face of Momentum, we uncover a shift in focus away from the COVID Winners bet that characterised 2020. The result is an equity factor suite that is better diversified, capturing a greater set of effective bets.
Momentum : oil tanker or speed boat?
Prior to the announcement of a vaccine breakthrough in early November, the global developed long-short Momentum basket1 was characterized by being long those stocks which had performed well in the pandemic, COVID Winners, and short those which had performed poorly, COVID Losers.

Prior to November the global developed long-short Momentum basket1 was characterized by COVID Winners and COVID Losers.

This is well highlighted by the net sector exposures of the long-short basket at the start of October with heavy long exposure to Technology, Health Care and short exposure to Financials, Energy and Real Estate, illustrated below in Figure 1.
Figure 1: Global Long-Short Momentum Basket Net Sector Exposure as of 1Oct 20
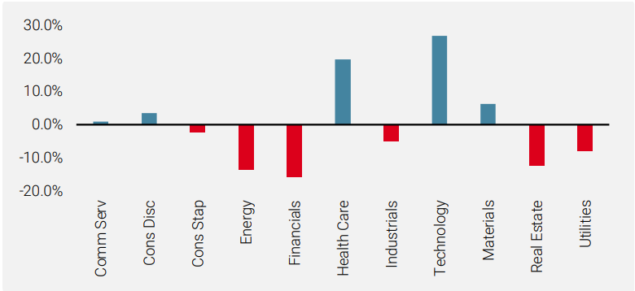
Source: Unigestion. As at 1 October 2020
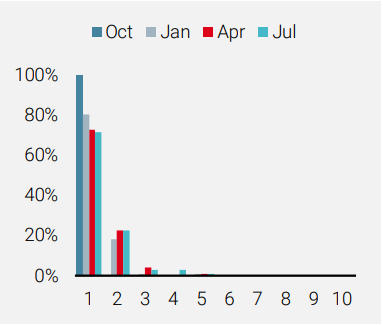
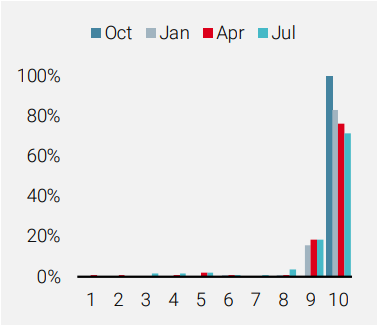
As the ‘Vaccine Rally’ of late 2020 and early 2021 reversed the fortunes of many COVID Winners and Losers, it begs the question, how quickly did Momentum pivot away from this thematic bet? To answer this, we have taken all the stocks in the long Momentum basket in October to see which Momentum bucket they end up in at the start of subsequent quarters (Figure 2), and we have done the same exercise for the short leg (Figure 3).
The January Momentum basket retained a large proportion of the COVID bet, with around 60% of the longs and shorts remaining in their top and bottom deciles respectively.
Figure 2: Momentum Longs (Decile 1 = best)
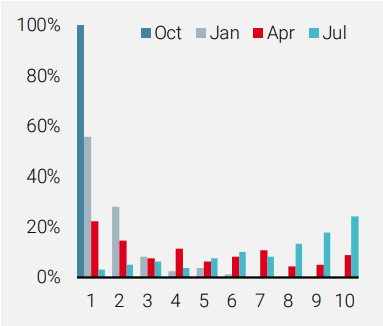
Source: Unigestion. As at 1July 2021
Figure 3: Momentum Shorts (Decile 10 = worst)
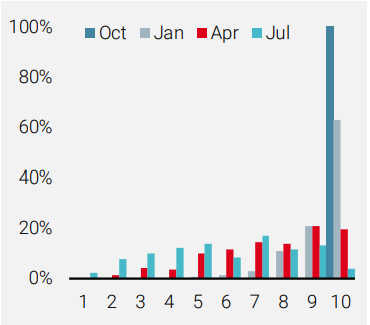
The January Momentum basket still retained a large proportion of the COVID bet with around 60% of the long and shorts remaining in their top and bottom deciles respectively. In the April rebalance, we lost the COVID market crash from the lookback period, which proved a catalyst for a strong rotation. Indeed, one can argue that by April, Momentum had lost much of its COVID bet. By the start of July, the position is even more extreme, with a large proportion of the stocks which were in the long basket in October, now in the short basket; a partial inversion of the portfolio held only six months earlier.
By April 2021, Momentum had lost much of its COVID bet and by the beginning of July the position is even more extreme, with a large proportion of the stocks which were in the long basket in October, now in the short basket.
Delving further, we can see that these ‘long movers’ intuitively fit a COVID bet rotation. Health Care stocks which might have benefitted from the pandemic have reverted sharply. Similarly, some software companies which initially benefited from the remote working scenario now constitute some of the poorest recent performers. And while materials stocks may be considered more cyclical, we see precious metals miners transitioning from long to short (Figure 4).
Figure 4: Momentum ‘Long-to-Short’ movers by Industry Group
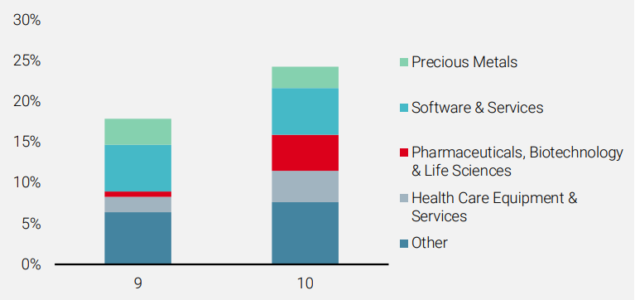
Source: Unigestion. As at 1 July 2021
It is clear then that Momentum has changed character, but how do we convince ourselves that this reflects a shift in exposure to the COVID bet?
June 2021: last gasp of the old dynamic?
Stock performance in June 2021 was characterised by a reversion to some of the themes prevalent in the ‘pre-vaccine’ COVID months as investor confidence was shaken by the rise of the Delta variant. The Value factor, whose performance has also been closely tied with the COVID outlook, had a strong reversal following a relentless march upwards at the start of the year. This gives us the opportunity to ask how the Momentum rebalances have impacted exposure to the COVID bet.
Stock performance in June was characterised by a reversion to some of the themes prevalent in the ‘pre-vaccine’ COVID months.
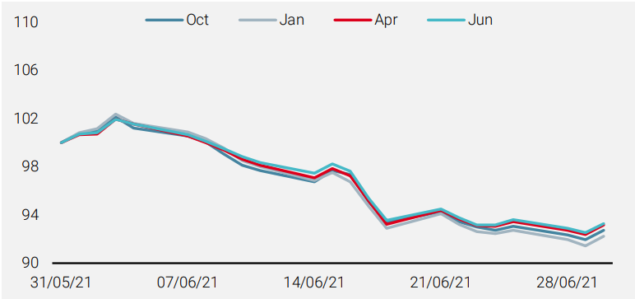
We tracked the performance of the long-short Momentum baskets constructed at the beginning of October, January, April and June through June. This highlights how the changing shape of Momentum impacted performance during a month characterised by the market dynamic seen in 2020.
Figure 5: Performance of each historic Momentum basket if it were held from end May 2020 to end June 2021
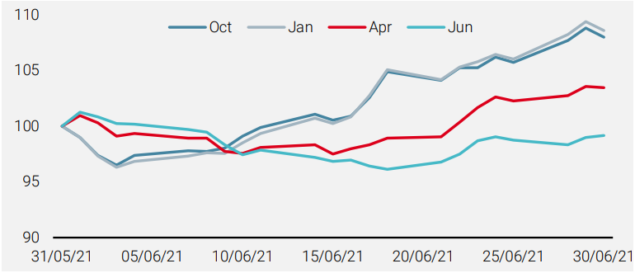
Source: Unigestion. As at 1 July 2021
It is clear to see the hierarchy of performance: the older the basket, the higher the impact of the COVID bet. The baskets from October and January are highly sensitive to the theme – while the neutral performance of the June portfolio emphasises how Momentum has become largely uncorrelated to this dynamic.
Sectors which exhibited muted net exposure in October now command significant weight in the portfolio.
The sector positioning through time gives further intuitive weight to this theory, illustrated below in Figure 6. Not only has there been a complete reversal of some of the net exposures in October (notably Tech, Health Care and Financials) but also sectors which exhibited muted net exposure now command significant weight (Consumer Discretionary, Consumer Staples and Industrials).
Figure 6: Global long-short Momentum net sector exposure at each rebalancing
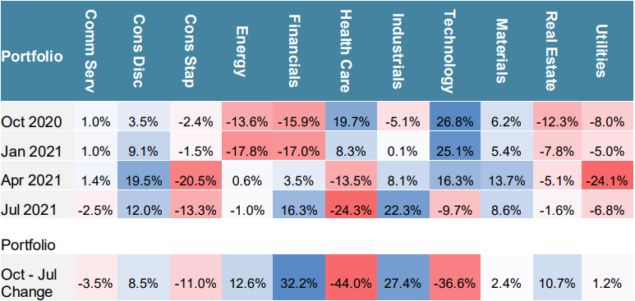
Source: Unigestion. As at 1 July 2021
Momentum and Value: not friends, but not enemies?
The Momentum factor has historically exhibited on average a persistent negative correlation with Value. Indeed, during the COVID crisis, Momentum’s outperformance was mirrored by the stark underperformance of Value.
The Momentum and Value factors have historically exhibited a strong negative relationship, however over the last six months the two have become weakly positively related.
We can observe the expected forward looking relationship between Value and Momentum by looking at the correlation between their scores (Figure 7). This metric has moved from some of its lowest levels since 1998, to some of its highest, in the space of the last 6 months. Momentum and Value are then weakly positively related – having been strongly negative.
Figure 7: Value-Momentum Factor Score Correlation
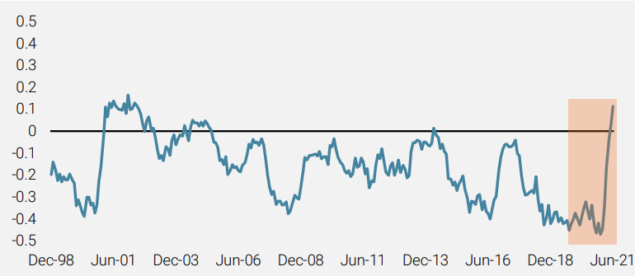
Source: Unigestion. As at 1 July 2021
As sentiment changed following the ‘Vaccine Rally’, Value has enjoyed a strong run of performance. A natural conclusion might be that, as Momentum and Value have coalesced, Value’s relationship with the COVID bet has also weakened.
Value has enjoyed a strong run of performance following the vaccine rally.
To consider this, we repeat the same analysis conducted for Momentum by looking at the transition of the L/S Value portfolio stocks through subsequent rebalances. We see a much slower decay away from the October basket for Value, indicating that Value is likely to continue its relationship with the broader thematic.
Figure 8: Value Longs (Decile 1 = best)
Source: Unigestion. As at 1 July 2021
Figure 9: Value Shorts (Decile 10 = worst)
This observation is confirmed by the remarkably similar performance of each of the historic Value baskets in June 2021.
Figure10: Performance of Historic L/S Value Baskets in June 2021
Source: Unigestion. As at 1 July 2021
With respect to the COVID bet, we conclude that while Momentum has changed – Value has not.
Where Momentum gains would have once offset Value losses, the relationship between the two is likely to be more blurry going forward, producing a more diversified set of returns.
So where Momentum gains would have once offset Value losses (and vice versa), the relationship between the two is likely to be much more blurry going forward. At the level of the factor portfolio, then, rather than having two broadly cancelling positions, we should enjoy a more diversified set of returns.
Conclusion: momentum rebalancing in turbulent markets
The Momentum factor, by nature of its construction, exhibits the largest turnover of all the traditional equity factors. When markets move hard and fast, what was once ‘Momentum’ might not be so currently.
The COVID crisis has been a perfect example of this playing out and highlights the importance of looking through the Momentum basket to understand its sensitives. Historical correlations can be misleading when the factor baskets are changing this fast.
We see clear evidence that not only has Momentum changed character dramatically, but that this can be seen as a neutralisation of the COVID bet that dominated 2020. While its relationship with Value has also shifted, we do not see evidence that Value has lost its sensitivity to the COVID bet. The result is a more diversified set of factor bets.
1We construct a Momentum factor which ranks stocks on their ‘12 minus 1 month’ performance, normalized by stock volatility and go 100% long the top decile, 100% short the bottom decile. Stocks are weighted by their factor score within each leg. The score is region neutralized to avoid large regional exposures, but sector biases persist.
Important Information
Past performance is no guide to the future, the value of investments, and the income from them change frequently, may fall as well as rise, there is no guarantee that your initial investment will be returned. This document has been prepared for your information only and must not be distributed, published, reproduced or disclosed by recipients to any other person. It is neither directed to, nor intended for distribution or use by, any person or entity who is a citizen or resident of, or domiciled or located in, any locality, state, country or jurisdiction where such distribution, publication, availability or use would be contrary to law or regulation.
This is a promotional statement of our investment philosophy and services only in relation to the subject matter of this presentation. It constitutes neither investment advice nor recommendation. This document represents no offer, solicitation or suggestion of suitability to subscribe in the investment vehicles to which it refers. Any such offer to sell or solicitation of an offer to purchase shall be made only by formal offering documents, which include, among others, a confidential offering memorandum, limited partnership agreement (if applicable), investment management agreement (if applicable), operating agreement (if applicable), and related subscription documents (if applicable). Please contact your professional adviser/consultant before making an investment decision.
Where possible we aim to disclose the material risks pertinent to this document, and as such these should be noted on the individual document pages. The views expressed in this document do not purport to be a complete description of the securities, markets and developments referred to in it. Reference to specific securities should not be considered a recommendation to buy or sell. Unigestion maintains the right to delete or modify information without prior notice. Unigestion has the ability in its sole discretion to change the strategies described herein.
Investors shall conduct their own analysis of the risks (including any legal, regulatory, tax or other consequences) associated with an investment and should seek independent professional advice. Some of the investment strategies described or alluded to herein may be construed as high risk and not readily realisable investments, which may experience substantial and sudden losses including total loss of investment. These are not suitable for all types of investors.
To the extent that this report contains statements about the future, such statements are forward-looking and subject to a number of risks and uncertainties, including, but not limited to, the impact of competitive products, market acceptance risks and other risks. Actual results could differ materially from those in the forward-looking statements. As such, forward looking statements should not be relied upon for future returns. Targeted returns reflect subjective determinations by Unigestion based on a variety of factors, including, among others, internal modeling, investment strategy, prior performance of similar products (if any), volatility measures, risk tolerance and market conditions. Targeted returns are not intended to be actual performance and should not be relied upon as an indication of actual or future performance.
No separate verification has been made as to the accuracy or completeness of the information herein. Data and graphical information herein are for information only and may have been derived from third party sources. Unigestion takes reasonable steps to verify, but does not guarantee, the accuracy and completeness of information from third party sources. As a result, no representation or warranty, expressed or implied, is or will be made by Unigestion in this respect and no responsibility or liability is or will be accepted. All information provided here is subject to change without notice. It should only be considered current as of the date of publication without regard to the date on which you may access the information. Rates of exchange may cause the value of investments to go up or down. An investment with Unigestion, like all investments, contains risks, including total loss for the investor.
Legal Entities Disseminating This Document
UNITED KINGDOM
This material is disseminated in the United Kingdom by Unigestion (UK) Ltd., which is authorized and regulated by the Financial Conduct Authority (« FCA »). This information is intended only for professional clients and eligible counterparties, as defined in MiFID directive and has therefore not been adapted to retail clients.
UNITED STATES
This material is disseminated in the U.S. by Unigestion (UK) Ltd., which is registered as an investment adviser with the U.S. Securities and Exchange Commission (“SEC”). This information is intended only for institutional clients and qualified purchasers as defined by the SEC and has therefore not been adapted to retail clients.
EUROPEAN UNION
This material is disseminated in the European Union by Unigestion Asset Management (France) SA which is authorized and regulated by the French “Autorité des Marchés Financiers” (« AMF »).
This information is intended only for professional clients and eligible counterparties, as defined in the MiFID directive and has therefore not been adapted to retail clients.
CANADA
This material is disseminated in Canada by Unigestion Asset Management (Canada) Inc. which is registered as a portfolio manager and/or exempt market dealer in nine provinces across Canada and also as an investment fund manager in Ontario, Quebec and Newfoundland & Labrador. Its principal regulator is the Ontario Securities Commission (« OSC »). This material may also be distributed by Unigestion SA which has an international advisor exemption in Quebec, Saskatchewan and Ontario. Unigestion SA’s assets are situated outside of Canada and, as such, there may be difficulty enforcing legal rights against it.
SWITZERLAND
This material is disseminated in Switzerland by Unigestion SA which is authorized and regulated by the Swiss Financial Market Supervisory Authority (« FINMA »).
Document issued July 2021.