What Is Volatility Saying About The Macro Narrative?
Head of Macro and Dynamic Allocation, Cross Asset Solutions
The macro narrative changed considerably over the last 12 months: from a transitory inflation shock to runaway inflation, from supporting growth and unemployment to fighting inflation, from liquidity injections and goldilocks to balance sheet reduction and the end of easy money. As a result, financial markets reacted sharply to this regime shift, affecting returns, correlations, and dispersions across and within assets. Since the rising risk of recession could spell a new chapter in the macro narrative in the coming quarters and alter central bank priorities yet again and the type of hedges required by investors, it seems crucial to analyse what the volatility complex is currently saying.

Shake It Up

What’s Next
Implied volatility indicates high levels of stress …
Comparing the percentiles of implied volatility for different asset classes allows to identify the nature of risk aversion. Historically, the higher the percentile of implied volatility and the more correlated the spike across assets, the bigger the systemic risk and the macro deterioration. The best example of such a situation remains the GFC as shown in the Figure 1. During this period, every single asset was in the top percentile of stress and at the same time. The current situation is far from this kind of risk aversion. Implied volatility for equities appears high at 78%, but it’s significantly lower than March 2020 or during Q1 2012. Currencies such as the USDJPY and USDMXN or Gold exhibit similar moderation, with 1-month implied volatilities around the 50 percentile, far from their historical extremes.
Figure 1: Implied volatility for main asset classes (percentile, 3mth moving average)
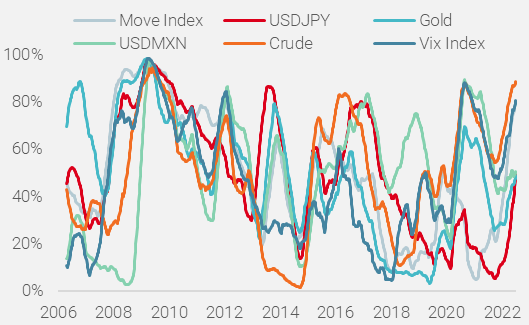
Source: Bloomberg, Unigestion, as of 13 July 2022
As shown in the Figure 1, there are only two assets that reflect an extreme level of stress: Energy, with an implied volatility for Crude at the 88 percentile and the US Treasuries, whose Move Index stands above the 80 percentile. For these two assets, current levels are the highest since the GFC, reflecting the macro U-turn on inflation and the tightening of financial conditions. We believe that a significant increase in recession risk would be concurrent with a rising implied volatility for FX and equities, toward the levels seen in 2008.
… but no significant change in spot/implied relationship
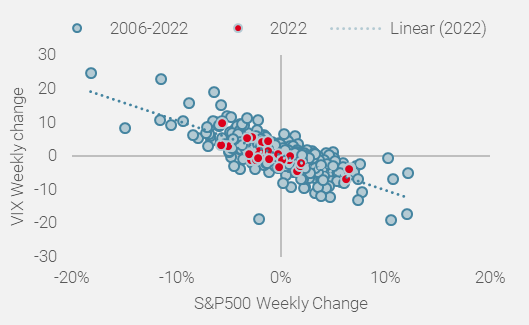
In June 2022, the three key global asset classes – equities, bonds and commodities – delivered negative monthly returns over the same period. This rare event only happened 26 times since 1990, less than 10% of the time. Despite this dramatic situation for beta and growth oriented assets, implied equity volatility did not react last month, as illustrated by the underperformance of the first VIX future contract versus the US spot equity index (S&P500). Indeed, the performance of the PPUT Index in excess of the S&P500 was flat last month, versus positive (+2.4%) in April 2022, when equities lost 8%, a similar performance to the one observed in June. This situation raised the relevance of optional strategies used to benefit from Vega convexity to hedge portfolios against macro-economic shocks. Historically, the performance ratio between equities and the VIX is around 4, meaning that in absolute terms, a 1% change in the S&P500 would imply a 4% move for the VIX, or around 1 point of volatility. Figure 2, which plots the weekly performance for US equities and the VIX index since 2006, shows no significant break in this relationship, signifying that June 2022 could be an exception rather than a new regime.
Figure 2: Next Twelve Months (NTM) Sales and EPS Estimates for the S&P 500
Sources: Bloomberg, Unigestion. Data as at 17.07.2022.
Beneath the surface, the message could be different…
The benefits of using optional equity strategies to protect the growth bias of any portfolio depend on various parameters. While the relationship between the VIX and the equity index is the most important one, potential gains coming from Vega, Gamma or Theta effects can result from several factors, such as: the starting level of volatility, the timing of the shock, the degree of hedges implemented by investors ahead of the shock, the positioning of market dealers and retail with respect to implied volatility, or the nature of the shock (idiosyncratic vs systemic). Recently, one element diverged: the volatility of implied volatility, or the VVIX index. As shown in Figure 3, the VVIX/VIX ratio reached very low levels, coming from a sharp decline of the VVIX relative to VIX Index. Volatility of Volatility reached 90% last week, from 125% in March 2022.
Figure 3: VVIX / VIX ratio
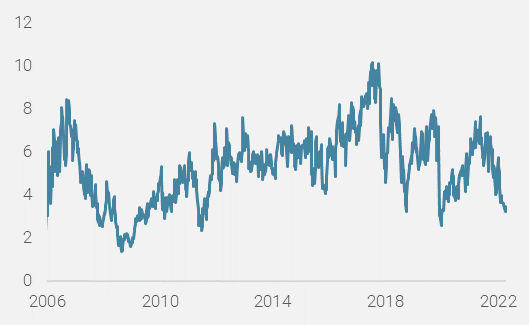
Sources: Bloomberg, Unigestion. Data as at 17.07.2022.
This decline indicates that investors do not expect large moves in the VIX for the coming months, either due to lack of hedging demand following massive de-risking by flexible and systematic strategies in the first part of the year, or because volatility markets have already discounted a lot and offer poor sensitivity and leverage to market weakness at these levels. An implied volatility at 30% corresponds to an 8.7% monthly move or 4.2% weekly one, which underlines the challenging breakeven constraints for optional strategies. As an example, the 1yr 1σ tails for the S&P500 is 3250-4650. For the US 10yr it’s 2.0-4.0% and US$70-160 for Brent.
This lack of reaction of the VIX to the VVIX is something new as shown in the Figure 4, which depicts the three month changes for both indices. The sensitivity of the VIX to the VVIX has been significantly lower this year than in the past, despite the large amplitude of change in the VVIX and explains, in our view, the recent disappointing performance of convexity embedded in optional equity structures.
Figure 4: VVIX vs VIX (Weekly change, 2006-2022)
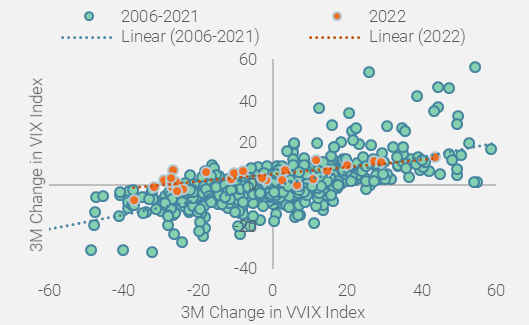
Sources: Bloomberg, Unigestion. Data as at 17.07.2022.
Is the bottom near?
The historical pattern of VVIX/VIX ratio suggests a near term bottom may be in place. As shown in Figure 5, the ratio at these lows usually signals a peak for risk aversion, followed by a bottom for growth oriented assets. Nevertheless, the current widening of credit spreads – although large – appears too moderate versus past episodes and not aligned with the level of volatility ratios that would warrant a confident reengagement of risk.
Figure 5: Volatility ratio vs credit spreads
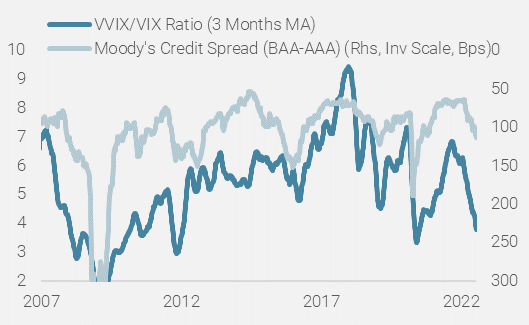
Sources: Bloomberg, Unigestion. Data as at 17.07.2022.
Consequently, and despite the positive signals coming from the VVIX, which is the only convex metric that trades below its March 2020 levels, we continue to believe that a peak in monetary policy normalisation will equate to a flat US 2-10yr curve and nominal rates at 3.5%, combined with negative earnings growth for 2022 that would push the SP500 to 3400/3500, 10% lower than current levels and 30% below the all-time high. This should result in a VIX above 35, which in turn would signify a better risk/reward for equities and bonds, as most of the recession risk and the inflation shock would be priced in at that point.
Unigestion Nowcasting
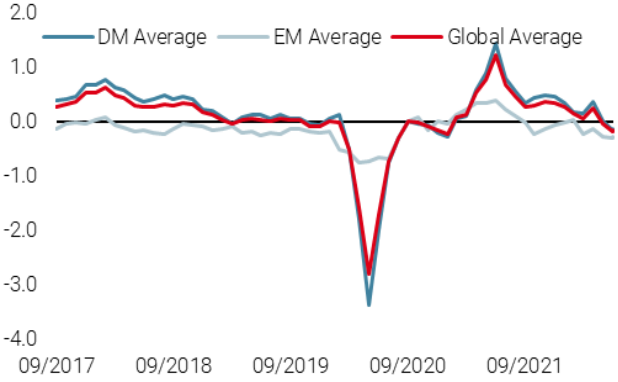
World Growth Nowcaster
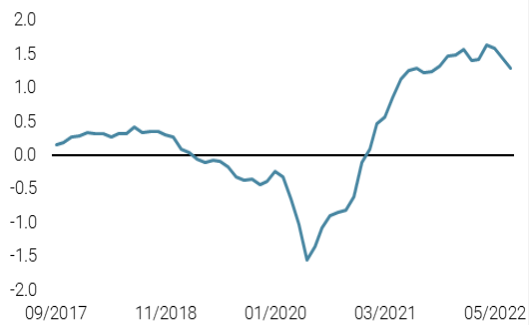
World Inflation Nowcaster
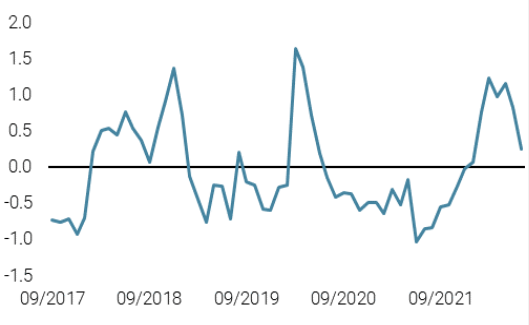
Market Stress Nowcaster
Weekly Change
- Last week, our World Growth Nowcaster ticked slightly lower as growth in US and Europe slowed further, while Chinese data stabilised at low levels.
- Our World Inflation Nowcaster moved down slightly with some easing in inflationary pressures in the US and Eurozone.
- Our Market Stress Nowcaster moved lower last week, as volatility component eased considerably.
Sources: Unigestion, Bloomberg, as of 15 July 2022.
Important Information
This document is provided to you on a confidential basis and must not be distributed, published, reproduced or disclosed, in whole or part, to any other person.
The information and data presented in this document may discuss general market activity or industry trends but is not intended to be relied upon as a forecast, research or investment advice. It is not a financial promotion and represents no offer, solicitation or recommendation of any kind, to invest in the strategies or in the investment vehicles it refers to. Some of the investment strategies described or alluded to herein may be construed as high risk and not readily realisable investments, which may experience substantial and sudden losses including total loss of investment.
The investment views, economic and market opinions or analysis expressed in this document present Unigestion’s judgement as at the date of publication without regard to the date on which you may access the information. There is no guarantee that these views and opinions expressed will be correct nor do they purport to be a complete description of the securities, markets and developments referred to in it. All information provided here is subject to change without notice. To the extent that this report contains statements about the future, such statements are forward-looking and subject to a number of risks and uncertainties, including, but not limited to, the impact of competitive products, market acceptance risks and other risks.
Data and graphical information herein are for information only and may have been derived from third party sources. Although we believe that the information obtained from public and third party sources to be reliable, we have not independently verified it and we therefore cannot guarantee its accuracy or completeness. As a result, no representation or warranty, expressed or implied, is or will be made by Unigestion in this respect and no responsibility or liability is or will be accepted. Unless otherwise stated, source is Unigestion. Past performance is not a guide to future performance. All investments contain risks, including total loss for the investor.
Unigestion SA is authorised and regulated by the Swiss Financial Market Supervisory Authority (FINMA). Unigestion (UK) Ltd. is authorised and regulated by the UK Financial Conduct Authority (FCA) and is registered with the Securities and Exchange Commission (SEC). Unigestion Asset Management (France) S.A. is authorised and regulated by the French “Autorité des Marchés Financiers” (AMF). Unigestion Asset Management (Canada) Inc., with offices in Toronto and Montreal, is registered as a portfolio manager and/or exempt market dealer in nine provinces across Canada and also as an investment fund manager in Ontario and Quebec. Its principal regulator is the Ontario Securities Commission (OSC). Unigestion Asset Management (Copenhagen) is co-regulated by the “Autorité des Marchés Financiers” (AMF) and the “Danish Financial Supervisory Authority” (DFSA). Unigestion Asset Management (Düsseldorf) SA is co-regulated by the “Autorité des Marchés Financiers” (AMF) and the “Bundesanstalt für Finanzdienstleistungsaufsicht” (BAFIN).