2020 US Election: Limited Impact Points To Lower But Still Positive Risk-Reward
2020 US Election: limited impact points to lower but still positive risk-reward
- Current polling suggests this year’s US election will be a tight race. However, the choice of Democratic candidate is still unclear and could remain so until late into primary season.
- While the strength of the US economy should give President Trump a clear advantage, he continues to suffer from very low approval ratings, among other headwinds.
- Although political uncertainty could hurt sentiment as the election nears, we remain positive on growth-related assets, as the macro environment remains supportive.
Overview
The 2020 US election got off to an interesting start last night in Iowa with technical difficulties delaying results of the Democratic caucuses while Donald Trump picked up all Republican delegates as expected. While President Trump will almost certainly be the Republican nominee for president, the Democratic nominee is much less obvious. Whoever that candidate is will face an incumbent president at a significant handicap, given the strong political headwinds facing Trump. Legislative policy is unlikely to be significantly impacted since Congress will probably remain split, making it extremely difficult to pass any large, non-bipartisan legislation. However, other policies that would be the purview of a Democratic White House, such as deregulation and the environment, may pose threats to certain sectors and firms, as well as US bond yields. Nevertheless, we remain positive on growth assets (US, but also more broadly) since the macro picture remains supportive, even if sentiment may reduce their risk-reward.
The Rules and Calendar of the Primaries Mean We Will Not Know Trump’s Challenger for Some Time
The 2020 US election begins with each party’s presidential primary, during which states choose delegates to their party’s national convention later in the year. These delegates pledge to vote for a particular candidate at the convention, and the candidate with a majority of delegates is selected as the party’s nominee for the presidential election in November.1 In the absence of a tail event that would preclude Donald Trump from seeking re-election, it is safe to assume he will be the nominee of the Republican Party.
For the Democratic Party, the picture is much less clear. No candidate has consistently polled above 30%, making it hard to say there is a clear front-runner. Nonetheless, the rules and timing of the Democratic presidential primary are helpful to understanding how it may play out. Overall, there are 3,979 Democratic pledged delegates to be selected, requiring a potential nominee to secure 1,990 of them to attain a majority during the first round of voting at the convention. In addition to these 3,979 pledged delegates, there are 771 “automatic” delegates, who were called “superdelegates” in previous primaries. Unlike past Democratic primaries, where these superdelegates could significantly sway the vote, they will not be allowed to participate in the first round of voting at the convention. Rather, they will only vote if there is a brokered convention (no candidate gets a majority on the first ballot), essentially acting as a tiebreaker in additional rounds of voting. So far, many of these automatic delegates have not endorsed a candidate yet, and this will likely remain the case so that they can maintain their flexibility to avoid a messy, drawn-out convention.

There is a reasonable probability that the Democratic nominee will be uncertain heading into the Democratic National Convention in mid-July.

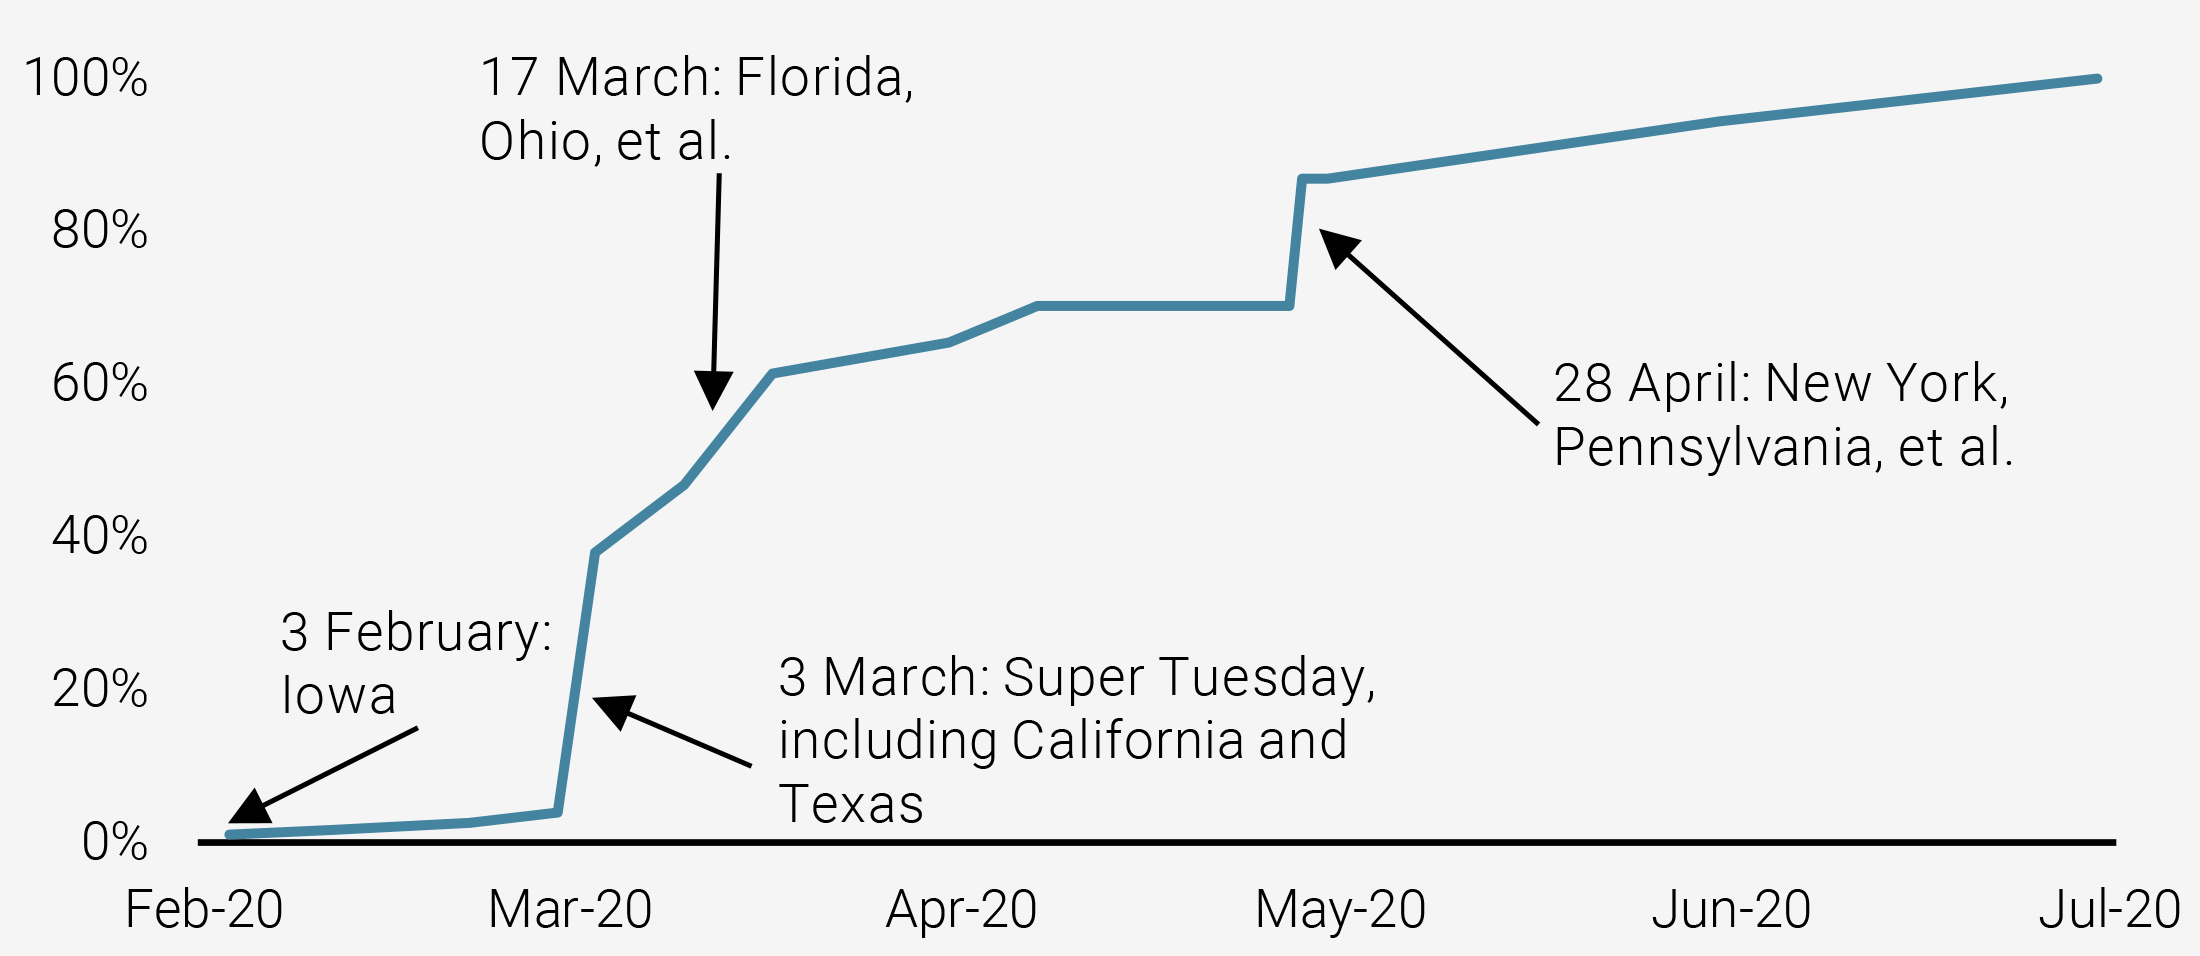
Unlike the 2016 Republican presidential primary, which had widely varying rules for allocating delegates to candidates for each state, the rules for the 2020 Democratic primary are rather uniform from state to state. Delegates are allocated proportionally based on their statewide vote share, along with their local district2 vote share, with a 15% cut-off (i.e., any candidates with less than 15% of the vote are excluded). Nearly 65% of the pledged delegates (2,591) are allocated using the local district vote share, with the remaining 35% (1,388) allocated using the statewide vote share. This means that a candidate who misses the 15% cut-off at the state level may still pick up delegates at the local level if they did better than 15% in some districts. By and large, however, one should expect delegates to be allocated proportionally by vote share, so as the primaries come closer and there is more accurate polling, the allocation of delegates will become clearer. However, given the state of polling today (see below), the inability of any candidate to take and hold a commanding lead, and the proportional allocation of delegates, there is a reasonable probability that the nominee will be uncertain heading into the Democratic National Convention in mid-July. Figure 1 below shows how the pledged delegates will accumulate over the first half of next year, along with some important dates to watch closely for signs of Democratic primary voters coalescing behind a candidate.
Figure 1: Cumulative Pledged Delegates (% of total)
The Eventual Democratic Nominee Remains Unclear
Following the 2016 presidential election, the Democratic Party has been pulled in two different directions: the progressive wing of the party has pulled it further to the left, while moderate Democrats have pulled it to the centre. Thus far, this tension has largely played to the benefit of Democrats, allowing them to field more moderate candidates in right-leaning elections, while more progressive candidates have scored wins in more left-leaning elections. Indeed, during the 2018 midterm election, Democrats took control of many seats in the House of Representatives by running candidates in Republican-held districts who were moderate and could capitalise on voter unease with President Trump.
However, the presidential primary is a national election and thus lays bare these two divergent views on the future of the Democratic Party and the country as a whole. On one side, the more moderate wing of the party has supported candidates like former Vice President Joe Biden (who remains on top of most polls) and Mayor Pete Buttigieg. On the other side, the progressive wing of the party has been a strong supporter of Senator Bernie Sanders, as well as Senator Elizabeth Warren. Other candidates have failed to gain traction and dropped out, while others continue to campaign, notably Senator Amy Klobuchar, Michael Bloomberg, and Andrew Yang. Figure 2 highlights how the national polls have evolved over the last year.3
Figure 2: Democratic National Primary Polling (30-day moving average)
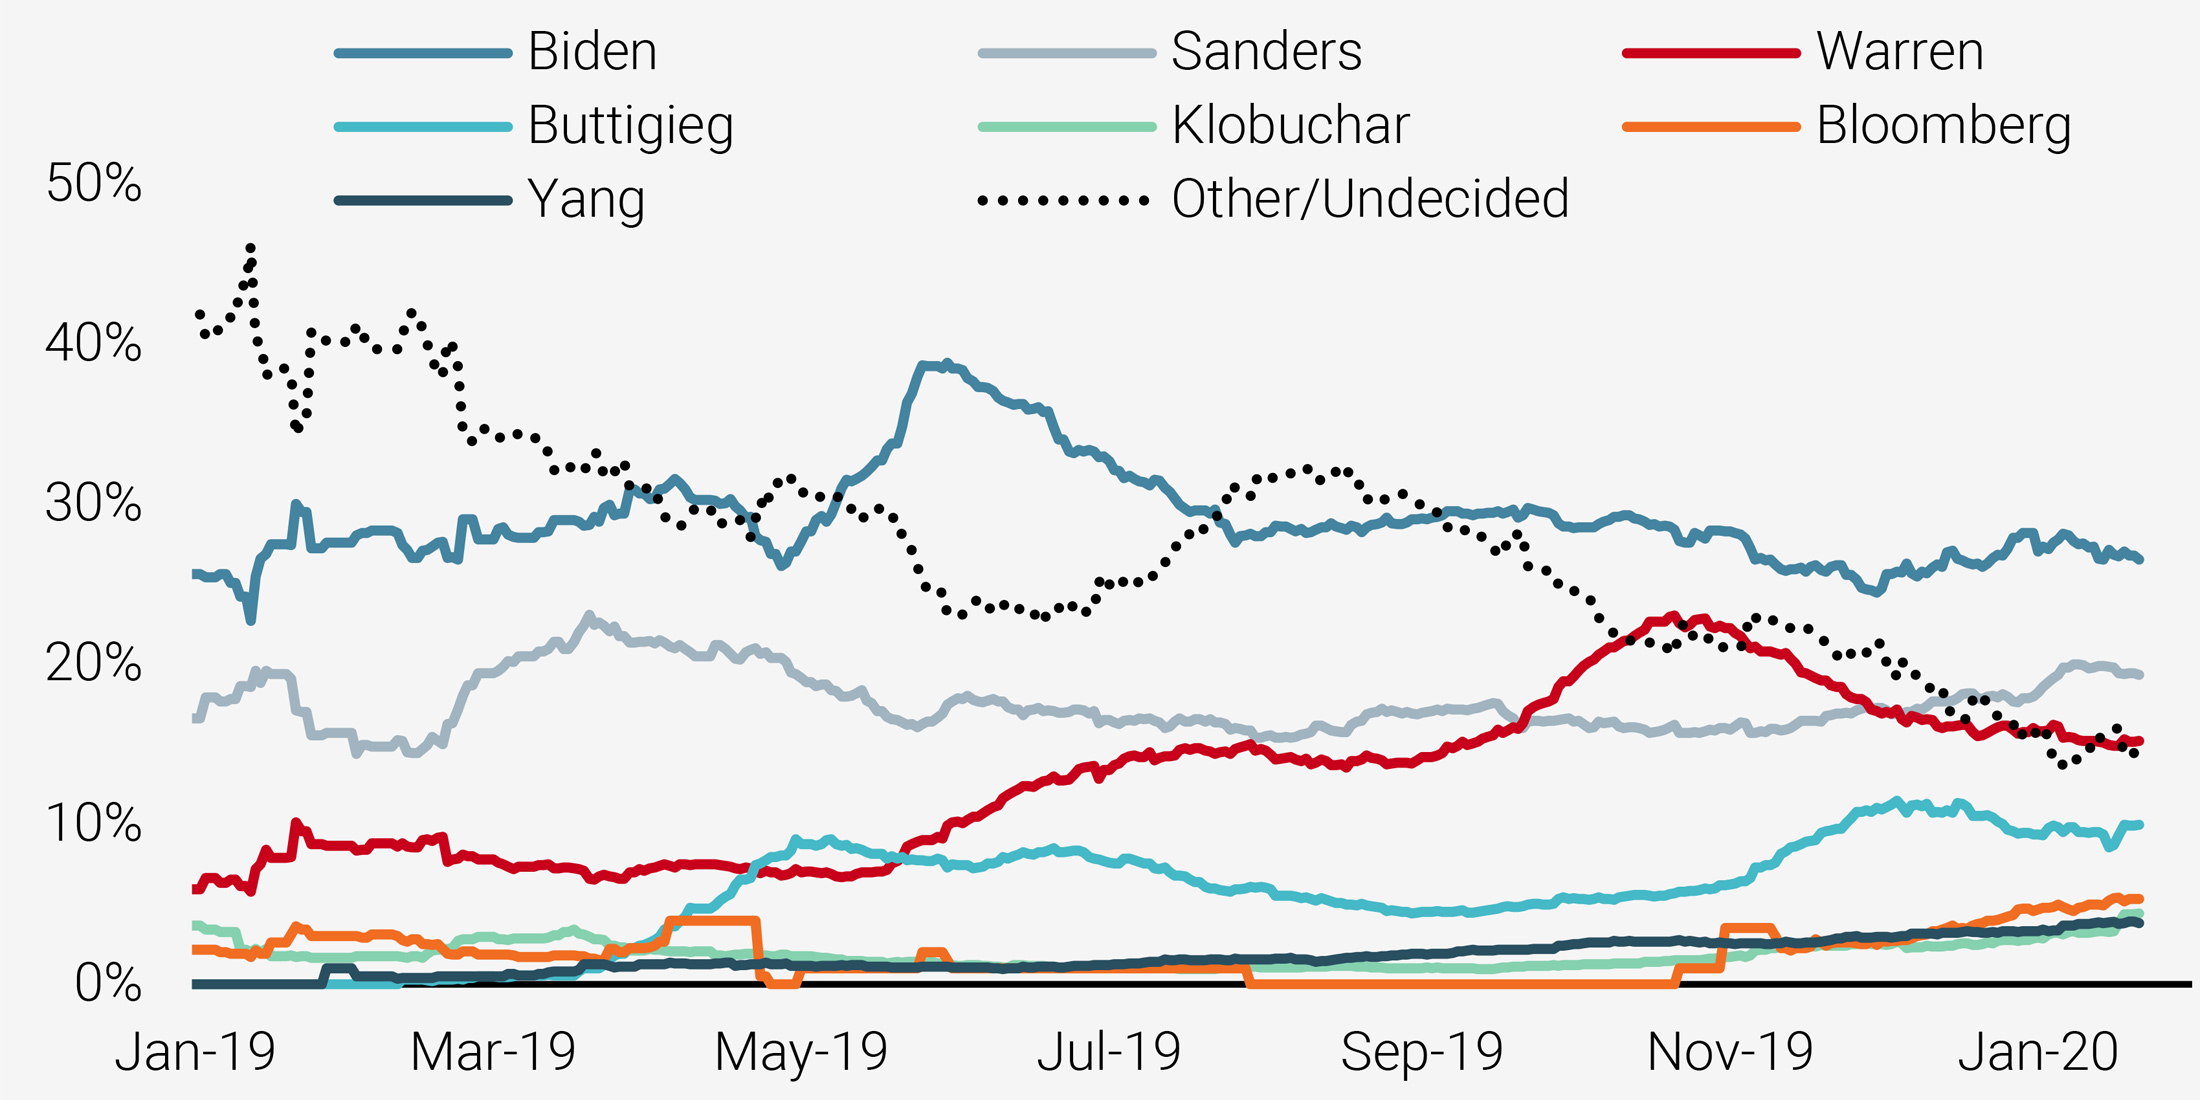
There are a few key takeaways from the polling data:
- While Biden and Sanders have largely held steady, Warren and Buttigieg have seen their support rise and fall, suggesting some elasticity to their coalition;
- Klobuchar, Bloomberg, and Yang have not consistently polled above 5%, though Bloomberg’s numbers have been rising as he announced his candidacy recently;
- There remains a large number of voters (nearly 20%) who are backing another candidate (there are many candidates polling in the 1-2% range) or are undecided, implying that as these voters switch preferences or ultimately choose a candidate, we may a see a large shift in the polling.
Given the state of polling and the ability of candidates to generate strong momentum (and reversals) during the early part of the primary season, it remains uncertain who the eventual Democratic nominee will be. March 3 will be an important marker, as some candidates may build momentum from Super Tuesday while underperformers will likely drop out shortly thereafter.
By many metrics, President Trump should be clear front-runner. However, Trump is not the typical incumbent and faces some significant headwinds in 2020.
President Trump Is neither Inevitable nor Improbable
The eventual Democratic nominee will face off against an incumbent president who, by many metrics, should be a clear front-runner: the economy continues to grow at a healthy pace, unemployment is at multi-decade lows, stock markets are at all-time highs, and military conflicts have been contained (for now). However, President Trump is not the typical incumbent and faces some significant headwinds heading into 2020:
- His net approval rating (percentage approving minus disapproving of the President) has remained in the -10% to -15% range and was only positive shortly after his inauguration. No president going back to Harry Truman has maintained such a negative view among Americans for so long;
- The 2018 midterm election (as well as other special elections after 2016) has often been framed as a referendum on President Trump, and the results are not encouraging for him: Republicans lost the House popular vote by 8% along with 40 House seats (they did net two additional seats in the Senate), with voter turnout (50%) exceeding all midterm elections going back to 1946 and approaching the 2016 presidential election turnout (56%);
- Finally, Trump has been impeached by the House (in a near-party-line vote) and now faces the possibility of a trial in the Senate before Election Day. While the likelihood of getting two-thirds of the Republican-held Senate to vote for his removal is low, about 47% of Americans think he should be removed from office. Importantly, nearly 42% of independents agree, suggesting that it is not just Democrats who want to see President Trump out of office.
While much will depend on who the Democrat party nominates, for now, head-to-head polls suggest the contest will be close.
Of course, the actual person the Democrat Party nominates to challenge President Trump will be key in assessing the likelihood of Trump’s re-election. For now, head-to-head polls suggest the contest will be close. Figure 3 shows the average margin of Democratic candidates against Trump (so a value of 2% for Biden means that he is beating Trump by an average of 2% in head-to-head polls).4
Figure 3: General Election Polling vs Trump (30-day moving average)
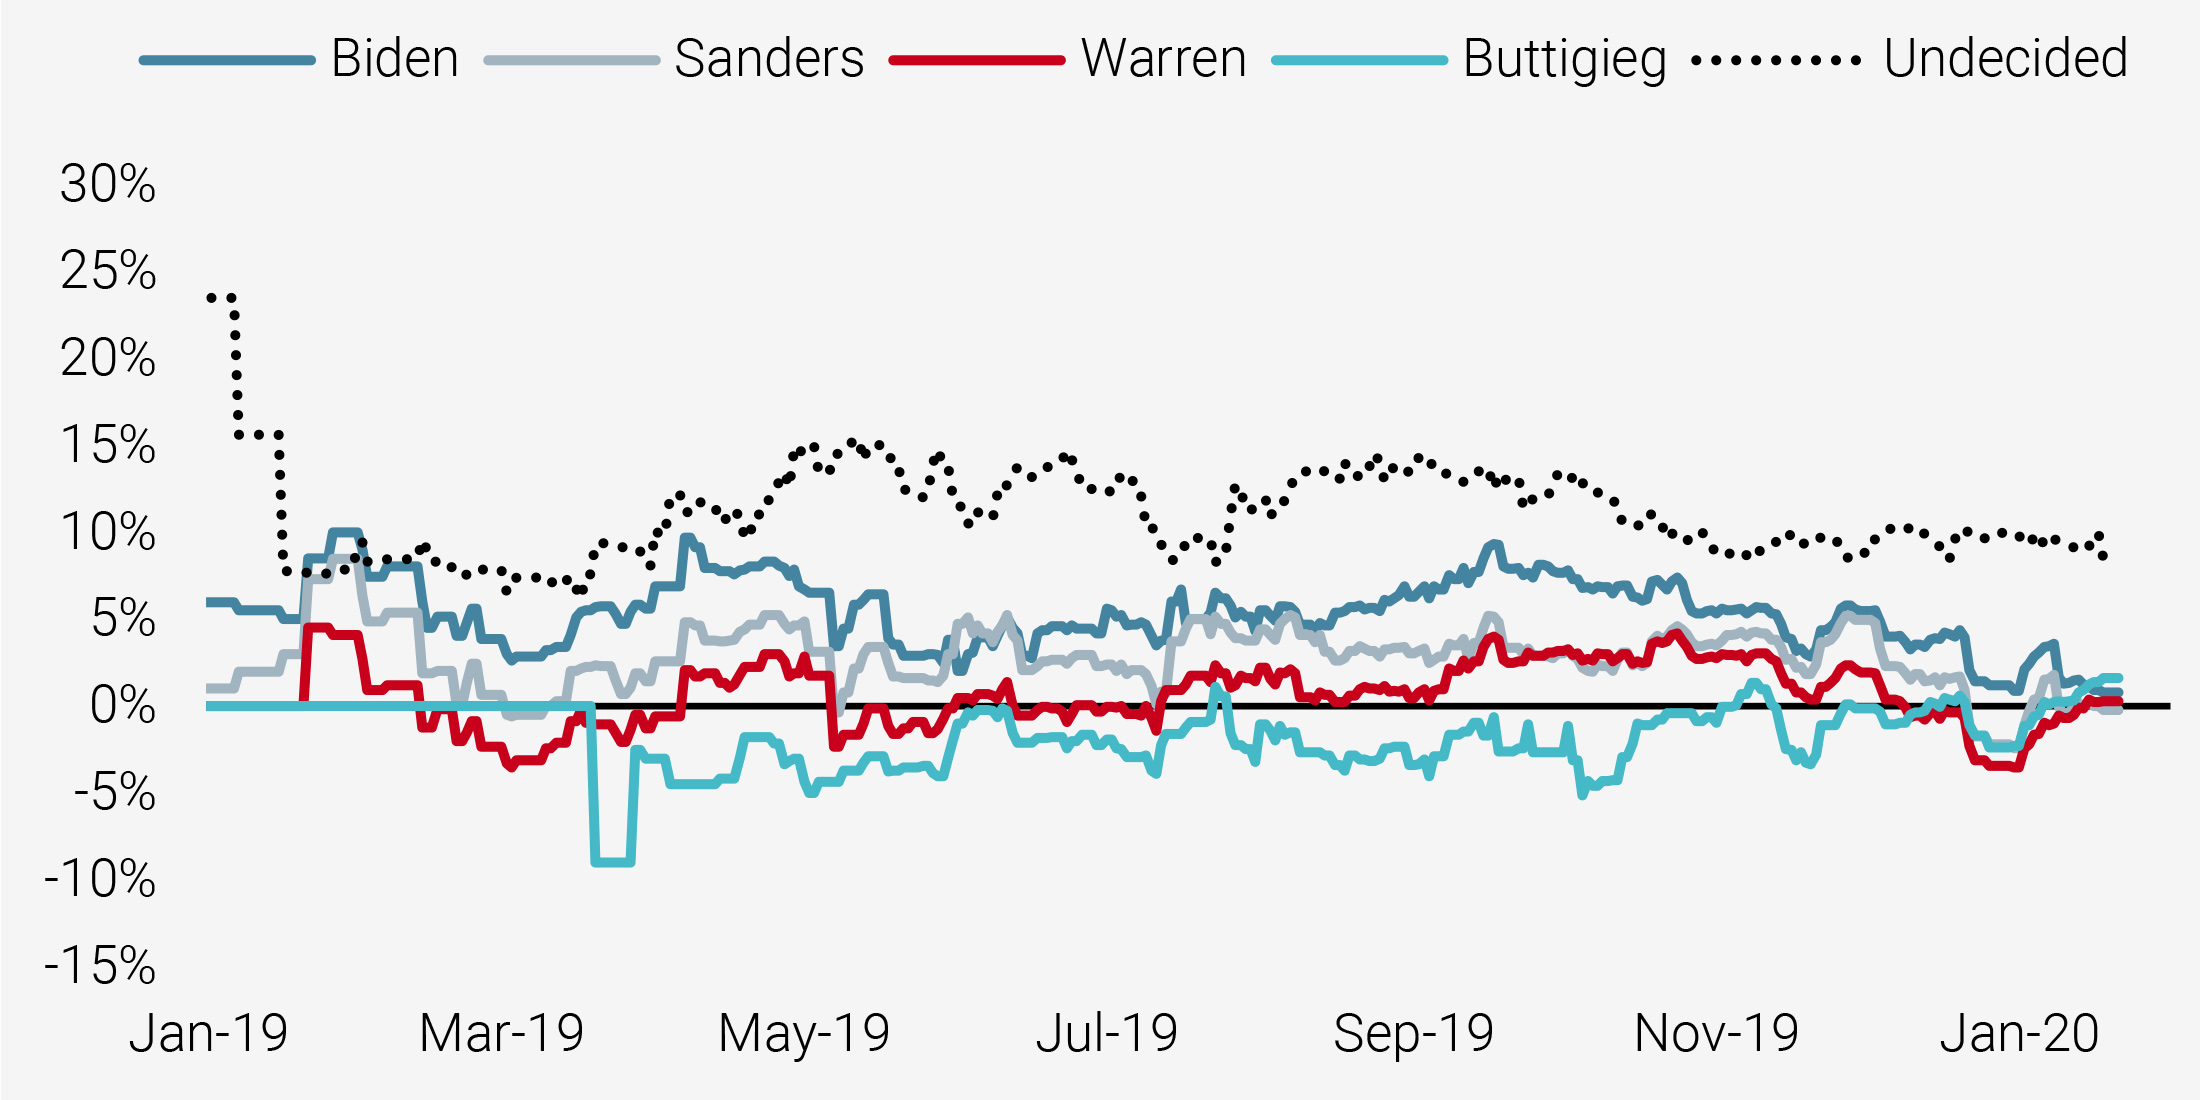
Broadly, the election would be a toss-up at this point. No potential Democratic nominee has a clear edge against Trump. Even Biden, who had a nearly 10% lead on Trump in September last year, is tied with the President today. Moreover, there are about 10% of undecided voters, adding further uncertainty to any claim that there is a clear case for any presidential nominee. It is also helpful to bear in mind that the actual contest is nearly a year away, and we would want to see how the numbers look in the few months before the election.
For context, looking back at the last four presidential elections when an incumbent was running (2012: Obama vs Romney, 2004: Bush vs Kerry, 1996: Clinton vs Dole and Perot, 1992: Bush vs Clinton), the incumbent had a reasonable lead on the challenger for the first the first three of these contests heading into Election Day and won. From August5 to November, Obama averaged a 2% edge over Romney, Bush a 3% lead over Kerry, and Clinton a 10% edge over Dole and Perot combined. In the latter election, the elder President Bush trailed Clinton by about 12% on average since August and lost re-election.6 The Electoral College may play to President Trump’s benefit, but if he trails the popular vote by much more than 2% (the 2016 popular vote margin), it will be difficult to make up the deficit.
We do not expect fiscal policy to change much, but financial markets will react to changes in polling as investors reassess their own probabilities for fiscal policy.
Democratic Policy Proposals Look to Undo Trump’s
We do not expect fiscal policy to change much depending on who is eventually elected president, unless we see a significant “wave” election that gives one party a strong majority in both chambers of Congress. If Trump is re-elected and Democrats continue to hold the House (which they seem likely to do), policy will continue as it has for the last year: bipartisan measures with White House support (e.g., USMCA) will work their way into law, while other measures will languish (e.g., immigration reform). If Trump loses but the Democrats are not able to take a strong majority in the Senate (to overcome potential filibusters), the Democratic president’s agenda will be limited to those policies that have broad appeal. There are additional measures that could be used to enact policy (executive orders, the reconciliation process, eliminating the filibuster), but these are unlikely to produce large, systemic changes or could face legal challenges.
However, as the election approaches, financial markets will react to changes in polling as investors reassess their own probabilities for fiscal policy. While President Trump has not indicated a meaningful change in his policy stance, the Democratic candidates’ policy proposals do differ significantly from current policy and, in some cases, from each other. Figure 4 presents some of the key domestic policy questions addressed by the top four Democratic candidates.
Figure 4: Key Domestic Policy Proposals
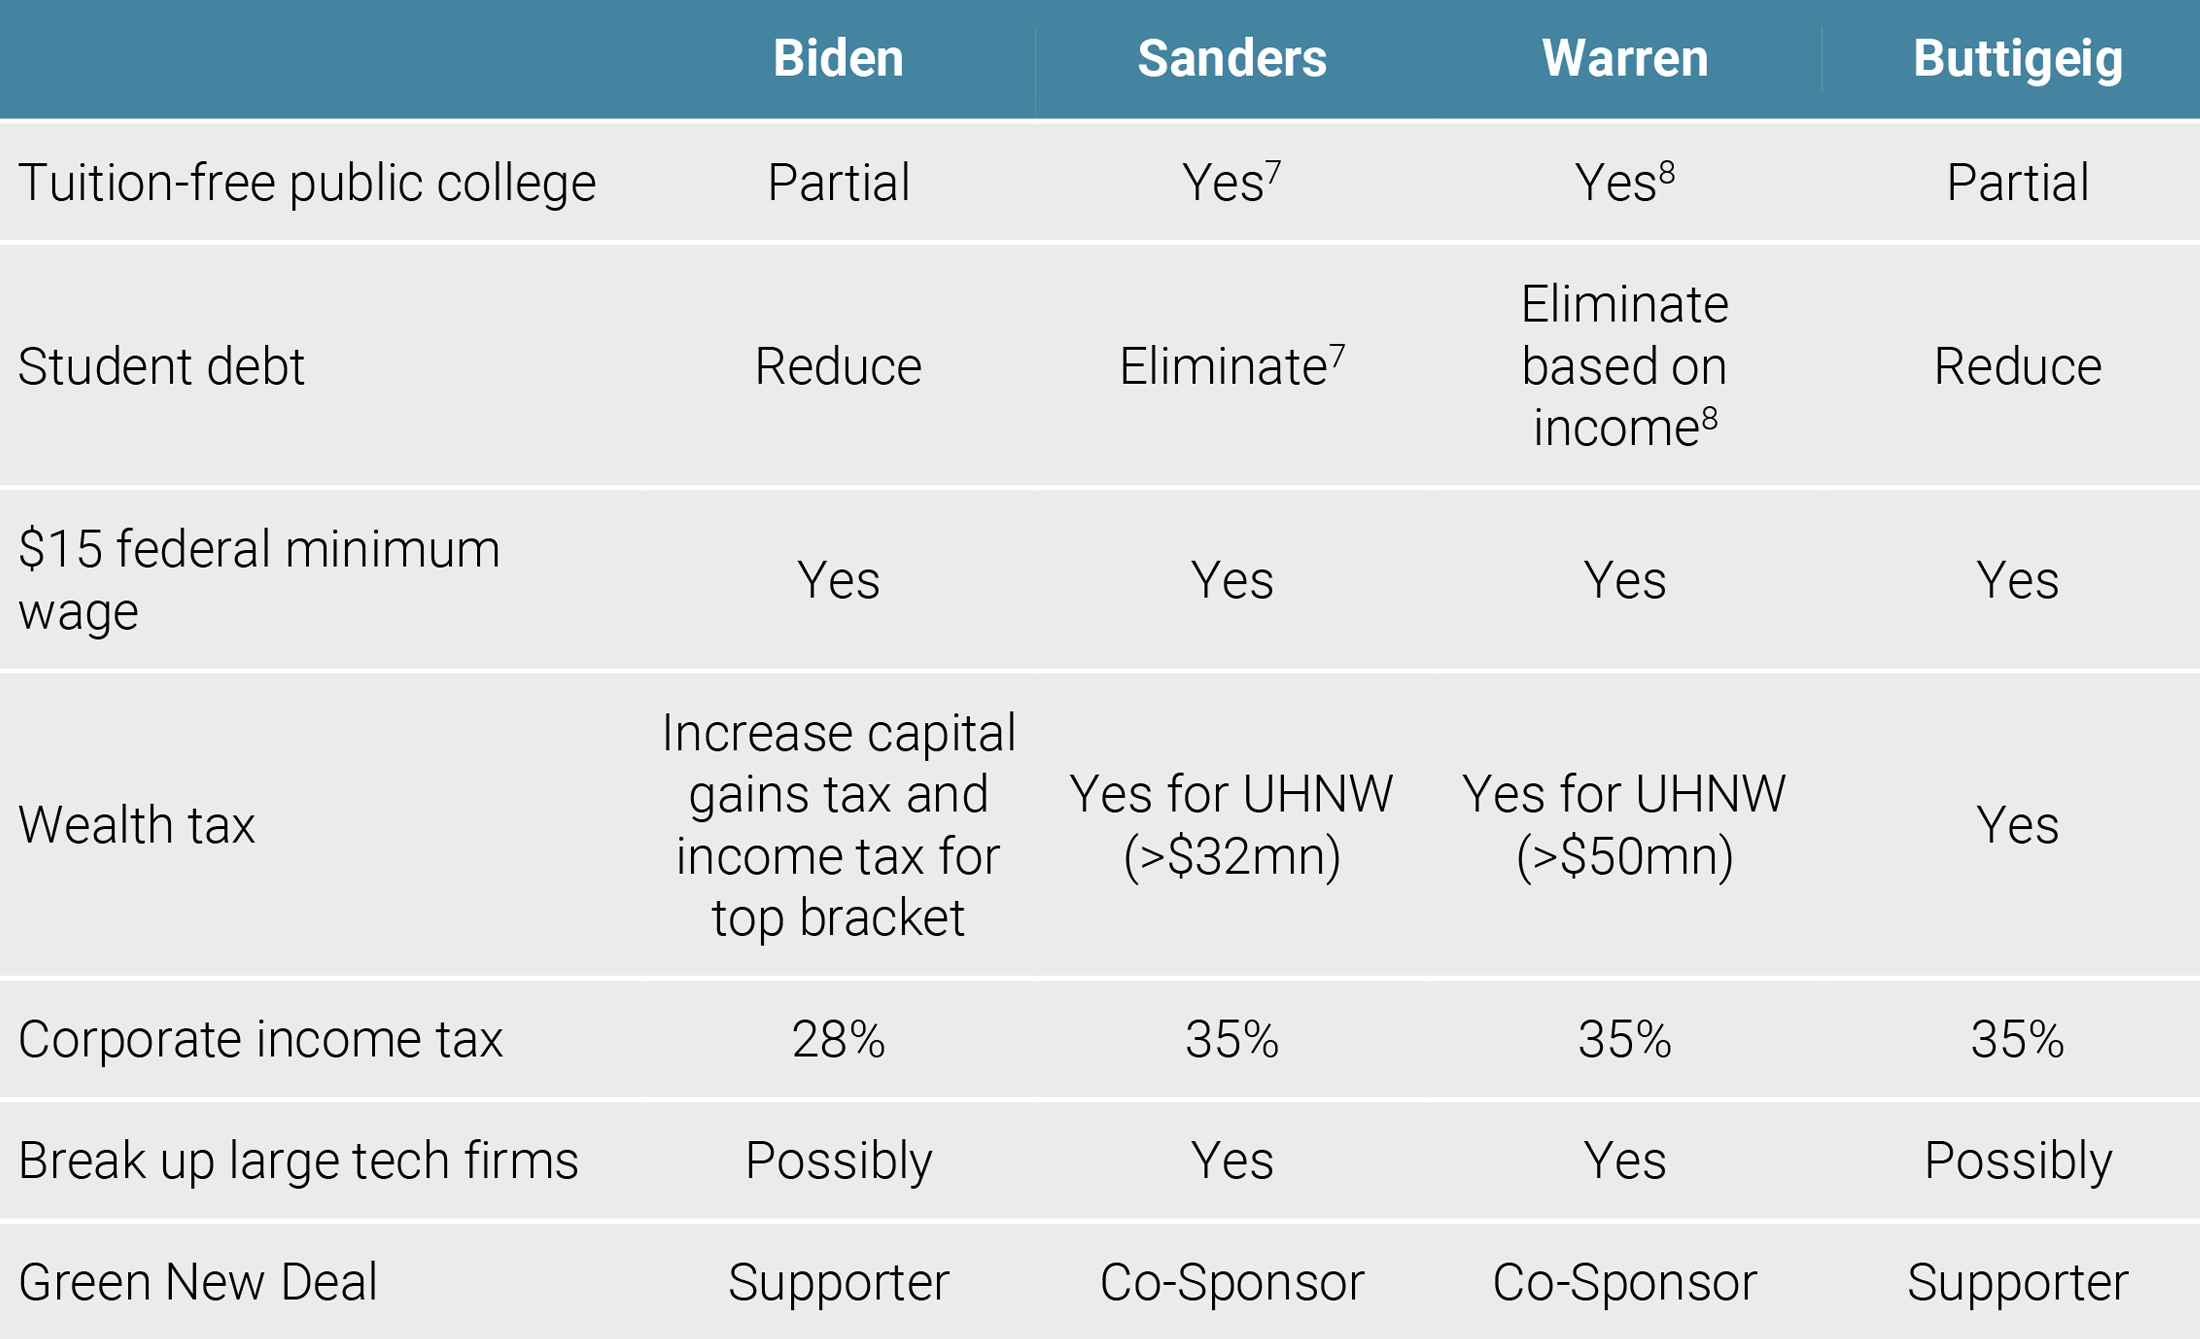
By and large, all of the these candidates’ policies aim to undo Trump’s accomplishments, especially the Tax Cuts and Jobs Act, and use new tax revenues to help pay for a variety of proposals aimed at low- and middle-income Americans.
While more factors than just politics drive equity markets, it also seems clear that markets have preferred Republican presidents to Democratic ones.
Reduced but not Eliminated Risk-Reward
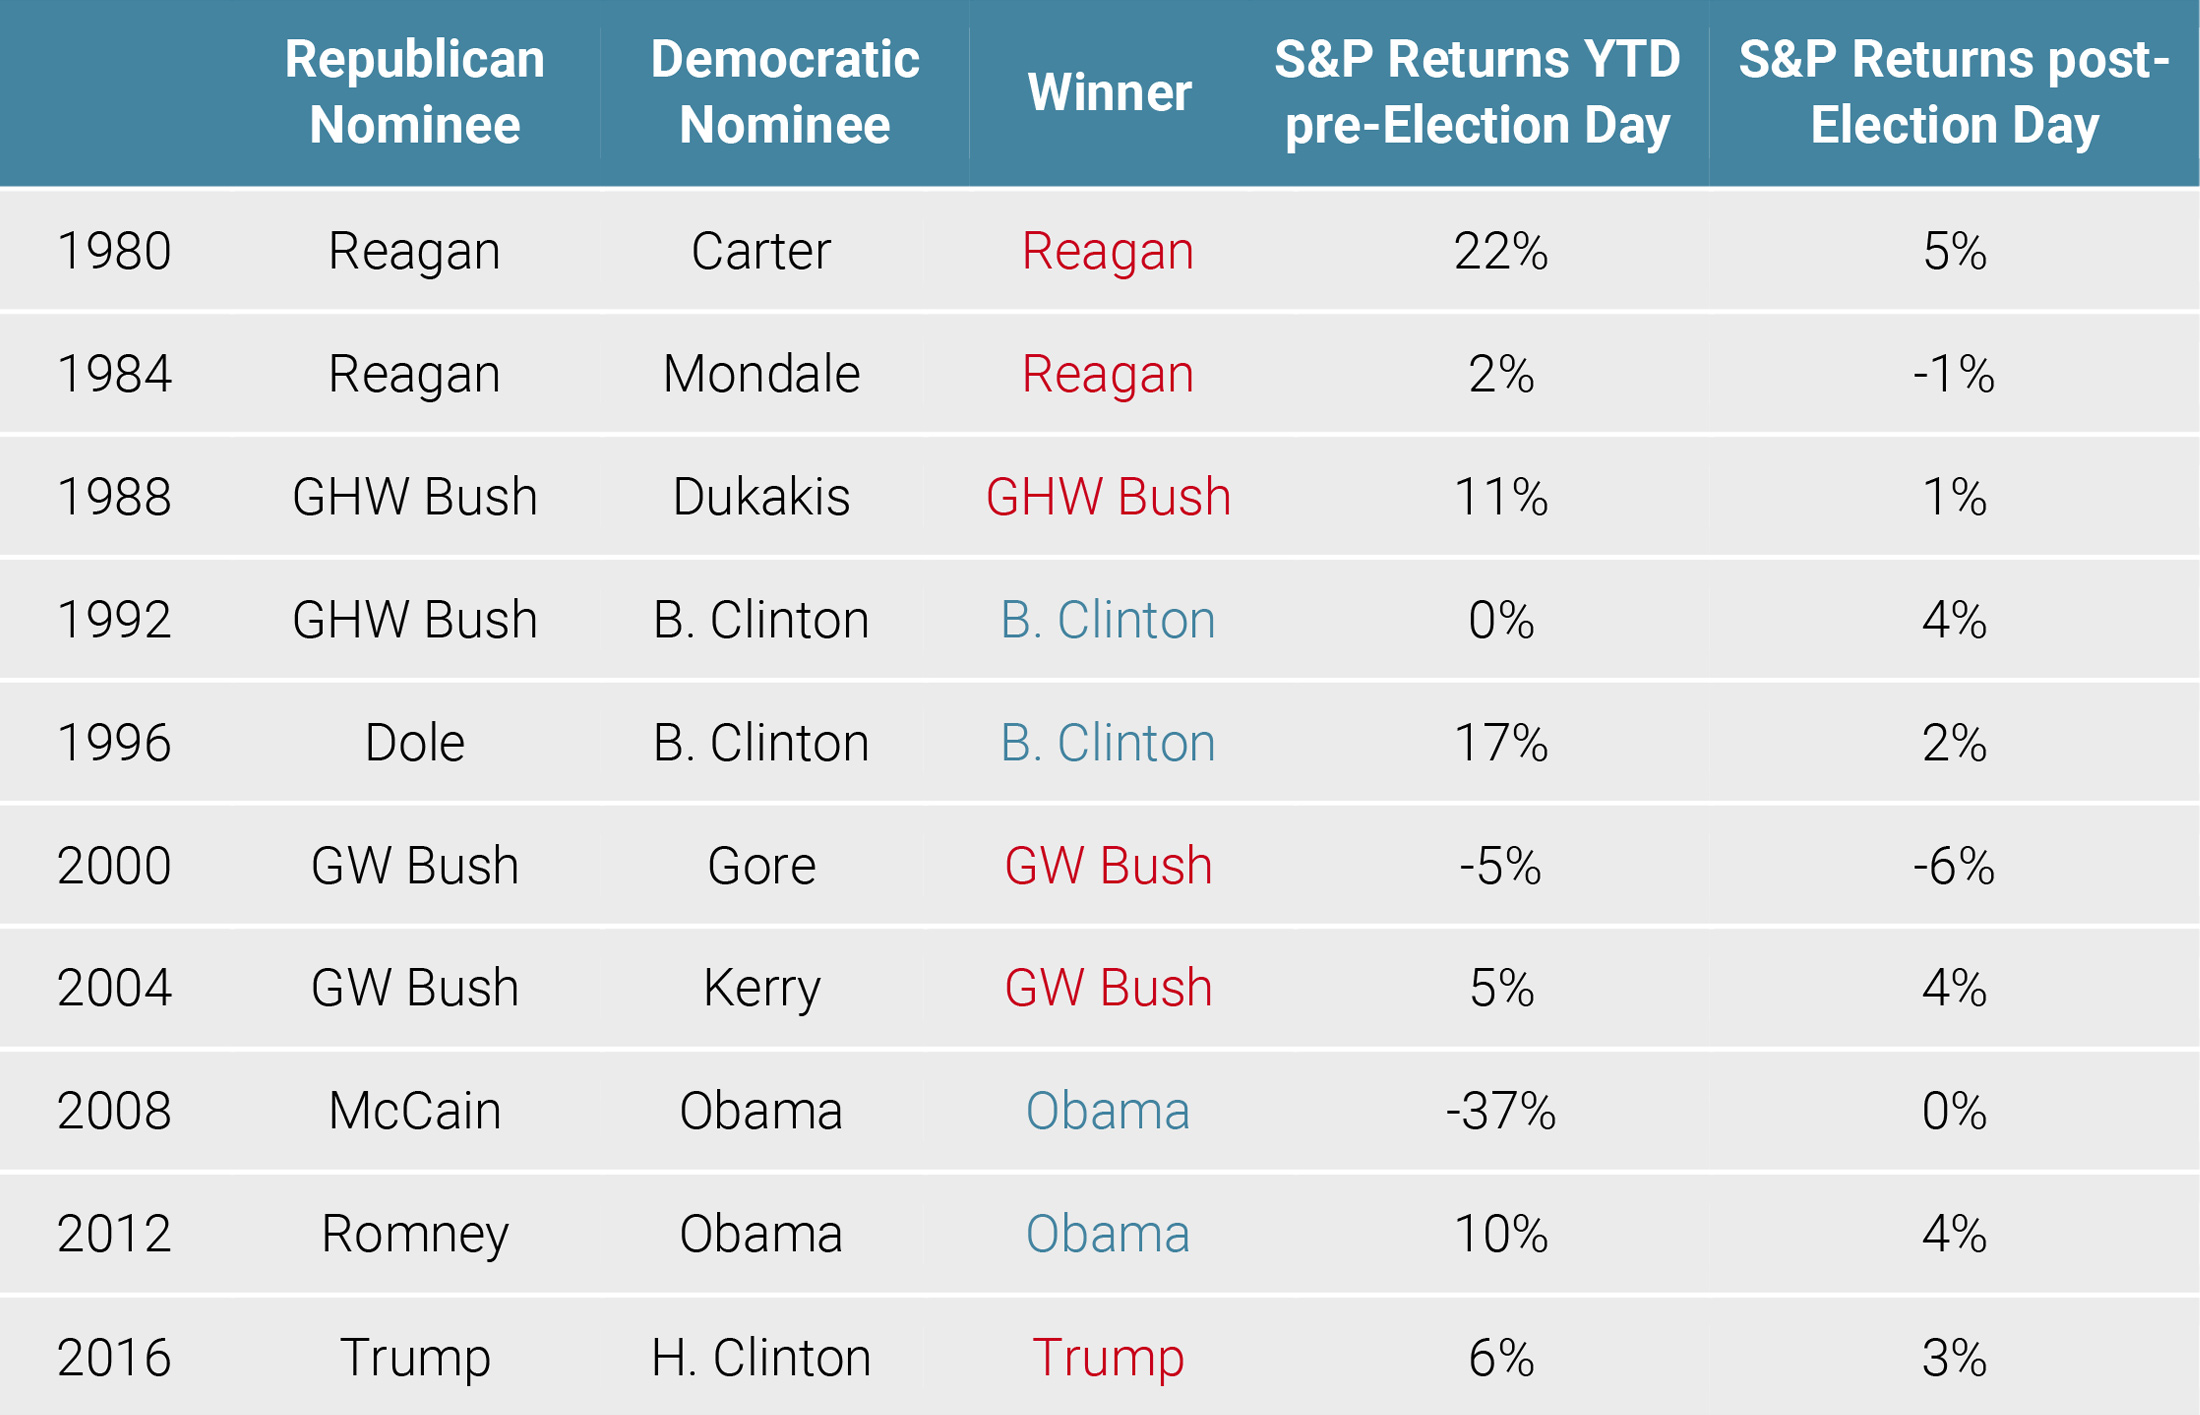
The ability of a potential Democratic candidate to follow through on campaign promises and deliver on these policies is limited without a strong majority in the Senate. Nevertheless, domestic policy is likely to become a key risk factor to financial markets as we approach Election Day. Going back to 1980, we can see that for years when a Republican won the presidency, the S&P 500 on average was up 24% from the beginning of the year to Election Day and another 5% over the rest of the year. On the other hand, for years when a Democrat won the presidency, the S&P 500 on average was up 2% YTD heading into Election Day and down 2% over the rest of the year. Excluding the 2008 election when a Democratic win coincided with the GFC, the S&P on average was up 12% going into Election Day and rose a meagre 1% after Election Day. While more factors than just politics drive equity markets, it also seems clear that markets have preferred Republican presidents to Democratic ones.9
Figure 5: Performance of the S&P 500 During Election Years
This election year will likely see a continuation of this dynamic as the marginal investor prices in the possibility of a Democrat in the White House. From our perspective, a few markets are especially exposed to this political risk:
- Corporate equities had benefited significantly from the 2017 tax cuts, passing their tax benefits nearly one-to-one to profit growth, thus any potential repricing of corporate taxes higher will be a headwind in 2020 to US equities;
- Sectors (such as metals and mining and healthcare) and firms that have benefited from Trump’s deregulation push, especially on environmental regulations, are especially at risk given that these policies are largely driven by the White House and do not typically need Congressional approval;
- The Democratic candidates’ plans for reducing student tuition and debt burdens, along with various aspects of a Green New Deal, will likely mean additional borrowing from the federal government, adding further upward pressure on US bond yields at a time when the Fed has indicated that their target rate is at a satisfactory level.
We maintain a positive view on growth-related assets in the US as we do not see a significant threat of recession in 2020.
Despite these risks, we still maintain a positive view on growth-related assets in the US since we do not see at this time a significant threat of recession in 2020. Moreover, we expect many of the Democratic primary candidates to shift toward the centre during the general election campaign once they start facing the broad electorate. Nonetheless, politics has certainly reduced the risk-reward of US assets, which points us toward looking outside America for attractive opportunities.
Conclusion
Politics typically does not play a significant role in asset allocation decisions since it has limited impact on macroeconomic forces. However, over the last few years, its influence has risen significantly due to an ageing expansion that is showing signs of stable but low growth, few inflation pressures, and a rise in populism pushing back against globalism. The US is no exception, and with policy often communicated in 280 characters over the last three years, market sentiment has been quick to react. From our perspective, the US presidential election will demonstrate whether the American electorate is as fed up with President Trump as his approval polls indicate or whether the resilient economy will make up for Trump’s faults. Even if Trump loses, we do not expect to see significant changes to policy that would seriously threaten US assets, though there are concentrated pockets of risk. The election results have a high degree of uncertainty currently, posing a threat to the improvement in market sentiment over the fourth quarter of 2019. However, we believe the risk-reward of growth assets remains supportive, albeit less so than a few months ago.
- If no single candidate has secured a majority, a “brokered convention” occurs, with all delegates released from their pledges and allowed to switch their votes in additional rounds of voting until a single candidate gets a majority.
- Most states use federal congressional districts as their basis for district, but a handful use other bases, such as state legislative districts.
- Importantly, state polls can exhibit significant divergence from national polls. For the purposes of this note, we will consider national polling however to get the overall picture of the race.
- We limit the Democratic candidates to the top four, as one of them will most likely be the nominee given the current field of candidates and polls.
- We choose August since the party nominees were set by then and it is close enough to Election Day that voters begin paying attention and the percentage of undecided voters shows clear signs of falling.
- For the 1992 election, we ignore Ross Perot as he declared his candidacy, suspended it, and then restarted it again.
- Expected to be paid for via a “Robin Hood Tax on Wall Street”: investment managers, hedge funds, and other speculators would pay a fee (0.5% for stocks, 0.1% for bonds, and 0.005% for derivatives) on each trade.
- Expected to be paid for via an “Ultra-Millionaire Tax”: households with a net worth of $50mn USD or more would pay a 2% tax on every dollar of net worth above $50mn and 6% on every dollar of net worth above $1bn.
- Expanding the universe of US corporates to the Russell 2000 does not meaningfully change the picture.
Important Information
This document is provided to you on a confidential basis and must not be distributed, published, reproduced or disclosed, in whole or part, to any other person.
The information and data presented in this document may discuss general market activity or industry trends but is not intended to be relied upon as a forecast, research or investment advice. It is not a financial promotion and represents no offer, solicitation or recommendation of any kind, to invest in the strategies or in the investment vehicles it refers to. Some of the investment strategies described or alluded to herein may be construed as high risk and not readily realisable investments, which may experience substantial and sudden losses including total loss of investment.
The investment views, economic and market opinions or analysis expressed in this document present Unigestion’s judgement as at the date of publication without regard to the date on which you may access the information. There is no guarantee that these views and opinions expressed will be correct nor do they purport to be a complete description of the securities, markets and developments referred to in it. All information provided here is subject to change without notice. To the extent that this report contains statements about the future, such statements are forward-looking and subject to a number of risks and uncertainties, including, but not limited to, the impact of competitive products, market acceptance risks and other risks.
Data and graphical information herein are for information only and may have been derived from third party sources. Although we believe that the information obtained from public and third party sources to be reliable, we have not independently verified it and we therefore cannot guarantee its accuracy or completeness. As a result, no representation or warranty, expressed or implied, is or will be made by Unigestion in this respect and no responsibility or liability is or will be accepted. Unless otherwise stated, source is Unigestion. Past performance is not a guide to future performance. All investments contain risks, including total loss for the investor.
Unigestion (UK) Ltd. is authorised and regulated by the UK Financial Conduct Authority (FCA) and is registered with the Securities and Exchange Commission (SEC). Unigestion Asset Management (France) S.A. is authorised and regulated by the French “Autorité des Marchés Financiers” (AMF). Unigestion Asset Management (Canada) Inc., with offices in Toronto and Montreal, is registered as a portfolio manager and/or exempt market dealer in nine provinces across Canada and also as an investment fund manager in Ontario and Quebec. Its principal regulator is the Ontario Securities Commission. Unigestion Asia Pte Limited is authorised and regulated by the Monetary Authority of Singapore. Unigestion Asset Management (Copenhagen) is co-regulated by the “Autorité des Marchés Financiers” (AMF) and the “Danish Financial Supervisory Authority” (DFSA). Unigestion Asset Management (Düsseldorf) SA is co-regulated by the “Autorité des Marchés Financiers” (AMF) and the “Bundesanstalt für Finanzdienstleistungsaufsicht” (BAFIN). Unigestion SA has an international advisor exemption in Quebec, Saskatchewan and Ontario. Unigestion SA is authorised and regulated by the Swiss Financial Market Supervisory Authority (FINMA). Unigestion SA’s assets are situated outside of Canada and, as such, there may be difficulty enforcing legal rights against Unigestion SA.