A new volatility regime?
What do the global financial crisis of 2008 and the recent market correction have in common? In our view, both events were driven by excessive leverage. A bubble bursting usually involves losses based on investment. However, financial bubbles created by leverage are particularly dangerous to the economic environment as they comprise unexpected losses. They are difficult to spot, especially when they appear in parallel with other bubbles (such as the technology and e-commerce bubbles in the US).
Much like assets financed by credit, shorting volatility could result in unexpected losses. In our view, the February market correction was just a warning on the short volatility bubble. In this paper, we reveal where we believe markets will go from here.
By Anisse Marzouk, Client Portfolio Manager and Alexandre Marquis, Head of Client Portfolio Managers, Equities
Is VIX still a reliable measure of volatility?
Over the last few years, markets have demonstrated incredible recovery power, particularly following significant market corrections (for example following the Brexit referendum as well as the US and European elections). The CBOE Volatility Index (VIX) is a measure of the US stock market’s near-term implied volatility and is considered to be one of the main barometers of investor sentiment and market volatility. Chart 1 below illustrates the reaction of the S&P 500 and VIX indices around President Trump’s election, when it took investors just three days to fully recover their losses.
Chart 1: The S&P’s recovery following Trump’s election
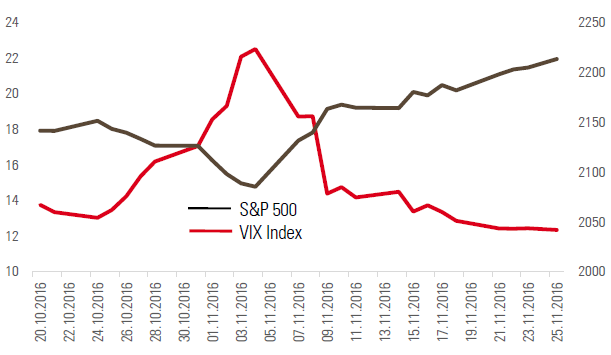
The VIX remained eerily calm in 2017, with only seven days above 15 and 52 days below 10. Investors began to question whether its stillness correctly indicated that there were no risks to financial markets in sight at the time.
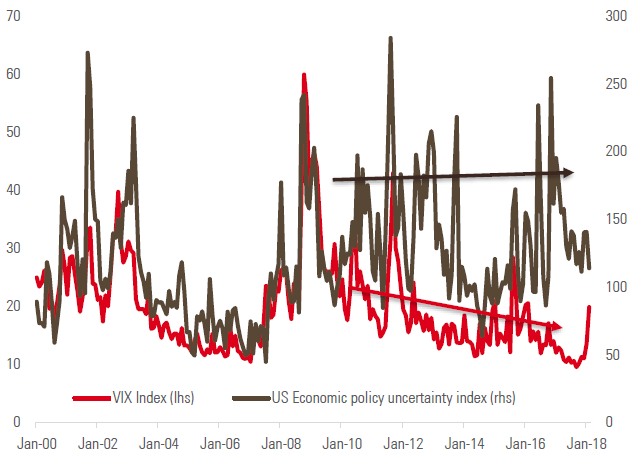
In addition, there appears to have been a divergence between the VIX and the Economic Policy Uncertainty index in recent years (Chart 2). As such, many active investors are considering whether the VIX index should still be referred to as the market’s collective ‘fear gauge’.
Table 1: The VIX index since 2010
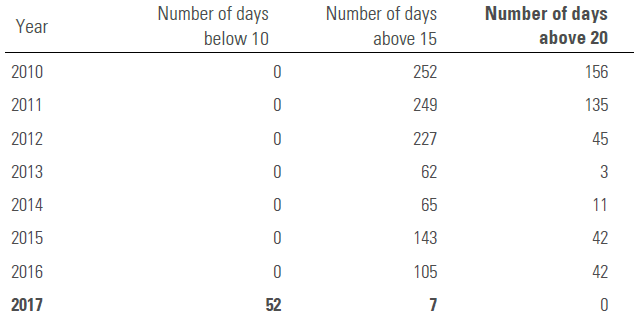
Chart 2: The decoupling of the VIX and US Economic Policy Uncertainty indices

The VIX index was originally designed to measure the implied 30-day volatility on a strip of strikes. However, we believe that looking at longer maturities and at the term structure of volatility indices such as the Euro Stoxx 50 Volatility (VSTOXX) index may be a better way to anticipate investment risk.

Is the VSTOXX index a more reliable proxy for volatility?
The VIX index was originally designed to measure the implied 30-day volatility on a strip of strikes. However, we believe that looking at longer maturities and at the term structure of volatility indices such as the Euro Stoxx 50 Volatility (VSTOXX) index may be a better way to anticipate investment risk.
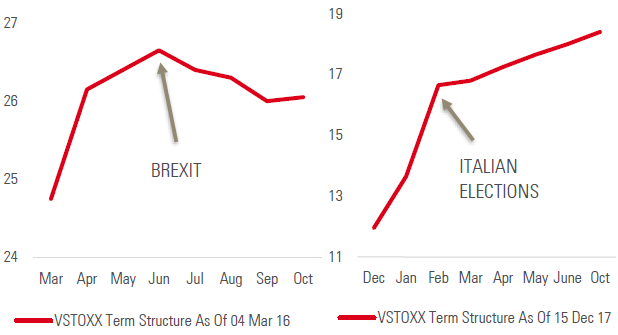
At the time of the French elections in Spring 2017, VSTOXX futures with an April maturity priced in a significant rise in volatility ahead of the elections. A similar pattern occurred for other one-off events, such as the Brexit referendum in June 2016 and the most recent Italian and German elections (see Chart 3). The behaviour of the VSTOXX index can therefore be useful for investors looking to take opportunistic and tactical positions.
Chart 3: Behaviour of the VSTOXX index before and after the French elections, Brexit referendum and Italian elections

We believe that the large scale of investment in short volatility products created a distortion in the US market and helped keep the VIX at artificially low levels prior to February’s correction.
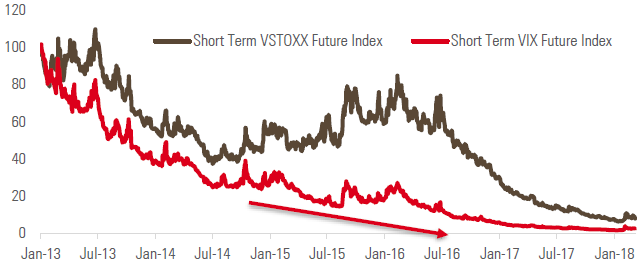
Additionally, we believe the VIX does not accurately anticipate uncertainty in the US market. For example, concerns over China’s debt and falling oil prices in 2015 and 2016 drove a significant increase in the futures VSTOXX-VIX premium. Furthermore, the VSTOXX index rose sharply ahead of the Brexit referendum on the back of global macro concerns, whereas the VIX index did not react.
Chart 4: Futures VSTOXX-VIX premium widened on macroeconomic concerns because the VIX did not react
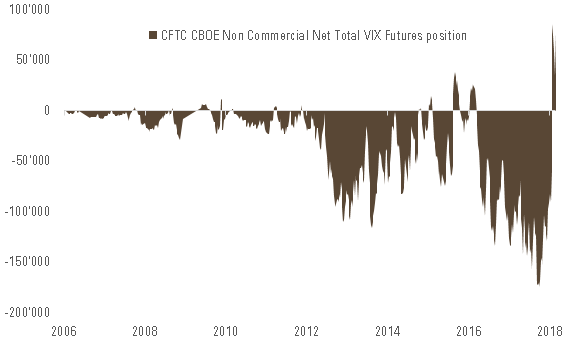
From a macroeconomic perspective, the market uncertainty witnessed in 2015 and 2016 should have also been associated with higher levels of volatility in the VIX index. However, the US market is considerably more developed than Europe in terms of access to short volatility products through retail channels. In particular, there is a plethora of Exchange Traded Products (ETPs) not only on equity indices but also on the VIX index, which is not the case for the VSTOXX. Indeed, total investment in short VIX positions was exceptionally high in 2015 and 2016, as shown in Chart 5 below. We believe that the large scale of investment in short volatility products created a distortion in the US market and helped keep the VIX at artificially low levels prior to February’s correction. This explains why over the past few years, the VSTOXX was actually a better proxy of risk than the VIX.
Chart 5: Significant short volatility positions should have been a concern for investors
During February’s market correction, there was a vicious cycle between the unwinding of short volatility positions and rises in volatility.
The XIV meltdown
During February’s market correction, there was a vicious cycle between the unwinding of short volatility positions and rises in volatility. The first led to the latter, which in turn caused investors to continue to unwind short volatility positions, leading to further increases in volatility.
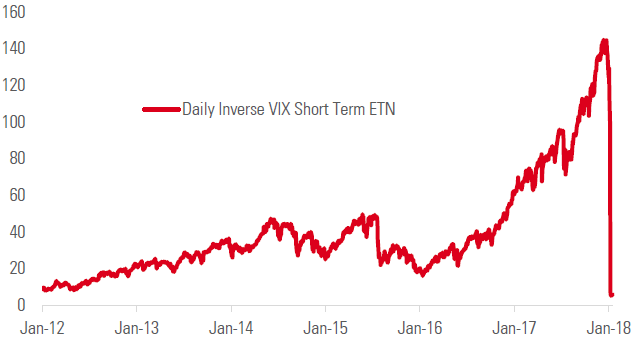
The story of the infamous VelocityShares Daily Inverse VIX Short-Term exchange-traded note, also known as XIV, provides us with some key learnings on ‘volatility risk premia’. The XIV was one of 19 exchange-traded products that tracked the VIX and enabled investors to bet against a rising VIX. On 5 February, as the VIX peaked, the exchange-traded note lost 90% of its value.
We believe the famous expression ‘volatility as an asset class’ remains a trap as positioning portfolios on volatility always consists of a swap between realised and implied volatility. Therefore, it is not a surprise that in the days following the XIV meltdown, many other providers announced a reduction in leverage by a factor of two. The unwinding of these short volatility positions have intensified the moves in volatility, which in turn led to more unwinding.
Chart 6: What could happen to a short volatility investment (short term)
We believe this unfortunate event should lead to flows into options, away from short volatility carry trades. Moreover, with the liquidation of XIV and the reduction of leverage on similar products, assets under management in these types of ETPs are back to 2012 levels. In our view, this should release the downward pressure on volatility that occurred during the past few years, especially in the US.
The short volatility trade is still crowded with longer maturities. However with a likely positive correlation between bonds and equities (down), asset managers will have to reduce their leverage, involving the unwind of long term short volatility positions that could harm the market.
Artificially low volatility remains a risk for equity markets
As some investors experienced during February’s market correction, selling volatility can be a dangerous way to generate higher yields. However, the success of these strategies over the past two years was not only achieved by positioning short VIX-related products. As mentioned above, the exposure to volatility was mainly achieved through reverse VIX products, and thus to just to a limited portion in the sellers of volatility universe. The main characteristic of these products is their maturity – they all offer short volatility exposure in the short term.
However, we believe that there are a number of other ways to sell volatility. Over the past few years, there has been a considerable appetite for investment banks’ variance risk premia packaged strategies as well as selling volatility/variance swap or delta hedged options on longer maturities, for those more sophisticated investors. Here again, trading activity in this type of product was particularly high in the US.
Recently, the US stock market has provided an attractive carry between index volatility and the volatility of the components, increasing the appeal for dispersion strategies and the sale of S&P 500 variance. Moreover, the very low volatility on longer maturities in the US offered an attractive carry for the S&P 500, especially against other regions such as the Eurozone, where investors could sell variance on the US market and limit their exposure by buying variance in other regions. The short volatility trade is still crowded with longer maturities. However with a likely positive correlation between bonds and equities (down), asset managers will have to reduce their leverage, involving the unwind of long term short volatility positions that could harm the market.
The Fed and share buybacks: cheap debt to buy expensive equity?
In addition to short volatility positions, there is another mechanism which has contributed to the astonishingly fast recovery of the US markets: share buybacks. This was probably a key factor in preventing an even deeper market correction in February.
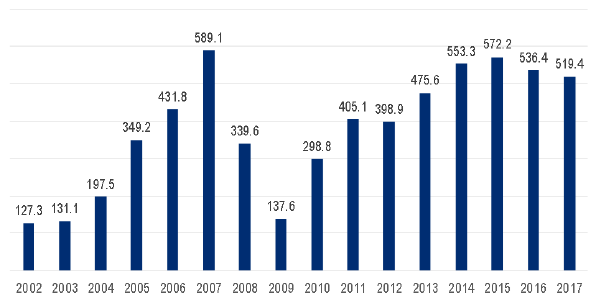
Even if the buyback trend looks to mature in the US (the trend has regressed for two years in terms of marginal increases in buybacks), the US dollar value of share buybacks on the S&P 500 is reaching worrying levels, with USD 4.2 trillion since 2008. US companies spent almost USD 520 billion in 2017 and USD 151 billion in 2018 to date.
The rebound and stability of the US market has benefited from some mega-capitalisation stock-buying programmes: companies are artificially reducing the number of shares outstanding, increasing earnings-per-share data, and reducing the volatility of earnings and stock prices.
Chart 7: Volume of S&P 500 share buybacks in USD billion per year
As long as the cost of borrowing money remains low enough to not cause a concern for earnings, share buybacks remain a valid strategy for companies.
However, the total number of shares outstanding appears to have remained almost constant since 2005. This is mainly because a small number of companies have done large equity issues, skewing the number of shares in absolute terms.
Chart 8: Total number of shares outstanding since 1996
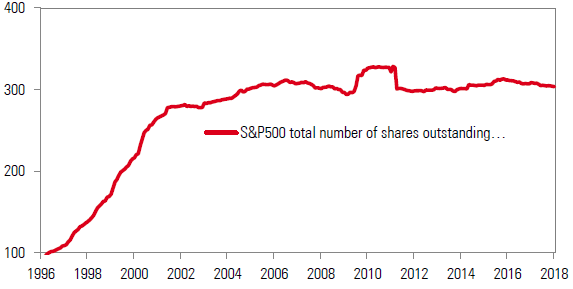
As long as the cost of borrowing money remains low enough to not cause a concern for earnings, share buybacks remain a valid strategy for companies. This could enable US markets to continue to rise even with a gradual increase in volatility.
A bear market is on the horizon
However, we believe that investors should prepare for the likelihood of future corrections; the one witnessed at the beginning of February is likely to be the first of many in this short volatility crisis. In our view, interest rates are likely to reach a level that will make company debt a serious concern. Even if buyback programs are mostly funded with cash and recently with tax reforms, the percentage of buybacks funded with debt is close to 30% (an all-time high since the dot.com bubble).
Another effect of these shareholder-friendly policies could be a significant reduction in liquidity due to reduced free float shares and trading volume. This in turn could have a serious impact on passive strategies or ETFs in the case of a market correction. We believe that now is the time to consider taking an active, defensive approach.
Defensive allocation should be done at a reasonable leverage…
The recent, sudden moves in interest rates and inflation surprised financial markets and led to one of the largest corrections in the past few months. The potential for further rate moves, following years of quantitative easing and very low rates, could potentially harm margins and be particularly challenging for defensive sectors.
While defensive stocks are usually highly leveraged stocks, they made leverage a concern for investors, and with the market pricing in multiple rate rises in 2018, we recommend that investors should look for quality.
Margin debt is at all-time highs and far above the real growth of the stock market. In our view, it is a clear indicator of a highly leveraged market which, coupled with high valuations, is of great concern.
…but quality should be at a reasonable price too.
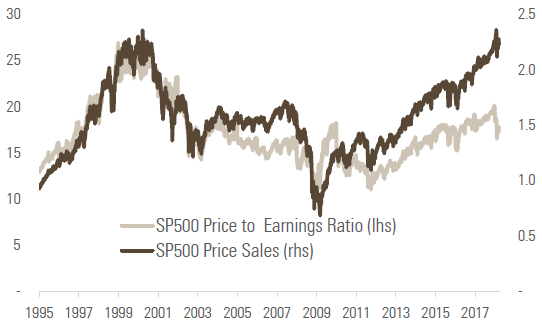
After months of performance driven by multiple expansion, we believe the US market is extremely expensive and the positive outlook for wages and inflation is already priced in. Even though P/E multiples are generally driven by the outlook for earnings growth, earnings growth has been a source of disappointment in the US over the past five years and has also been boosted artificially, as previously mentioned, through share buybacks. Moreover, the US market is currently at the peak of its profit margin cycle. Falling margins could reveal an even more expensive market. Using a price-to-sales ratio, which is not influenced by share buybacks, also supports this view (see Chart 9).
Margin debt is at all-time highs and far above the real growth of the stock market. In our view, it is a clear indicator of a highly leveraged market which, coupled with high valuations, is of great concern.
Chart 9: US market remains extremely expensive
Conclusion
In our view, a rising volatility environment is coming. Short carry trades that were pushing down volatility are going to be reduced. Therefore, we believe that investors should take a cautious approach, keeping a careful eye on valuations with the rising volatility environment.
Any investor who is concerned about a potential market correction will be looking to minimise risk. However, in a rising rate environment, we believe defensive sectors are likely to be challenged. Quality is going to be difficult to find. Companies with strong balance sheets as well as attractive valuations could be the last ones able to withstand the storm of rising bond yields.
Unigestion, through its risk-managed products, is seeking to minimise risks by dynamically controlling the valuation of the portfolio. We also seek to control our exposure to interest rates through a combination of quantitative processes and qualitative analysis, in order to deliver solutions to suit all types of risk environments. Protecting capital is key in challenging markets, especially after a long period of positive performance.
Important information
Past performance is no guide to the future, the value of investments can fall as well as rise, there is no guarantee that your initial investment will be returned. This document has been prepared for your information only and must not be distributed, published, reproduced or disclosed by recipients to any other person.
Please contact your professional adviser/consultant before making an investment decision. Where possible we aim to disclose the material risks pertinent to this document, and as such these should be noted on the individual document pages. A complete list of all the applicable risks can be found in the Fund prospectus. Some of the investment strategies described or alluded to herein may be construed as high risk and not readily realisable investments, which may experience substantial and sudden losses including total loss of investment.
These are not suitable for all types of investors. To the extent that this report contains statements about the future, such statements are forward-looking and subject to a number of risks and uncertainties, including, but not limited to, the impact of competitive products, market acceptance risks and other risks. As such, forward looking statements should not be relied upon for future returns. Data and graphical information herein are for information only and may have been derived from third party sources. Unigestion takes reasonable steps to verify, but does not guarantee, the accuracy and completeness of this information. As a result, no representation or warranty, expressed or implied, is or will be made by Unigestion in this respect and no responsibility or liability is or will be accepted. All information provided here is subject to change without notice.
It should only be considered current as of the date of publication without regard to the date on which you may access the information. Rates of exchange may cause the value of investments to go up or down. An investment with Unigestion, like all investments, contains risks, including total loss for the investor.
Authorised and regulated by the UK Financial Conduct Authority. Unigestion SA authorised and regulated by the Swiss FINMA. Unigestion Asset Management (France) S.A. authorised and regulated by the French Autorité des Marchés Financiers. Unigestion Asia Pte Limited autorised and regulated by the Monetary Authority of Singapore.