Most risk premia ended the first half of the year at record highs. Equities posted one of their best six-month performances in history, credit spreads are back to pre-crisis lows and sovereign bond indices delivered “equity-like” returns thanks to a large decline in bond yields. These exceptional performances illustrate the amplitude of the “beta party” observed over the first six months of the year, but investors are now questioning its sustainability and asking to what extent we are back to a “goldilocks” scenario. Despite similar performance in asset returns, we believe that the current macroeconomic and financial backdrop is different from 2017. Over the first six months of the year, global equities returned 17% in total return terms, with a large dispersion across countries and sectors. US equities gained 19.6% while Japanese stocks lagged with a single digit performance (+7.55). MSCI World IT Services posted an astonishing 32.7% return over the period but MSCI World Auto, only 6.8%. Credit spreads followed equity returns with a 10% performance for the Barclays US High Yield and Barclays Emerging USD Aggregate indices. Even commodities posted double-digit returns with a 22% jump in oil price while gold increased by 10%. To put these performances into perspective, returns in 2017 were similar for growth-oriented assets but it was for the full year, not just six months. The famous “goldilocks” conditions, characterised by above-potential global growth without inflation pressures, were supportive for most assets. That lack of inflation prevented any tightening of financial conditions, as illustrated by the stability of the US 10-year bond yield at around 2.4%, despite US Fed normalisation.“ALL THE WAY UP” – FAT JOE AND REMY MA, 2017
What’s Next?
Same returns but different triggers
In short, growth-oriented assets in 2017 benefited from the positive effects of economic expansion without the downsides (i.e. rising interest rates). Today is different. Firstly, the economic landscape looks less rosy with most countries exhibiting declining and below-potential growth. To illustrate, the average level of our global Growth Nowcaster, which aims to track the global economy in real time, has been 0.02 over the first 6 months of 2019 vs +0.4 in 2017. Secondly, 2017 asset returns followed a positive year for growth-oriented assets while 2019 returns comes after one of the worst yearly performances for equities outside of a recession period. Changes in valuation and sentiment were all key drivers of the rally observed in 2019. However, monetary policy was the principal driver of the amazing first part of the year.
This year, contrary to the “goldilocks” scenario, the increasingly dovish stance of central banks have been the main price driver. The change in monetary expectations has been massive.
In November 2018, the Fed Fund futures priced Fed rates at 2.9% for December 2020. By the end of June 2019, it had fallen to 1.3%, 100bp below the current rate. This is the reason why, for us, 2017 is not the reference for describing the current backdrop. We prefer the end of 2010 when the Fed emphasised that they were “prepared to provide additional accommodation if needed to support the economic recovery and to return inflation, over time, to levels consistent with its mandate.”, or 2015 when the ECB and BOJ increased their balance sheets significantly. We have analysed equity performance following Fed QE-related announcements between 2008 and 2012 when the stance of the US central bank was accommodative. There have been 8 specific measures as reported here: https://tinyurl.com/yyshcny7. On average, the six-month performance following these communications has been very positive for growth-oriented assets with an average S&P 500 performance of 15%, very similar to the first 6 months of 2019.
How sustainable is the current trend? In our view, the risks are around monetary policy and a potential repricing, not necessarily about macroeconomic momentum. Recently, the Fed has justified its U-turn on 1) trade war risks and 2) lower inflation than targeted. In June, it did not change its GDP forecast, highlighting greater concerns around corporate confidence and market sentiment than on US economy fundamentals. If the trade war situation stabilised, the need for easing would be challenged. In our view, this scenario is more likely and constitutes the risk scenario rather than a new acceleration in global growth pushing inflation risk higher. In May 2013, during the Q&A for his testimony before the Joint Economic Committee to Congress, Chairman Bernanke said that the FOMC “could in the next few meetings, take a step down in [its] pace of purchases” if its members saw continued improvement. This kind of communication pushed most assets down, generating one of largest correlation shocks in history. We do not expect a repetition of this pattern later in this year. However, given current monetary policy pricing, aggressively high leverage levels driven by the new “search for yield” and the duration risk embedded directly or indirectly in most portfolios, any monetary policy surprise would markedly affect future asset performance.Where are the risks?

How to deal with this situation? We think risk is multidimensional. In our dynamic asset allocation framework, we have identified three key factors that drive asset returns over the medium term: macro risks, market sentiment and valuation. Monitoring this spectrum of risk factors on a regular basis allows for dynamic risk allocation in order to smooth the returns of our strategy. Currently, neither the macro element nor valuations are calling for a reversal of our beta overweight. Sentiment is more balanced while positioning is not extreme; momentum is supportive but pricing is a bit too complacent. The situation can change dramatically and quickly, and we need to stay flexible and be ready to take profits in order to limit downside participation.Be prepared to take profit

All the Way up

Our medium-term views remain cautious. We remain underweight in government bonds and overweight in developed market equities and high yield corporate credit. We are also complementing our equity exposure with options to protect the portfolio in the case of equity drawdowns. Last week, the Multi Asset Risk Targeted Strategy gained 1.2% versus 1.2% for the MSCI AC World index and 0.2% for the Barclays Global Aggregate (USD hedged). Year-to-date, the Multi Asset Risk Targeted Strategy has returned 8.4% versus 17.2% for the MSCI AC World index, while the Barclays Global Aggregate (USD hedged) index is up 6.2%. * The Multi Asset Risk Targeted Strategy performance is shown in USD net of fees for the representative account of the Multi Asset Risk Targeted (Medium) USD Composite and reflects the deduction of advisory fees and brokerage commission and the reinvestment of all dividends and earnings. Past performance is not indicative of future performance. This information is presented as supplemental information only and complements the GIPS compliant presentation provided on the following page.Strategy Behaviour
Performance Review
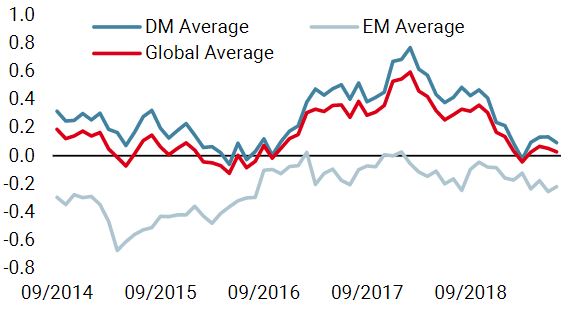
Unigestion Nowcasting
World Growth Nowcaster
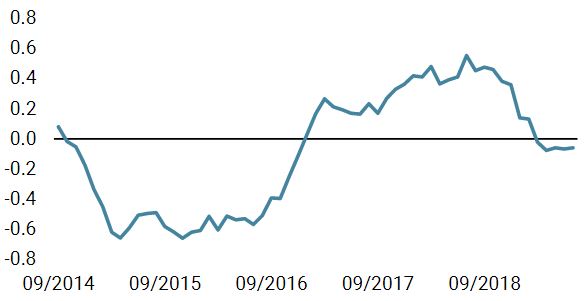
World Inflation Nowcaster
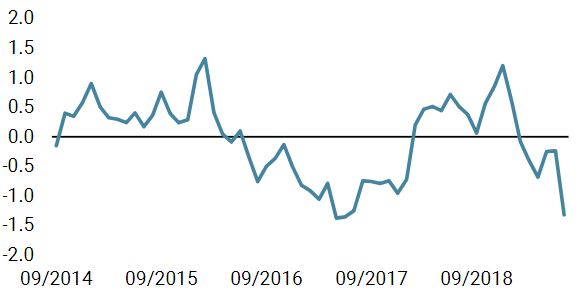
Market Stress Nowcaster
Weekly Change
- Our world Growth Nowcaster remained unchanged this week, still pointing towards growth slightly above potential.
- Our world Inflation Nowcaster also remained unchanged.
- Market stress is currently in low territories.
Sources: Unigestion. Bloomberg, as of 8 July 2019.
Past performance is no guide to the future, the value of investments can fall as well as rise, there is no guarantee that your initial investment will be returned. This document has been prepared for your information only and must not be distributed, published, reproduced or disclosed by recipients to any other person. This is a promotional statement of our investment philosophy and services only in relation to the subject matter of this presentation. It constitutes neither investment advice nor recommendation. This document represents no offer, solicitation or suggestion of suitability to subscribe in the investment vehicles it refers to. Please contact your professional adviser/consultant before making an investment decision. Where possible we aim to disclose the material risks pertinent to this document, and as such these should be noted on the individual document pages. Please contact Unigestion for a complete list of all the applicable risks. Some of the investment strategies described or alluded to herein may be construed as high risk and not readily realisable investments, which may experience substantial and sudden losses including total loss of investment. These are not suitable for all types of investors. To the extent that this report contains statements about the future, such statements are forward-looking and subject to a number of risks and uncertainties, including, but not limited to, the impact of competitive products, market acceptance risks and other risks. As such, forward looking statements should not be relied upon for future returns. Data and graphical information herein are for information only and may have been derived from third party sources. Unigestion takes reasonable steps to verify, but does not guarantee, the accuracy and completeness of this information. As a result, no representation or warranty, expressed or implied, is or will be made by Unigestion in this respect and no responsibility or liability is or will be accepted. All information provided here is subject to change without notice. It should only be considered current as of the date of publication without regard to the date on which you may access the information. Rates of exchange may cause the value of investments to go up or down. An investment with Unigestion, like all investments, contains risks, including total loss for the investor. This information is issued by Unigestion (UK) Ltd (“Unigestion”), which is authorised and regulated by the UK Financial Conduct Authority (“FCA”). Unigestion is also registered as an investment adviser with the U.S. Securities and Exchange Commission (“SEC”). This information is intended only for professional clients, institutional clients and eligible counterparties, as defined by the FCA, and qualified purchasers as defined by the SEC and has therefore not been adapted to retail clients. Unigestion Multi Asset Risk-Targeted (USD): 31 December 2014 to 31 December 2018 1: This year is incomplete. Special Disclosure: For presentations prior to 31.03.2018 the strategy was measured against the LIBOR 3M USD + 4%. Beginning April 2018 the firm determined that the benchmark did not accurately reflect the strategy mandate and the benchmark was removed. Definition of the Firm: For the purposes of applying the GIPS Standards, the firm is defined as Unigestion. Unigestion is responsible for managing assets on the behalf of institutional investors. Unigestion invests in several strategies for institutional clients: Equities, Hedge Funds, Private Assets and the solutions designed for the clients of our Cross Asset Solution department. The GIPS firm definition excludes the Fixed Income Strategy Funds, which started in January 2001 and closed in April 2008, and the accounts managed for private clients. Unigestion defines the private clients as High Net Worth Families and Individual investors. Policies: Unigestion policies for valuing portfolios, calculating performance, and preparing compliant presentations are available upon request. Composite Description: The Multi Risk Targeted (Medium) composite was defined on 15 December 2014. It consists of accounts which aim to deliver consistent smooth returns of cash + 5% gross of fees across all market conditions over a 3-year rolling period. It seeks to achieve this by capturing the upside during bull markets while protecting capital during market downturns. Benchmark: Because the composites strategy is absolute return and investments are permitted in all asset classes, no benchmark can reflect this strategy accurately. Fees: Returns are presented gross of management fees, administrative fees but net of all trading costs and withholding taxes. The maximum management fee schedule is 1.2% per annum. Net returns are net of model fees and are derived by deducting the highest applicable fee rate in effect for the respective time period from the gross returns each month. List of Composites: A list of all composite descriptions is available upon request. Minimum Account Size: The minimum account size for this composite is 5’000’000.- USD. Valuation: Valuations are computed in US dollars (USD). Performance results are reported in US dollars (USD). Internal Dispersion & 3YR Standard Deviation: The annual composite dispersion presented is an asset-weighted standard deviation calculated for the accounts in the composite the entire year. When internal dispersion is not presented it is as a result of an insufficient number of portfolios in the composite for the entire year. When the 3 Year Standard Deviation is not presented it is as a result of an insufficient period of time. Compliance Statement Unigestion claims compliance with the Global Investment Performance Standards(GIPS®) and has prepared and presented this report in compliance with the GIPS standards. Unigestion has been independently verified for the periods 1 January 2003 to 31 December 2016. The verification report(s) is/are available upon request. Verification assesses whether (1) the firm has complied with all the composite construction requirements of the GIPS standards on a firm-wide basis and(2) the firms policies and procedures are designed to calculate and present performance in compliance with the GIPS standards. Verification does not ensure the accuracy of any specific composite presentation.
Important Information
Year
Composite
Return Gross
of FeesComposite Net Return
Benchmark Return
Number of Accounts
Internal Dispersion
Composite 3-Yr Std Dev
Benchmark 3-Yr Std Dev
Composite AUM (M)
Firm
AUM (M)
2015
-1.61%
-2.80%
–
1
–
–
–
127.24
15,550.31
2016
5.05%
3.79%
–
1
–
–
–
129.66
18,144.46
2017
11.16%
9.82%
–
1
–
–
–
169.51
22,340.80
2018
-2.91%
-4.08%
–
1
–
–
–
286.93
21,403.49
20191
5.06%
4.74%
–
1
–
–
–
278.23
23,204.71