An Introduction To Unigestion’s Macro Nowcasters Real-Time Tracking Of The Economy
Most of the crucial information needed to assess economic conditions comes with too great a lag to make opportune investment decisions. Key growth and inflation data are often published at least a month after the fact and can be subject to revisions, adding further delay. Sometimes a year can pass before a recession is officially declared. Nowcasting aims to solve this problem by gathering suitable and timely data sets to build near real-time indicators, an approach used by economists at the US Federal Reserve and European Central Bank to track GDP growth in their respective economies. Unigestion’s proprietary Nowcasters not only gauge growth but also inflation and extend far beyond the US and Eurozone, covering more than 80% of the world’s GDP. This note is a brief guide to the nowcasting indicators employed by Unigestion for managing investment portfolios. It reviews their value, construction, and efficacy and highlights a few real-world examples.
Motivation
The connection between economic and market cycles has long been established in academic literature, as well as in practice by macro investment managers. This connection holds for a wide spectrum of traditional asset classes and even alternative risk premia1. However, economic conditions are easily assessed only after they have transpired, by which point they no longer hold much sway over markets. As Figure 1 shows, financial markets can experience significant volatility when market regimes shift, as investors adjust their expectations of the future in light of current conditions. Nonetheless, assessing current conditions still suffers from reporting lag: even the timeliest print of quarterly GDP growth happens a month after the quarter in question has passed. Specific events such as recessions, which are highly informative and relevant for investment decisions, may experience even further reporting delay: for instance, the end of the 2020 recession was dated as of April 2020 by the National Bureau of Economic Research (NBER) but was published in July 2021, i.e. more than a year after the recession was over.
Figure 1: S&P 500 Index (log) vs US Recessions
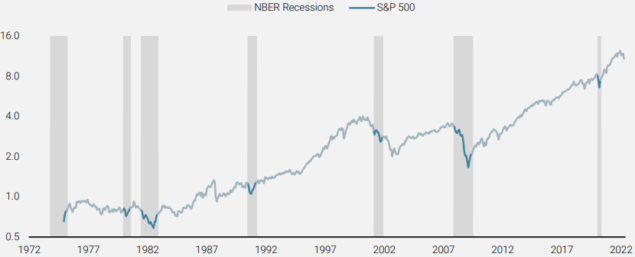
Source: Bloomberg, Unigestion, as of 01 May 2022.
Nowcasting – a portmanteau of “now” and “forecasting” – is a technique well-suited to meet this challenge. Originally developed for weather modelling, it has been adapted to macroeconomics, benefiting from its ability to synthesise a broad set of information and to provide a definite horizon for its results (or “nowcast”). Unlike other existing nowcasters, such as the Atlanta Fed’s GDPNow2 or the NY Fed’s Nowcast3, which typically only look at growth conditions in a single economy, we have expanded our nowcasting indicators in two directions. First, our proprietary Nowcasters focus on inflation as well as growth. Second, our nowcasters assess conditions in a large set of economies, covering more than 80% of the world’s GDP and thus reflecting the global nature of investment. This note provides an overview of their construction, accuracy, and recent evolution to aid the reader in understanding how they are incorporated into our macro risk-based investment framework
Building Nowcasters
Growth and inflation are fundamental in making dynamic investment decisions since any financial asset is a claim on future cash flows discounted to today. Growth conditions directly impact the expectations of those cash flows, while inflation is a key driver to valuing money in the future today. But, as stated above, it is important to get access to this economic information in quasi-real time to take effective allocation decisions. This is exactly what Nowcasters are trying to achieve.
In academic literature, the approach to building nowcasters often involves estimating complex econometric models (see Giannone et al., 2008; Bok et al., 2017) that might be subject to robustness issues out-of-sample. We adopt a simple model-free approach, which limits the influence of parameter estimation uncertainty. We first identify subcomponents for both growth and inflation. These components are presented in Table 1 below and are based on our experience as macroeconomists and investors. For example, the Growth Nowcaster essentially captures the household and business sector and the credit conditions they face. It excludes government spending, as that is primarily a counter-cyclical component to growth, as opposed to the pro-cyclical forces we are aiming to capture and assess.
Table 1: Underlying Components for Each Macro Nowcaster
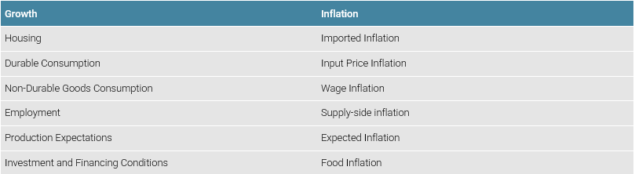
Source: Unigestion, as of 01 May 2022.
For each economy in our universe, encompassing both the developed and emerging world, we then identify a collection of data series for each component. For example, we may consider the private housing building permits for the US housing component and newly built residential buildings in third tier cities for the Chinese housing component. A large collection of such series is then quantitatively assessed for sufficient and, importantly, stable correlation to the broader economic concept. Nearly 1300 data series pass this filtering process, and each of them is then z-scored and cross-sectionally averaged with the other data series for that economy’s underlying component. Importantly, the data series are not smoothed from a time series perspective, which would erode their timeliness. We rather reduce noise in our Nowcasters via the cross-sectional average, which weights each series equally, not favoring one over the others. The components are then aggregated using an equal-weighted average: we do not attempt to know where the next shock will come from, nor do we wish to be biased toward the data in our historical sample. As such, we do not try to optimise the weights or favour one component over another. This methodology hence produces a separate growth and inflation Nowcaster for each economy, which can then be aggregated to form developed world, emerging markets, or global Nowcasters.
A key benefit of this approach, especially over techniques such as principle components analysis or more complex models, is a clear line-of-sight from raw input data series to the final indicator: if the indicator changes, we can reconcile completely to the underlying data that have changed. It also allows for the attribution of these concepts by both economy and by sectors, all through time. Figure 2 shows a breakdown of our total Global Growth Nowcaster into individual country’s underlying components. This degree of transparency allows for a deeper understanding of each of the key macro forces and how they vary across economies and time. It is worth mentioning that our Nowcasters are presented as normalised metrics, hence a value of 0 for Eurozone growth, for instance, indicates that it is growing at its long-term potential, not that the economy is stagnant.
Figure 2: Growth Nowcaster by Economy and Component
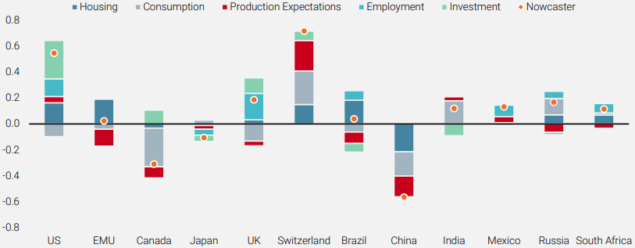
For illustrative purposes only. Source: Bloomberg, Unigestion, as of 08 April 2022.
Assessing The Accuracy Of The Nowcasters
Our macro Nowcasters have clearly defined goals: Assess the risk of a recession and the potential for an inflationary surprise. Whereas official GDP growth figures are released on a quarterly basis, with significant publication lags and possible subsequent revisions, our Nowcasters are updated daily, incorporating any underlying data release on a daily basis. Figure 3 below shows the historical evolution of our Global Growth Nowcaster alongside composite global GDP growth. The 2001, 2008, and 2020 recessions are clearly identified by our Nowcaster. Importantly, these conditions were detected in real-time. Hence, for example, our Global Growth Nowcaster signalled the 2020 recession at the end of March 2020, whereas the NBER took until July 2021 to make the call. Overall, during the period between March 2001 and March 2022, our Global Growth Nowcaster has exhibited a 70% correlation to global GDP growth.
Figure 3: Global Growth Nowcaster vs Global GDP Growth
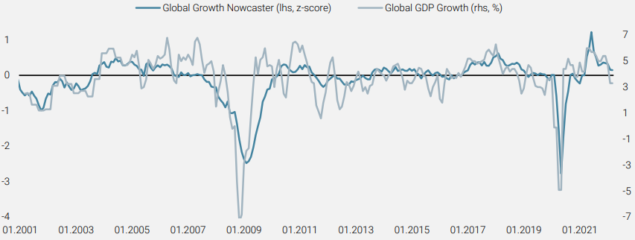
Source: Unigestion, Bloomberg (World GDP: Bloomberg Economics Global GDP Tracker). 01.2001 – 03.2022
Defining an objective measure of global inflationary surprises is more challenging than global recessions, but a reasonable proxy is the smoothed 1-year change in inflation: inflationary shocks occur when inflation is rapidly changing. Figure 4 below charts this proxy against our Global Inflation Nowcaster. As in the case of growth, our Inflation Nowcaster is updated daily in real-time, whereas most economies report inflation numbers on a monthly basis (and some on a quarterly basis) with a publication lag. From March 1986 to March 2022, our Global Inflation Nowcaster has been 64% correlated to global inflation surprises.
Figure 4: Global Inflation Nowcaster vs Global Inflation Surprises
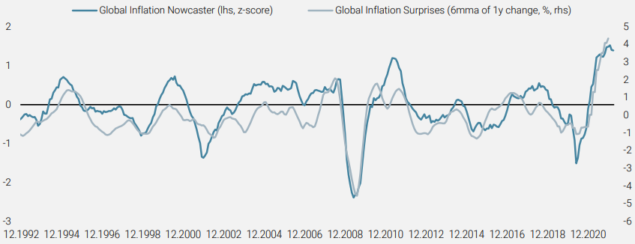
Source: Unigestion, Bloomberg. World inflation surprises is measured by the OECD CPI index. As of 30 March 2022.
In addition to considering the economic concepts our Nowcasters are targeting, we can also compare them to other existing nowcasting indicators. The US Federal Reserve has developed a few different nowcasters for the US economy, including the Atlanta Fed’s GDPNow indicator and the NY Fed’s GDP Nowcast4. Figure 5 charts these against our US Growth Nowcaster since our indicator went live on a daily basis in July 2015. Given the tremendous swings in economic activity during 2020, we also look at the period from July 2015 to end of 2019 on a separate chart to better elucidate the dynamics. Over the full period, our US Growth Nowcaster shows a 60-70% daily correlation with the Fed’s Nowcasters, consistent with the 60% correlation to the official US GDP growth figures (on a quarterly basis). It also exhibits less volatile swings, especially when compared to the Atlanta Fed’s GDPNow indicator. All in all, the simpler methodology of our Nowcaster is able to capture similar information and dynamics, while also benefiting from timely publication5 and a global perspective.
Figure 5: The US Case: Unigestion US Growth Nowcaster vs Fed Nowcasters (full period on left, 2015-2019 on right)
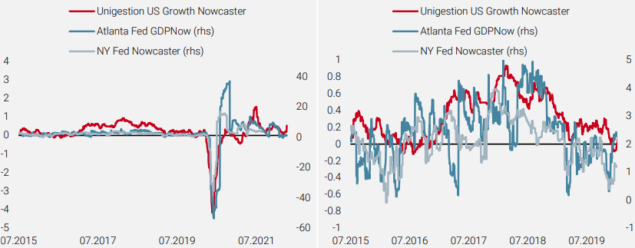
Source: Unigestion, Bloomberg. July 2015 – April 2022.
Since nowcaster sources are not available for many other economies, we cannot make the same comparison as in Figure 5 to a broader spectrum of countries. However, we can still assess our nowcaster against business conditions indicators as another point of comparison (similar to Figure 3). Figure 6 below shows that across major countries, our country-level Growth Nowcasters show an improved correlation to each country’s GDP growth when compared to standard business conditions indicators6. That is a key benefit of taking a broader perspective than any one specific indicator.
Figure 6: Correlation of Local GDP Growth to Growth Nowcasters vs. Standard Business Conditions Indicators
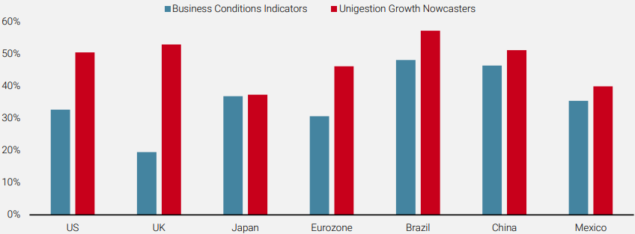
Source: Unigestion, Bloomberg. Period: January 2000 – March 2022.
Case Study: Inflation Following The Covid-19 Shock
The COVID-19 pandemic, mandated lockdowns, and subsequent stimulus measures provided the perfect storm for a resurgence in inflation. A decade of under investment, especially in the energy sector as the world shifted focus to renewables, left supply fragile. The US-China trade war had already exacerbated supply chain issues, especially for semiconductors, and at the same time it raised tariffs on many goods. Once the pandemic hit and economies shut down around the world, demand for many goods and services collapsed, causing inflationary pressures to follow suit (let us not forget the May 2020 WTI futures contract trading below zero in late April 2020). However, fiscal and monetary authorities then unleashed one of the largest stimuli in history, including direct payments to households, grants and loans for companies, rate cuts, and massive asset purchases. The pent-up demand from months in lockdown encountered massively disrupted supply chains toward the end of 2020 and caused inflationary pressures to recover strongly from their lows. As Figure 8 shows, our Global Inflation Nowcaster turned sharply higher and flashed a very high risk of an inflation shock by the first quarter of 2021. This trend accelerated over the second quarter of 2021 and has largely continued, albeit at a more moderate pace.
Figure 8: Global Inflation Nowcaster
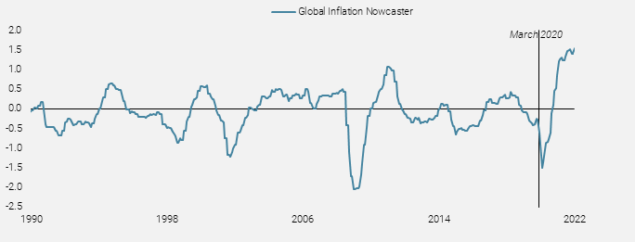
Source: Bloomberg, Unigestion, as of 08 April 2022.
Dissecting the components of our Inflation Nowcaster at a few key points paints a compelling picture of the resurgence of inflation. Figure 9 looks at the total global indicator and its underlying components at its nadir (May 2020), its recovery to a neutral level (end of 2020), and near its peak (end of 2021). For May 2020, we see that wage inflation, supply-side inflation, and expected inflation were the drivers of the initial plunge. Nearly all components had recovered to around neutral levels by the end of 2020, though expected inflation remain subdued. However, by the end of 2021, inflation expectations had moved significantly higher and were second only to higher input prices as the key drivers of inflation. Importantly, while wage inflation is well-above its neutral level, it still lags the levels reached by the other components. This component could be a source of further support if employees demand higher wages in light of the inflation figures recently seen, as real wages in the US and the Eurozone have both been negative for nearly a year.
Figure 9: Recent Readings of Global Inflation Nowcaster and Its Components
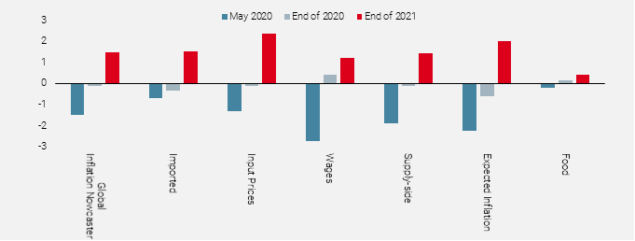
Source: Bloomberg, Unigestion, as of 01 April 2022.
At the start of 2021, we had made clear that our core scenario for the year was the comeback of inflation, that central bankers were too dismissive with their “transitory” diatribe, and that investors were under-allocated to inflation-sensitive assets. One of the primary justifications for this call was what our Inflation Nowcaster was saying at the global level, as well as via its underlying components. Thus our highest conviction exposures over the year were allocations to real assets (inflation breakevens and commodities).
Conclusion
Unigestion has developed a set of nowcasting indicators in order to monitor the two key macro forces that investors contend with: growth and inflation. Inspired by the academic work on this methodology, we have further developed it to incorporate a large share of the global economy and constructed it in a way that enriches understanding of these forces and informs decision-making. This richer signal has shown improved accuracy compared to other indicators and has played a crucial role in systematically generating returns for our investment portfolios. The recent return of inflation since early 2021 has been another real-world testimony of its ability to timely assess and respond to shifts in macro regimes. In short, our Nowcasters offer a coherent view of the economic “now”, rather than trying to rationalise the past or predict the future, in order to take asset allocation decisions today.
1See, among many others, Ang and Bekaert (2004), Ilmanen et al. (2014), Cooper et al. (2020), Scherer and Apel (2020), or Blin et al. (2021).
2See https://www.frbatlanta.org/cqer/research/gdpnow.aspx
3See https://www.newyorkfed.org/research/policy/nowcast
4Note this has been discontinued since August 2021 until further notice.
5The Atlanta Fed currently updates the GDPNow indicator weekly.
6We have used business conditions indicators often used by investors to track economic activity and local growth: the US manufacturing ISM; the European Commission Euro Area and UK Business Climate Indicators; the Japanese Tankan survey; the CNI Industrial Confidence General indicator for Brazil, the Chinese Manufacturing PMI and the Mexican Manufacturing index.
References
Ang, A., and Bekaert G. (2004). How Regimes Affect Asset Allocation. Financial Analysts Journal, 60, 86-99.
Beber, A., Brandt, M. W., & Luisi, M. (2015). Distilling the macroeconomic news flow. Journal of Financial Economics, 117(3), 489–507.
Bok B., Caratelli D., Giannone D., Sbordone A., Tambalotti A. (2017), “Macroeconomic Nowcasting and Forecasting with Big Data”, Federal Reserve Bank of New York, Working Paper 18-04.
Blin, Olivier and Ielpo, Florian and Lee, Joan and Teiletche, Jerome (2021). Alternative Risk Premia Timig: A Point-in-Time Macro, Sentiment Valuation Analysis. Journal of Systematic Investing. V(I), 1- 19.
Cooper I., Mitrache A., and R. Priestley (2020), “A Global Macroeconomic Risk Explanation for Momentum and Value”, Journal of Financial and Quantitative Analysis, 57(1), 1-30.
Ferrara, L. & Marsilli, C. 2014. Nowcasting global economic growth: a factor augmented mixed-frequency approach. Bank of France Working Papers No 515.
Giannone, D., Reichlin, L., & Small, D. (2008). Nowcasting: The real-time informational content of macroeconomic data. Journal of Monetary Economics, 55(4), 665–676.
Giannone, D., Reichlin, L., & Simonelli, S. (2009). Nowcasting euro area economic activity in real time: the role of confidence indicators. National Institute Economic Review, 210(1), 90–97.
Higgins, P. C. (2014). GDPNow: A Model for GDP Nowcasting. Atlanta Fed Working Paper 2014–7.
Ilmanen A., Maloney T., and A. Ross (2014), “Exploring Macroeconomic Sensitivities: How Investments Respond to Different Economic Environments”, Journal of Portfolio Management 40, 87-99.
Mitchell, J. (2009). Where are we now? The UK recession and nowcasting GDP growth using statistical models. National Institute Economic Review, (209), 60–69.
Rossiter, J. (2010). Nowcasting the global economy. Bank of Canada Discussion Paper, (2010–12).
Scherer B., and M. Apel (2020). “Business Cycle–Related Timing of Alternative Risk Premia Strategies”, Journal of Alternative Investments 22, 8-24.
Stock, J. H., & Watson, M. W. (2002). Macroeconomic forecasting using diffusion indexes. Journal of Business & Economic Statistics, 20(2), 147–162.
Contact Information
If you are an institutional investor: clients@unigestion.com
If you are a consultant: consultants@unigestion.com
If you are a journalist/press agency: pressrelations@unigestion.com
Disclaimer
This document is provided to you on a confidential basis and must not be distributed, published, reproduced or disclosed, in whole or part, to any other person.
The information and data presented in this document may discuss general market activity or industry trends but is not intended to be relied upon as a forecast, research or investment advice. It is not a financial promotion and represents no offer, solicitation or recommendation of any kind, to invest in the strategies or in the investment vehicles it refers to. Some of the investment strategies described or alluded to herein may be construed as high risk and not readily realisable investments, which may experience substantial and sudden losses including total loss of investment.
All information provided here is subject to change without notice. It should only be considered current as of the date of publication without regard to the date on which you may access the information. All investors must obtain and carefully read the prospectus which contains additional information needed to evaluate the potential investment and provides important disclosures regarding risks, fees and expenses.
The investment views, economic and market opinions or analysis expressed in this document present Unigestion’s judgement as at the date of publication without regard to the date on which you may access the information. There is no guarantee that these views and opinions expressed will be correct nor do they purport to be a complete description of the securities, markets and developments referred to in it. All information provided here is subject to change without notice. To the extent that this report contains statements about the future, such statements are forward-looking and subject to a number of risks and uncertainties, including, but not limited to, the impact of competitive products, market acceptance risks and other risks.
Data and graphical information herein are for information only and may have been derived from third party sources. Although we believe that the information obtained from public and third party sources to be reliable, we have not independently verified it and we therefore cannot guarantee its accuracy or completeness. As a result, no representation or warranty, expressed or implied, is or will be made by Unigestion in this respect and no responsibility or liability is or will be accepted. Unless otherwise stated, source is Unigestion. Past performance is not a guide to future performance. All investments contain risks, including total loss for the investor.
Unigestion SA is authorised and regulated by the Swiss Financial Market Supervisory Authority (FINMA). Unigestion (UK) Ltd. is authorised and regulated by the UK Financial Conduct Authority (FCA) and is registered with the Securities and Exchange Commission (SEC). Unigestion Asset Management (France) S.A. is authorised and regulated by the French “Autorité des Marchés Financiers” (AMF). Unigestion Asset Management (Canada) Inc., with offices in Toronto and Montreal, is registered as a portfolio manager and/or exempt market dealer in nine provinces across Canada and also as an investment fund manager in Ontario, Quebec and Newfoundland & Labrador. Its principal regulator is the Ontario Securities Commission. Unigestion Asset Management (Düsseldorf) SA is co-regulated by the “Autorité des Marchés Financiers” (AMF) and the “Bundesanstalt für Finanzdienstleistungsaufsicht” (BAFIN).
Document published in June 2022.