Correlation Shock? Not All Hedges are Created Equal
January has been very volatile so far, with most equity indices falling by double digits and off to the worst start of the year since 2016. Investors’ sentiment has rapidly shifted from very optimistic at the end of 2021 to very pessimistic in a matter of weeks. Numerous reasons could be behind this sudden change in mood, from Omicron to geopolitical tensions between Russia and Ukraine or inflation fears. Nonetheless, the main driver has obviously been increasingly hawkish central banks, especially the Fed, which set off a correlation shock affecting most risk premia, via a global deleveraging. In this context, not all safe heavens behaved the same. We will explore which hedging strategies worked and which ones did not, the reasons why, and how to position oneself for the weeks to come.

Protection

What Happened?
From QE to reverse QE
If one agrees that there has been a perfect correlation between central banks’ support/accommodation and the trajectory of asset performance in the past, it would be fair to deduce that removing such accommodation (or the anticipation of it) has been the trigger of the current correlation shock. Traditionally, markets went through two major regimes: Risk-on (where risk assets thrive and hedges, such as bonds, suffer) or Risk-off (where risk assets suffer and hedges thrive). Since the introduction of quantitative easing in its current (previously labelled “unconventional”) form, two additional regimes have appeared: “Beta parties” (where most assets thrive together with little to no distinction between them) and “correlation shocks” (where most assets re-correlate positively to the downside).
Traditional hedges have not been helpful this time
These different regimes, especially adverse ones, do not have the same implications in terms of returns for diversified strategies, because safe heavens (hedges) behave differently: in some cases, they help cushion exposures to risk assets, in other cases they add to the pain. When allocating capital and assessing potential hedges to protect against negative scenarios, it is therefore crucial to gauge whether the risk – or shock – will trigger a traditional risk-off scenario (growth shocks for example) or a correlation shock (like the one in Q4 2018). Figure 1 illustrates the historical relationships between equity returns on the x-axis and two commonly used hedging assets on the y-axis, government bonds and volatility. It also demonstrates why all hedges are not created equal.
Figure 1: Monthly equity vs hedges performances:
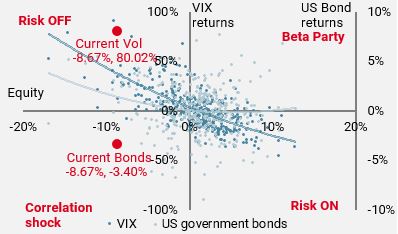
Source: Bloomberg, Unigestion. As of the 26.01.2022
1) The risk-off quadrant holds more data points than the correlation shock quadrant: the first occurred on average 55% of the time since the early 90’s vs 45% of the time, which means that government bonds helped only half of the time when equities fell.
2) Government bonds have an inverse relationship with equities, but mostly to the downside: even with a “hedge hit ratio” of about 50%, their positive performance on average is higher when they “protect” than their negative performance when they do not.
3) Volatility, however, disappointed much less when equities were down: the VIX index reacted positively 82% of the time, and even more so when monthly equity returns were lower than -3%.
4) Finally, the red dots illustrate the current drawdown: it is clear that choosing the right hedge (long volatility) can make a clear difference versus choosing the wrong one (government bonds).
A broader spectrum of hedges in Figure 2 clearly shows that this time around, most usual safe heavens have underperformed.
Figure 2: Monthly historical performance when equites < -5%
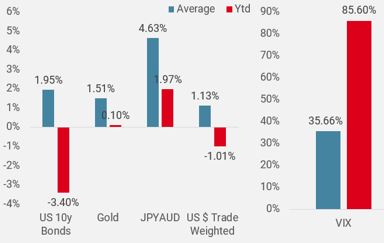
Source: Bloomberg, Unigestion. As of the 26.01.2022
Indeed, there were not many places to hide, apart from cash and long volatility strategies.
Volatility has been the first and virtually only rampart
Within the volatility complex, here again, not all options delivered the same level of protection, as shown in Figure 3.
Figure 3: Volatility indices
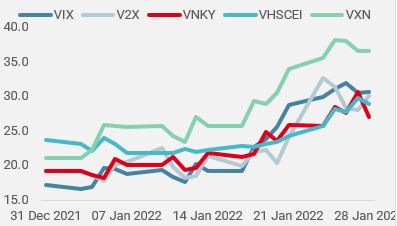
Source: Bloomberg, Unigestion. As of the 26.01.2022
There have been clear divergences between markets, as US volatility indices outperformed, mirroring the underperformance of their underlying stock indices. Volatility curves inverted during the month, shifting from their natural contango form to backwardation. Therefore, depending on the time horizon used to implement optional hedges, the Vega effect (the contribution of the implied volatility component of an option) would have been much more significant for shorter dated maturities than for longer dated ones, as shown in Figure 4.
Figure 4: Vix curves year-to-date changes
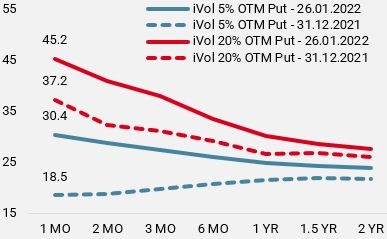
Source: Bloomberg, Unigestion. As of 26.01.2022
Implementation and monetisation also mattered for these types of hedges. Comparing the same strategy of buying a 5%, OTM Put with a one-month maturity, implementing this on the 21st or on the 31st of December and holding to maturity yielded completely different results. Finally, the cost of carry for various strategies varies dramatically from one asset to the other. It is therefore paramount to address each scenario precisely and to choose the best hedge wisely, in order to reach an optimal efficacy/carry ratio. On average, the cost of carry of being long short-dated volatility is 100% per annum, while being long bonds or specific FX crosses offers a positive carry.
Figure 5: Performance of 5%OTM puts
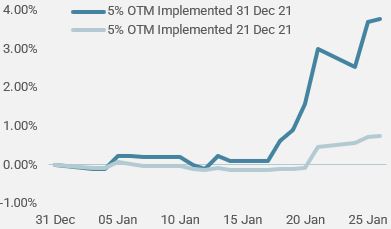
Source: Bloomberg, Unigestion. As of 26.01.2022.
Conclusion
As conveyed in previous publications, we had identified the risk of a central bank “tantrum” as our main adverse scenario for the first half of 2022. The strength and length of the inflation shock had left the major central banks behind the curve in their fight to deliver on the “price stability” part of their mandates, forcing them to act quicker than initially expected. The sharp U-turn in the Fed’s monetary policy over the past few weeks has caused a necessary adjustment of valuations for most assets, triggering a sharp deleveraging in a so-called “correlation shock”.
Anticipating such a risk, we reduced our tactical exposures, favouring a diversified set of defensive strategies, using options as a first responder as well as statistical relative value exposures, (mainly FX), while underweighting government bonds. Looking ahead, we still believe that, despite the solid growth context, markets will trade sideways amid bouts of risk aversion followed by tactical rallies. In this context, we will remain cautious and maintain limited gross market exposures, complemented by volatility strategies and statistical hedges that offer a good compromise between efficacy and cost of carry.
Unigestion Nowcasting
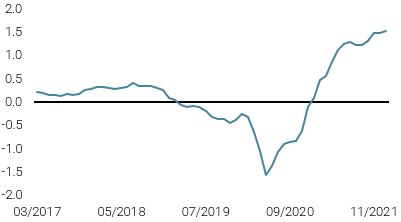
World Growth Nowcaster
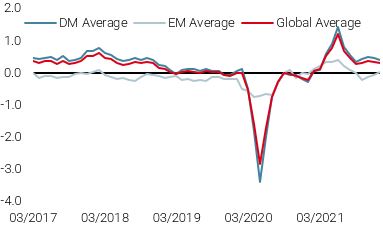
World Inflation Nowcaster
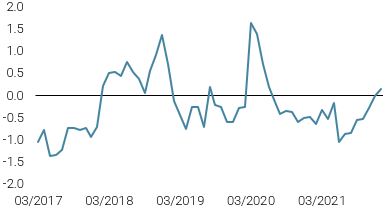
Market Stress Nowcaster
Weekly Change
- Last week, our World Growth Nowcaster moved down slightly, largely due to slower growth momentum in the US.
- Our World Inflation Nowcaster ticked up again, with most countries experiencing higher inflationary pressures.
- Our Market Stress Nowcaster moved higher over the week, largely due to higher volatilities.
Sources: Unigestion, Bloomberg, as of 28 January 2022
Important Information
This document is provided to you on a confidential basis and must not be distributed, published, reproduced or disclosed, in whole or part, to any other person.
The information and data presented in this document may discuss general market activity or industry trends but is not intended to be relied upon as a forecast, research or investment advice. It is not a financial promotion and represents no offer, solicitation or recommendation of any kind, to invest in the strategies or in the investment vehicles it refers to. Some of the investment strategies described or alluded to herein may be construed as high risk and not readily realisable investments, which may experience substantial and sudden losses including total loss of investment.
The investment views, economic and market opinions or analysis expressed in this document present Unigestion’s judgement as at the date of publication without regard to the date on which you may access the information. There is no guarantee that these views and opinions expressed will be correct nor do they purport to be a complete description of the securities, markets and developments referred to in it. All information provided here is subject to change without notice. To the extent that this report contains statements about the future, such statements are forward-looking and subject to a number of risks and uncertainties, including, but not limited to, the impact of competitive products, market acceptance risks and other risks.
Data and graphical information herein are for information only and may have been derived from third party sources. Although we believe that the information obtained from public and third party sources to be reliable, we have not independently verified it and we therefore cannot guarantee its accuracy or completeness. As a result, no representation or warranty, expressed or implied, is or will be made by Unigestion in this respect and no responsibility or liability is or will be accepted. Unless otherwise stated, source is Unigestion. Past performance is not a guide to future performance. All investments contain risks, including total loss for the investor.
Unigestion SA is authorised and regulated by the Swiss Financial Market Supervisory Authority (FINMA). Unigestion (UK) Ltd. is authorised and regulated by the UK Financial Conduct Authority (FCA) and is registered with the Securities and Exchange Commission (SEC). Unigestion Asset Management (France) S.A. is authorised and regulated by the French “Autorité des Marchés Financiers” (AMF). Unigestion Asset Management (Canada) Inc., with offices in Toronto and Montreal, is registered as a portfolio manager and/or exempt market dealer in nine provinces across Canada and also as an investment fund manager in Ontario and Quebec. Its principal regulator is the Ontario Securities Commission (OSC). Unigestion Asset Management (Copenhagen) is co-regulated by the “Autorité des Marchés Financiers” (AMF) and the “Danish Financial Supervisory Authority” (DFSA). Unigestion Asset Management (Düsseldorf) SA is co-regulated by the “Autorité des Marchés Financiers” (AMF) and the “Bundesanstalt für Finanzdienstleistungsaufsicht” (BAFIN).