Correlations Gone Wild
Amongst the many aspects making the current correction a “special one”, the dislocation in cross asset correlations is of the essence. This statistic is the cornerstone of portfolio investing, as soon as it involves more than one single asset. The interactions between asset classes evolves over time and can remain stable over long periods or in specific circumstances… until they are not. The magnitude of the 2022 correlation shock is set to make history: an environment with little place to hide, but favourable for active investing.

Future Correlations

What’s Next
The key to capital allocation theories
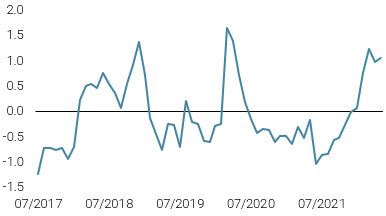
At the heart of all allocation mechanisms, from the simplest to the most complex, correlations assume that the past is a good indicator of an asset’s evolution compared to another. The best example is the theoretical relationship between equities and bonds, the two largest exposures in traditional diversified portfolios. Their long term relationship is deemed to have a negative correlation, which makes their combination effective over time, as one diversifies the other. When this relationship holds, the market context can be divided into two major regimes: “Risk ON”, when equities thrive and bonds lose in value, and conversely, “Risk OFF”, when investors unload equity risk and reallocate to safer assets, such as government bonds. Intermediary regimes, which we define as “beta party” (when supposedly negatively correlated assets thrive in concert), or conversely, “correlation shocks”, have become more frequent under the QE/QT era post GFC. Also, correlation levels can look different depending on the frequency/observation-window combination. As such, the quarterly equity/bond correlation since the early 1970s has an average close to 0, while calculating on a daily or weekly basis yields a negative correlation of -0.25. Obviously, these measures can vary considerably from their long-term average when looking at specific, shorter time windows. The quarterly relationship between the two major asset classes over a 1year rolling window has varied from +0.7 to -0.8 over the past 50 years, as shown in figure 1 below.
We believe that changes in correlation regimes are driven by changes in macro regimes, and that asset returns’ correlations to different types of macroeconomic environments are more stable over time than cross assets correlations, making a strong case for macro risk based investing.
Figure 1: Equity/Bond historical correlation
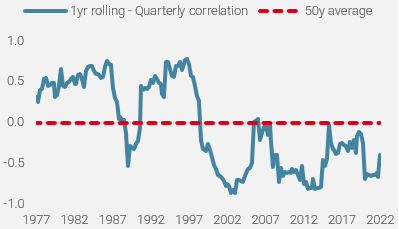
Source: Bloomberg, Unigestion as of 31.03.2022
Looking at it differently, one could ask: how often did government bonds offer some protection when equities lost value? Figure 2 illustrates the frequency (hit ratio) of positive bond returns when equities were down, on a weekly basis and over a 6-month rolling window. Currently standing at 37%, it is one of these rare instances when governments bonds offer protection only one third of the time, well below their long term expected average of 68%, approximately two thirds of the time.
Figure 2: S&P500 drawdowns and government bond hit ratio
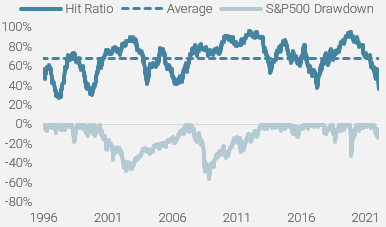
Source: Bloomberg, Unigestion as of 06.05.2022
Even more important than the frequency of correlation dislocations is the depth of the correlation shock. In that respect, the shock endured since the beginning of the year is exceptional. Figure 3 plots the quarterly returns of US Bonds vs the S&P 500.
Figure 3: Quarterly returns – Global US treasuries vs S&P 500
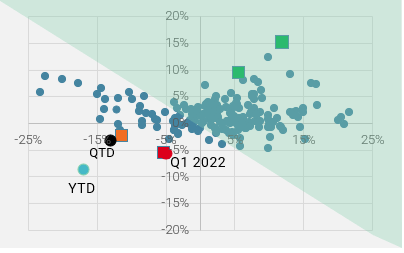
Source: Bloomberg, Unigestion as of 06.05.2022
Many observations can be made from this chart:
- A majority of occurrences are located in the green area, which corresponds to positive returns for a 50/50 allocation to equities and bonds.
- In the left half of the chart, where equity returns are negative, a vast majority of occurrences show positive returns for bonds, hence acting as an effective hedge under “Risk OFF” regimes.
- As for 2022, the red and black dots highlight Q1 and Q2 to-date returns respectively, which, from a historical perspective, ranks them amongst the worst correlation shocks in the last 50 years, as further illustrated in Figure 4.
- The comparable red and orange squares occurred in Q1 1980 and Q3 1981, after the second oil shock that sent CPI inflation to 15% and Fed rates to… 20%. And it’s no coincidence: inflation shocks tend to be THE main factor behind major correlation dislocations, as the repricing of the inflation premium pushes nominal yields higher, leading to losses in the bonds space and igniting the equity correction.
- Correlations shocks don’t last, as ultimately, something has to give: recession follows the inflation shock, forcing central banks to stop tightening and/or soften monetary policy. This keeps equity returns negative, but bonds start to play their hedging role again, or conversely, growth remains elevated and inflation peaks, helping equities stage a comeback while bond returns are muted. The green squares highlight the performances of Q2 1980 and Q4 1981. In these specific cases, the correlation shocks were followed by a large “beta party”.
- Although we believe that the worst is behind us with respect to the magnitude of the correlation shock that markets are currently experiencing, it does not necessarily mean that the benchmark 50/50 allocation will behave as it did in the 1980s, which posted stellar returns in the following quarter. The reasons behind this view is that: 1) the absolute level of bonds carry today (around 3% vs 15% back then) makes it much more difficult to generate large short term returns and 2) the Fed seems ready to fight inflation at all costs, despite the risk of pushing the US economy into recession, keeping sentiment toward risk assets at depressed levels.
Figure 4: Rolling Drawdown – 50/50 allocation
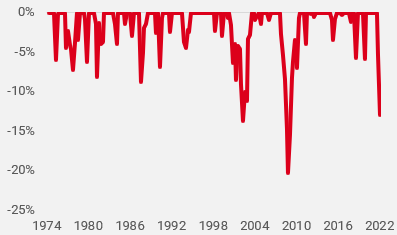
Source: Bloomberg, Unigestion as of 06.05.2022
Elsewhere
Some correlation mechanisms and/or assumptions sometimes work, confirming intuition, sometimes not.
When it comes to hedging assets, Gold is believed to be an efficient hedge at times of elevated inflation, as it is the ultimate store of value. Even if one could confirm this assumption through its positive long term correlation to the US CPI, the truth of the matter is that Gold is more (negatively) influenced by 1) real rates and 2) the US dollar. No wonder then that gold lost 10% since its March 8 peak at 2025, coinciding with a rapid surge in both the US dollar and real rates.
Growth assets, especially in the Tech sector, whose relative performance is negatively correlated to interest rates, have underperformed – unfortunately but not unexpectedly – in the current context of monetary tightening and interest rates shock. Moreover, another asset class, now highly interconnected with Tech, also underwent a large correlation “surprise” in 2022. Cryptocurrencies, “historically” considered to be uncorrelated to any other risk premia, have seen a large correlation spike to date, and at a very inopportune time.
Conclusion
Correlation, or rather the lack of correlation between financial assets is what makes diversification effective most of the time. More importantly, it is of paramount importance to identify regime shifts, especially these particular planetary alignments that lead to large correlation shocks. The triggers can differ from one episode to another, but their commonality is that they need to be frightening enough to push investors to embark in broad deleveraging, such as: systemic shocks (2008’s GFC), inflation shocks (1970s, 2022), monetary policy shocks (2018, 2022) or exogenous shocks (Covid).
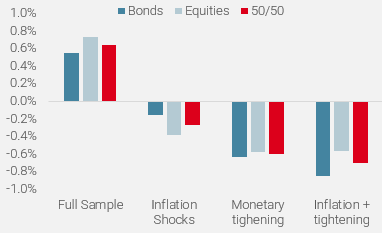
As mentioned earlier, being able to predict macro regimes accurately allows for some greater predictability in correlation shocks and proactive adjustments in portfolio allocation. Figure 5 compares the returns of equities, bonds, and a 50/50 allocation under inflation and monetary shocks. Unsurprisingly, the average excess monthly return is negative in such scenarios. Based on these more stable relationships and having identified the inflation risk early in 2021 and 2022, thanks to our proprietary macro Nowcasters, our dynamic allocation adjusted the exposure to these asset classes accordingly.
Figure 5: Regime based returns since 1973
Source: Bloomberg, Unigestion as of 11.05.2022
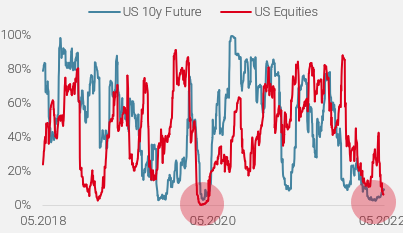
If history is any guide, major correlation shocks are followed by a normalisation in cross asset behaviours, making diversification great again. Our internal complacency indicator currently indicates extreme pessimism in both risk and hedging assets, which is usually a good indicator for future correlation mean reversion.
Figure 6: Complacency indicators
Source: Bloomberg, Unigestion as of 11.05.2022
We believe that we’re getting closer or are already in this second phase. Many risks remain on the horizon, from a monetary policy mistake to a lingering inflation environment, or even a recession. Investor complacency has been washed away in 2022, and these risks and swift changes in macroeconomic fundamentals have finally been incorporated into asset prices. In that respect, we remain cautious for now, with low exposures to most risk premia, and stand ready to redeploy risk when uncertainty recedes and/or market action is considered excessively pessimistic.
Unigestion Nowcasting
World Growth Nowcaster
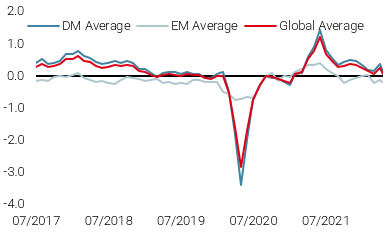
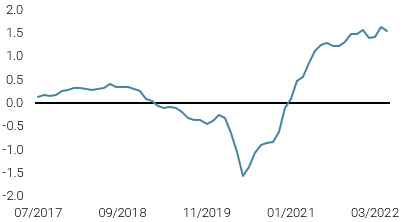
World Inflation Nowcaster
Market Stress Nowcaster
Weekly Change
- Last week, our World Growth Nowcaster fell slightly, as US employment conditions stabilise.
- Our World Inflation Nowcaster was steady, with most economies continuing to see sustained inflationary pressures.
- Our Market Stress Nowcaster ticked slightly lower as underlying components eased.
Sources: Unigestion, Bloomberg, as of 16 May 2022
Important Information
This document is provided to you on a confidential basis and must not be distributed, published, reproduced or disclosed, in whole or part, to any other person.
The information and data presented in this document may discuss general market activity or industry trends but is not intended to be relied upon as a forecast, research or investment advice. It is not a financial promotion and represents no offer, solicitation or recommendation of any kind, to invest in the strategies or in the investment vehicles it refers to. Some of the investment strategies described or alluded to herein may be construed as high risk and not readily realisable investments, which may experience substantial and sudden losses including total loss of investment.
The investment views, economic and market opinions or analysis expressed in this document present Unigestion’s judgement as at the date of publication without regard to the date on which you may access the information. There is no guarantee that these views and opinions expressed will be correct nor do they purport to be a complete description of the securities, markets and developments referred to in it. All information provided here is subject to change without notice. To the extent that this report contains statements about the future, such statements are forward-looking and subject to a number of risks and uncertainties, including, but not limited to, the impact of competitive products, market acceptance risks and other risks.
Data and graphical information herein are for information only and may have been derived from third party sources. Although we believe that the information obtained from public and third party sources to be reliable, we have not independently verified it and we therefore cannot guarantee its accuracy or completeness. As a result, no representation or warranty, expressed or implied, is or will be made by Unigestion in this respect and no responsibility or liability is or will be accepted. Unless otherwise stated, source is Unigestion. Past performance is not a guide to future performance. All investments contain risks, including total loss for the investor.
Unigestion SA is authorised and regulated by the Swiss Financial Market Supervisory Authority (FINMA). Unigestion (UK) Ltd. is authorised and regulated by the UK Financial Conduct Authority (FCA) and is registered with the Securities and Exchange Commission (SEC). Unigestion Asset Management (France) S.A. is authorised and regulated by the French “Autorité des Marchés Financiers” (AMF). Unigestion Asset Management (Canada) Inc., with offices in Toronto and Montreal, is registered as a portfolio manager and/or exempt market dealer in nine provinces across Canada and also as an investment fund manager in Ontario and Quebec. Its principal regulator is the Ontario Securities Commission (OSC). Unigestion Asset Management (Copenhagen) is co-regulated by the “Autorité des Marchés Financiers” (AMF) and the “Danish Financial Supervisory Authority” (DFSA). Unigestion Asset Management (Düsseldorf) SA is co-regulated by the “Autorité des Marchés Financiers” (AMF) and the “Bundesanstalt für Finanzdienstleistungsaufsicht” (BAFIN).