Over the past six months, macro factors, sentiment and valuation have all played a significant role in driving asset returns. Investors had to consider each of them to capture the extraordinary upside potential over the period. However, while macro data continues on a positive trend, sentiment is out of breath and valuations are back to neutral levels. Is the current macro uptrend capable of lifting market sentiment again or will it only add confusion to an already complex situation? A sustained growth acceleration would likely crack the shutters, creating a wake-up call for many bondholders but is it likely? It is not our core scenario, and here is why. To recap: from February 2018 to March this year, a convergence of economic forces led to a sustained macro deceleration that combined negatively with the Fed’s policy U-turn when it began to deleverage its balance sheet. The Eurozone fell into a significant deceleration, waking up its central bankers to the risk of an imminent recession. The slowdown in world trade led to a deceleration of the Chinese economy that had to be countered by tier-2 government stimulation. Finally, in the US, the rise in yields took its toll on the housing market, following a run of negative quarterly contributions by the sector to the country’s GDP growth. For five quarters in a row, the sector delivered a total negative contribution of around 0.6% over the period, enough to generate worries among investors and central bankers alike. Each of these weaknesses seem to have been recently offset by a specific element:“CRACK THE SHUTTERS” – Snow Patrol, 2008
What’s Next?
Recent Developments in Context
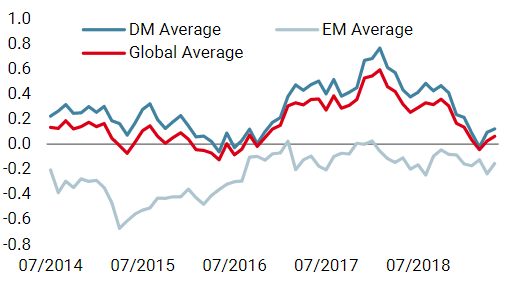
- In China, at the end of December 2018, only 38% of data was improving: another indication of the global slowdown. For the first time since 2015, the macro data across four macro sectors were showing signs of weakness: not only its housing sector but also external demand, production expectations and Chinese consumption, which had been robust until then. That was more than enough for the central government to decide on a new round of stimulation amounting to 3% of the Chinese GDP: a game changer for the country and a welcome lift for global growth. It helped lift the domestic economic sectors of the economy, and growth stabilisation is now visible in our Chinese Growth Nowcaster.
- The offset was more muted in the Eurozone. In mid-March, growth forces were at their bottom. The Eurozone component of our Growth Nowcaster painted a gloomy picture: production expectations, non-durable goods consumption and financing conditions were in negative territories. The rest of its components remained positive but far from December 2017 levels – overall a very concerning picture. Yet, since then, macro news flow has improved: a slight kick in the consumption of durable (probably rates driven) and non-durable (probably reflecting lower oil prices over the preceding months) goods and slightly less negative producer expectations explain this moderate up-tick, if not mere stabilisation. This stabilisation is likely to have a significant impact on markets given previous investor bearishness on the Eurozone: surprise indices jumped massively from -100 to -14: almost back to neutral levels.

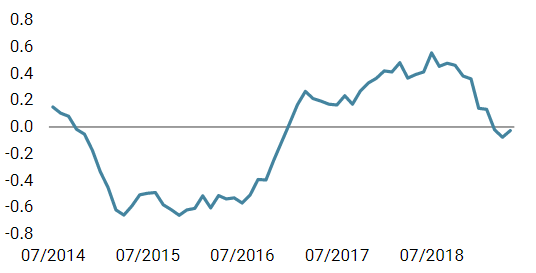
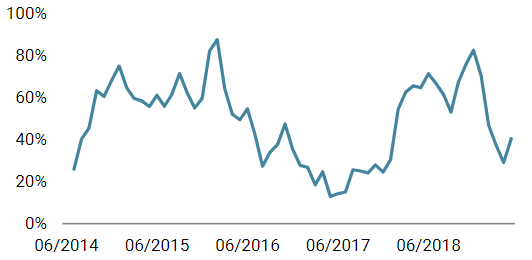
Our Growth Nowcaster is currently recording on average 56% of improving data across the 90% of global GDP that our indicators monitor. That is a big number, raising the question of its sustainability. What we can learn from history is the following: between 1985 and 2019, we have experienced 35 such periods (diffusion index rising above 55%), with an average duration of 2 months: short periods on average. The longest period of macro improvement happened in 2010, a period of negative equity returns overall (-4.5% on the MSCI World index) and positive bonds returns (+3.65%): a long lasting acceleration period is not necessarily a bullish indication. This period was very particular, coming at the end of the GFC and with central bank stimulation exerting a significant influence over markets. 16 of 35 periods were only brief accelerations, lasting just a month. Interestingly, one of these occurrences happened in August 2005 after a long deceleration period from January 2004 to July 2005, a period with many similarities to the one we are currently experiencing. What followed this brief acceleration was a series of slowdown/pause periods, eventually leading to 2008 three years later. In the meantime, both equities and bonds delivered positive returns. We are currently not overly convinced by the sustainability of this development. The picture we are getting is that the previous macro slowdown is making a pause. It means that the pricing of recession risk could be questioned sooner or later, should this improvement last for more than one month, but we are not there yet. What worries us more for now is the second round consequences of slowing global trade on many economies that have grown accustomed to it, emerging and developed alike. The risks there are not only brisk rises in risk aversion, but also an increased risk of recession should stubbornness take the upper hand over reason. Our positioning therefore remains constructive towards growth assets, with hedges, acknowledging both the improvement and the rising tail risks.56% of Improving Data: Is It Sustainable?

Crack the Shutters

Our medium-term views are fairly neutral, with selective overweights in risky assets including investment grade and emerging credit. We continue to protect the downside from an equity sell-off via options as we see challenging conditions for global equities. Month to date, the Multi Asset Risk Targeted Strategy fund was down 0.75% versus -3.22% for the MSCI AC World Index and 0.53% for the Barclays Global Aggregate (USD hedged). Year-to-date, the Multi Asset Risk Targeted Strategy has returned 4.60% versus 12.23% for the MSCI AC World index, while the Barclays Global Aggregate (USD hedged) index is up 3.60%. * The Multi Asset Risk Targeted Strategy performance is shown in USD net of fees for the representative account of the Multi Asset Risk Targeted (Medium) USD Composite and reflects the deduction of advisory fees and brokerage commission and the reinvestment of all dividends and earnings. Past performance is not indicative of future performance. This information is presented as supplemental information only and complements the GIPS compliant presentation provided on the following page.Strategy behaviour
Performance review
Unigestion nowcasting
World Growth Nowcaster
World Inflation Nowcaster
Market Stress Nowcaster
Weekly Change
- Our world Growth Nowcaster remained unchanged this week both across both developed and emerging countries.
- Our world Inflation Nowcaster increased for the first time in a long time, mainly driven by the stronger inflation data in the US.
- Market stress is unchanged over the week and remains volatile.
Sources: Unigestion. Bloomberg, as of 20 May 2019.
Important Information Past performance is no guide to the future, the value of investments can fall as well as rise, there is no guarantee that your initial investment will be returned. This document has been prepared for your information only and must not be distributed, published, reproduced or disclosed by recipients to any other person. This is a promotional statement of our investment philosophy and services only in relation to the subject matter of this presentation. It constitutes neither investment advice nor recommendation. This document represents no offer, solicitation or suggestion of suitability to subscribe in the investment vehicles it refers to. Please contact your professional adviser/consultant before making an investment decision. Where possible we aim to disclose the material risks pertinent to this document, and as such these should be noted on the individual document pages. Please contact Unigestion for a complete list of all the applicable risks. Some of the investment strategies described or alluded to herein may be construed as high risk and not readily realisable investments, which may experience substantial and sudden losses including total loss of investment. These are not suitable for all types of investors. To the extent that this report contains statements about the future, such statements are forward-looking and subject to a number of risks and uncertainties, including, but not limited to, the impact of competitive products, market acceptance risks and other risks. As such, forward looking statements should not be relied upon for future returns. Data and graphical information herein are for information only and may have been derived from third party sources. Unigestion takes reasonable steps to verify, but does not guarantee, the accuracy and completeness of this information. As a result, no representation or warranty, expressed or implied, is or will be made by Unigestion in this respect and no responsibility or liability is or will be accepted. All information provided here is subject to change without notice. It should only be considered current as of the date of publication without regard to the date on which you may access the information. Rates of exchange may cause the value of investments to go up or down. An investment with Unigestion, like all investments, contains risks, including total loss for the investor. This information is issued by Unigestion (UK) Ltd (“Unigestion”), which is authorised and regulated by the UK Financial Conduct Authority (“FCA”). Unigestion is also registered as an investment adviser with the U.S. Securities and Exchange Commission (“SEC”). This information is intended only for professional clients, institutional clients and eligible counterparties, as defined by the FCA, and qualified purchasers as defined by the SEC and has therefore not been adapted to retail clients. Unigestion Multi Asset Risk-Targeted (USD): 31 December 2014 to 31 December 2018 1: This year is incomplete. Special Disclosure: For presentations prior to 31.03.2018 the strategy was measured against the LIBOR 3M USD + 4%. Beginning April 2018 the firm determined that the benchmark did not accurately reflect the strategy mandate and the benchmark was removed. Definition of the Firm: For the purposes of applying the GIPS Standards, the firm is defined as Unigestion. Unigestion is responsible for managing assets on the behalf of institutional investors. Unigestion invests in several strategies for institutional clients: Equities, Hedge Funds, Private Assets and the solutions designed for the clients of our Cross Asset Solution department. The GIPS firm definition excludes the Fixed Income Strategy Funds, which started in January 2001 and closed in April 2008, and the accounts managed for private clients. Unigestion defines the private clients as High Net Worth Families and Individual investors. Policies: Unigestion policies for valuing portfolios, calculating performance, and preparing compliant presentations are available upon request. Composite Description: The Multi Risk Targeted (Medium) composite was defined on 15 December 2014. It consists of accounts which aim to deliver consistent smooth returns of cash + 5% gross of fees across all market conditions over a 3-year rolling period. It seeks to achieve this by capturing the upside during bull markets while protecting capital during market downturns. Benchmark: Because the composites strategy is absolute return and investments are permitted in all asset classes, no benchmark can reflect this strategy accurately. Fees: Returns are presented gross of management fees, administrative fees but net of all trading costs and withholding taxes. The maximum management fee schedule is 1.2% per annum. Net returns are net of model fees and are derived by deducting the highest applicable fee rate in effect for the respective time period from the gross returns each month. List of Composites: A list of all composite descriptions is available upon request. Minimum Account Size: The minimum account size for this composite is 5’000’000.- USD. Valuation: Valuations are computed in US dollars (USD). Performance results are reported in US dollars (USD). Internal Dispersion & 3YR Standard Deviation: The annual composite dispersion presented is an asset-weighted standard deviation calculated for the accounts in the composite the entire year. When internal dispersion is not presented it is as a result of an insufficient number of portfolios in the composite for the entire year. When the 3 Year Standard Deviation is not presented it is as a result of an insufficient period of time. Compliance Statement Unigestion claims compliance with the Global Investment Performance Standards(GIPS®) and has prepared and presented this report in compliance with the GIPS standards. Unigestion has been independently verified for the periods 1 January 2003 to 31 December 2016. The verification report(s) is/are available upon request. Verification assesses whether (1) the firm has complied with all the composite construction requirements of the GIPS standards on a firm-wide basis and(2) the firms policies and procedures are designed to calculate and present performance in compliance with the GIPS standards. Verification does not ensure the accuracy of any specific composite presentation.
Year
Composite
Return Gross
of FeesComposite Net Return
Benchmark Return
Number of Accounts
Internal Dispersion
Composite 3-Yr Std Dev
Benchmark 3-Yr Std Dev
Composite AUM (M)
Firm
AUM (M)
2015
-1.61%
-2.80%
–
1
–
–
–
127.24
15,550.31
2016
5.05%
3.79%
–
1
–
–
–
129.66
18,144.46
2017
11.16%
9.82%
–
1
–
–
–
169.51
22,340.80
2018
-2.91%
-4.08%
–
1
–
–
–
286.93
21,403.49
20191
5.06%
4.74%
–
1
–
–
–
278.23
23,204.71