Over the past six months, macro factors, sentiment and valuation have all played a significant role in driving asset returns. Investors had to consider each of them to capture the extraordinary upside potential over the period. However, while macro data continues on a positive trend, sentiment is out of breath and valuations are back to neutral levels. Is the current macro uptrend capable of lifting market sentiment again or will it only add confusion to an already complex situation? A sustained growth acceleration would likely crack the shutters, creating a wake-up call for many bondholders but is it likely? It is not our core scenario, and here is why. To recap: from February 2018 to March this year, a convergence of economic forces led to a sustained macro deceleration that combined negatively with the Fed’s policy U-turn when it began to deleverage its balance sheet. The Eurozone fell into a significant deceleration, waking up its central bankers to the risk of an imminent recession. The slowdown in world trade led to a deceleration of the Chinese economy that had to be countered by tier-2 government stimulation. Finally, in the US, the rise in yields took its toll on the housing market, following a run of negative quarterly contributions by the sector to the country’s GDP growth. For five quarters in a row, the sector delivered a total negative contribution of around 0.6% over the period, enough to generate worries among investors and central bankers alike. Each of these weaknesses seem to have been recently offset by a specific element:“CRACK THE SHUTTERS” – Snow Patrol, 2008
What’s Next?
Recent Developments in Context
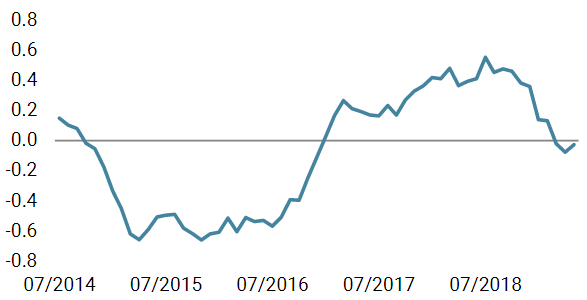
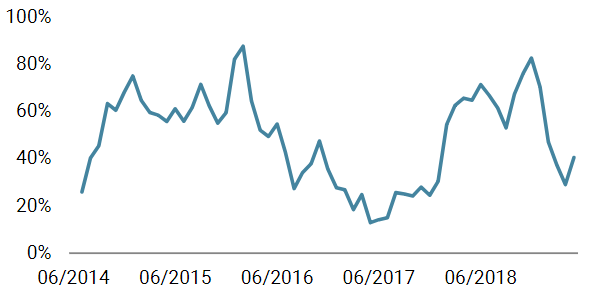
- In China, at the end of December 2018, only 38% of data was improving: another indication of the global slowdown. For the first time since 2015, the macro data across four macro sectors were showing signs of weakness: not only its housing sector but also external demand, production expectations and Chinese consumption, which had been robust until then. That was more than enough for the central government to decide on a new round of stimulation amounting to 3% of the Chinese GDP: a game changer for the country and a welcome lift for global growth. It helped lift the domestic economic sectors of the economy, and growth stabilisation is now visible in our Chinese Growth Nowcaster.
- The offset was more muted in the Eurozone. In mid-March, growth forces were at their bottom. The Eurozone component of our Growth Nowcaster painted a gloomy picture: production expectations, non-durable goods consumption and financing conditions were in negative territories. The rest of its components remained positive but far from December 2017 levels – overall a very concerning picture. Yet, since then, macro news flow has improved: a slight kick in the consumption of durable (probably rates driven) and non-durable (probably reflecting lower oil prices over the preceding months) goods and slightly less negative producer expectations explain this moderate up-tick, if not mere stabilisation. This stabilisation is likely to have a significant impact on markets given previous investor bearishness on the Eurozone: surprise indices jumped massively from -100 to -14: almost back to neutral levels.

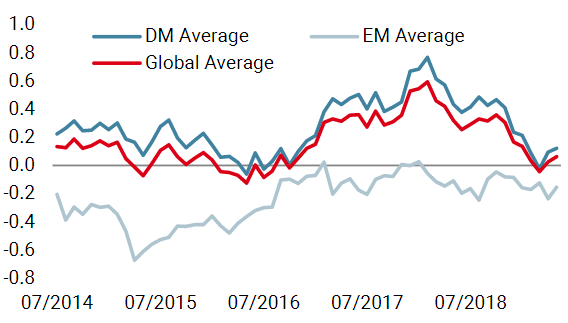
Our Growth Nowcaster is currently recording on average 56% of improving data across the 90% of global GDP that our indicators monitor. That is a big number, raising the question of its sustainability. What we can learn from history is the following: between 1985 and 2019, we have experienced 35 such periods (diffusion index rising above 55%), with an average duration of 2 months: short periods on average. The longest period of macro improvement happened in 2010, a period of negative equity returns overall (-4.5% on the MSCI World index) and positive bonds returns (+3.65%): a long lasting acceleration period is not necessarily a bullish indication. This period was very particular, coming at the end of the GFC and with central bank stimulation exerting a significant influence over markets. 16 of 35 periods were only brief accelerations, lasting just a month. Interestingly, one of these occurrences happened in August 2005 after a long deceleration period from January 2004 to July 2005, a period with many similarities to the one we are currently experiencing. What followed this brief acceleration was a series of slowdown/pause periods, eventually leading to 2008 three years later. In the meantime, both equities and bonds delivered positive returns. We are currently not overly convinced by the sustainability of this development. The picture we are getting is that the previous macro slowdown is making a pause. It means that the pricing of recession risk could be questioned sooner or later, should this improvement last for more than one month, but we are not there yet. What worries us more for now is the second round consequences of slowing global trade on many economies that have grown accustomed to it, emerging and developed alike. The risks there are not only brisk rises in risk aversion, but also an increased risk of recession should stubbornness take the upper hand over reason. Our positioning therefore remains constructive towards growth assets, with hedges, acknowledging both the improvement and the rising tail risks.56% of Improving Data: Is It Sustainable?

Crack the Shutters

Our medium-term views are fairly neutral, with selective overweights in risky assets including investment grade and emerging credit. We continue to protect the downside from an equity sell-off via options as we see challenging conditions for global equities. Month to date, the Uni-Global – Cross Asset Navigator fund was down 0.75% versus -3.22% for the MSCI AC World Index and 0.53% for the Barclays Global Aggregate (USD hedged). Year-to-date, the Uni-Global – Cross Asset Navigator has returned 4.60% versus 12.23% for the MSCI AC World index, while the Barclays Global Aggregate (USD hedged) index is up 3.60%.Strategy behaviour
Performance review
Unigestion nowcasting
World Growth Nowcaster
World Inflation Nowcaster
Market Stress Nowcaster
Weekly Change
- Our world Growth Nowcaster remained unchanged this week both across both developed and emerging countries.
- Our world Inflation Nowcaster increased for the first time in a long time, mainly driven by the stronger inflation data in the US.
- Market stress is unchanged over the week and remains volatile.
Sources: Unigestion. Bloomberg, as of 20 May 2019.
Past performance is no guide to the future, the value of investments can fall as well as rise, there is no guarantee that your initial investment will be returned.Navigator fund performance
Performance, net of fees
2018
2017
2016
2015
Navigator (inception 15 December 2014)
-3.6%
10.6%
4.4%
-2.2%
Important Information Past performance is no guide to the future, the value of investments can fall as well as rise, there is no guarantee that your initial investment will be returned. This document has been prepared for your information only and must not be distributed, published, reproduced or disclosed by recipients to any other person. This is a promotional statement of our investment philosophy and services only in relation to the subject matter of this presentation. It constitutes neither investment advice nor recommendation. This document represents no offer, solicitation or suggestion of suitability to subscribe in the investment vehicles it refers to. Please contact your professional adviser/consultant before making an investment decision. Where possible we aim to disclose the material risks pertinent to this document, and as such, these should be noted on the individual document pages. A complete list of all the applicable risks can be found in the Fund prospectus. Some of the investment strategies described or alluded to herein may be construed as high risk and not readily realisable investments, which may experience substantial and sudden losses including total loss of investment. These are not suitable for all types of investors. To the extent that this report contains statements about the future, such statements are forward-looking and subject to a number of risks and uncertainties, including, but not limited to, the impact of competitive products, market acceptance risks and other risks. As such, forward looking statements should not be relied upon for future returns. Data and graphical information herein are for information only and may have been derived from third party sources. Unigestion takes reasonable steps to verify, but does not guarantee, the accuracy and completeness of this information. As a result, no representation or warranty, expressed or implied, is or will be made by Unigestion in this respect and no responsibility or liability is or will be accepted. All information provided here is subject to change without notice. It should only be considered current as of the date of publication without regard to the date on which you may access the information. Rates of exchange may cause the value of investments to go up or down. An investment with Unigestion, like all investments, contains risks, including total loss for the investor. Uni-Global – Cross Asset Navigator is a compartment of the Luxembourg Uni-Global SICAV Part I, UCITS IV compliant. This compartment is currently authorised for distribution in Austria, Belgium, Denmark, Finland, France, Germany, Ireland, Italy, Luxembourg, Netherlands, Norway, Spain, UK, Sweden, and Switzerland. In Italy, this compartment can be offered only to qualified investors within the meaning of art.100 D. Leg. 58/1998. Its shares may not be offered or distributed in any country where such offer or distribution would be prohibited by law. All investors must obtain and carefully read the prospectus which contains additional information needed to evaluate the potential investment and provides important disclosures regarding risks, fees and expenses. Unless otherwise stated performance is shown net of fees in USD and does not include the commission and fees charged at the time of subscribing for or redeeming shares. Unigestion UK, which is authorised and regulated by the UK Financial Conduct Authority, has issued this document. Unigestion SAauthorised and regulated by the Swiss FINMA. Unigestion Asset Management (France) S.A. authorised and regulated by the French Autorité des Marchés Financiers. Unigestion Asia Pte Limited authorised and regulated by the Monetary Authority of Singapore. Performance source: Unigestion, Bloomberg, Morningstar. Performance is shown on an annualised basis unless otherwise stated and is based on Uni Global – Cross Asset Navigator RA-USD net of fees with data from 15.12.2014 to 20.05.2019.