Don’t Fight The Fed Means Higher Real Rates
Global equities and bond markets declined sharply last month, as some indices reached new yearly lows, while rates jumped in the opposite direction and US and German 2-year yields culminated at yearly highs. Consequently, balanced multi-asset strategies such as the typical 60/40 portfolio are down more than 10% in 2022, their worst start for the year since 2008. Real rates thus rose substantially over a short period of time, and the question now is whether this surge is near the end, as history would suggest. Given the central banks’ overarching aim to tame future inflation expectations, we believe that real rates have further to rise.

Do You Really Want To Hurt Me

What Next?
April real rates repricing
Contrary to the prophecies of main prime brokers and Wall Street gurus, that April should be very good month for stock markets based on flow seasonality, global equities declined sharply last month, as most indices reached new yearly lows. The S&P500 tumbled 8.8%, its worst month since March 2020, when US equities plunged 12.5%. Consequently, VIX futures jumped above 32 and the VIX forward curve inversed once again. As often in this kind of context, dispersion within and across assets was large, mainly driven by a repricing of the growth premium, which has affected the Tech sector (Nasdaq 100 fell -13.3% over the month). The S&P500 equal weighted index beat the market capitalisation index by 2.5%, as Value outperformed the other factors and Energy continued to post positive relative gains versus most other sectors. Thanks to a weaker currency, Japanese and European indexes fared better than US ones, while Emerging markets suffered from the new decline of Chinese equities over the period.
The key element behind this bearish trend is the aggressive stance adopted by major central banks. Short-term rates jumped again across the board, with US and German 2-year bond yields reaching new yearly highs, at respectively 2.7% and 0.3% mid-April. As a result, balanced strategies, typified by the 60/40 portfolio, dropped more than 10% in 2022, suffering the worst start of the year since 2008. Real asset performance was mixed, featuring a renewed jump in energy prices, mainly natural gas, while industrial metals suffered from new lockdowns in China. US 10-year breakevens rose to 2.9%.
Fighting inflation has become the priority for central bankers, regardless of the impact on financial assets or short-term growth momentum. In our view, the “re-anchoring” of long-term inflation expectations toward the central bank inflation targets implies higher real rates. As shown in the Figure 1, US 10-year real rates, approximated by the spread between the US 10-year nominal rates and the US 10-year breakeven, rose by 50bp in April. Historically, this monthly change represents a 2-sigma move and is thus a rare event. Since 1999, such a monthly change happened only six times: twice in 2003/04, when the Fed tightened sharply, twice in 2008, when inflation breakevens tumbled, and twice in 2013, during the taper tantrum episode.
Figure 1: Distribution of monthly changes in US 10-year real rates (1999-2022, bps)
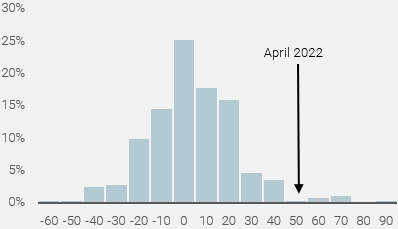
Source: Bloomberg, Unigestion, as of 30 April 2022
How do assets historically react to higher real rates?
Intuitively, higher real rates would imply negative returns for most growth-oriented assets because of the discount factor model. Nevertheless, an academic breakdown of nominal bond yields dissociates the inflation premium (inflation breakeven) from the growth premium (real rates), and the latter as key the driver of long-term treasury rates. In this well-known framework, positive and rising real rates point to higher and stronger growth. When we analyse the relationship between US 10-year real rates and monthly asset returns, there is no statistically significant relationship between the change in real rates and returns for most cyclical assets. However, the US dollar exhibits a positive and high sensitivity to higher US real rates. Nevertheless, when we focus on the right side of the distribution curve, which corresponds to the current situation, when real rates increase by one sigma or more, growth-oriented assets tend to post positive returns, with a high hit ratio (above 60%). Figure 2 shows how different the reaction of assets was this this year with respect to higher real rates. Indeed, this year Energy and US equities delivered much larger average monthly performances compared to history and above all, in the opposite direction of those observed between 1999 and 2021. We see two reasons behind this unusual pattern: 1) a bigger monetary policy surprise linked to the quick and sharp U-turn by the central banks, prompted by the shift from a “transitory” to “persistent” inflation shock 2) the volatility triggered by the geopolitical situation, raising the risk of a policy mistake.
Figure 2: Asset performance when the 10-year US rate monthly change rises more than one sigma
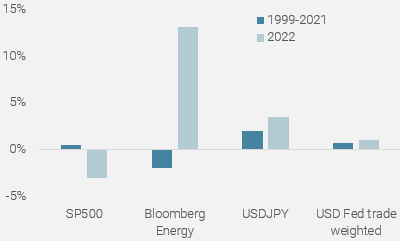
Source: Bloomberg, Unigestion, as of 30 April 2022
Is this time different?
The reversal of some historic asset correlations vs. real yields over the past month suggests that the market is indeed pessimistic on growth. As shown in Figure 3, the S&P500 correlated very negatively to real yields, while the Dollar Fed trade-weighted correlated even more positively. US equity correlation to real rates is at the record lows and in the last percentile since 1999. Regarding commodities, Gold has materially decoupled vs. real yields. Besides structural factors supporting higher gold prices, the divergence between gold and real rates is common when higher rates trigger growth concerns. This is also consistent with downward revised consensus GDP. As mentioned previously, the Energy sector exhibits a higher correlation to real assets than usual, currently in the 91st percentile. Finally, the US dollar trade-weighted index kept its typical relationship to real yields, and we believe that a continuation of the bonds sell-off might eventually trigger FX interventions, due to the negative impact on future inflation for weaker currencies.
Figure 3: Correlation between 10yr real rates and major assets
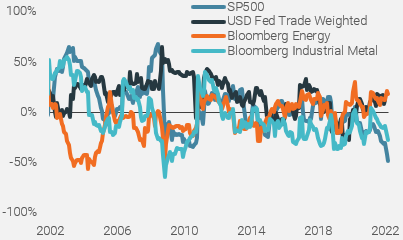
Source: Bloomberg, Unigestion, as of 30 April 2022
Stop or go even higher?
As shown historically, this kind of upside adjustment in real rates occurred in a short period (two to six months) and is usually associated with a Fed hiking cycle (Figure 4). After a 100bps adjustment over the last two months, should we consider the process as completed?
Figure 4: Historical monthly change in US 10-year real rates and Fed Fund rates
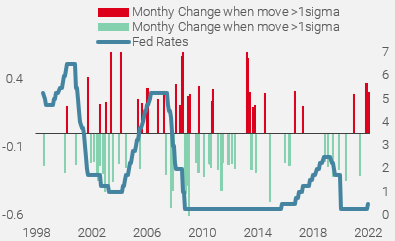
Source: Bloomberg, Unigestion, as of 30 April 2022
The answer depends on whether you focus on the absolute level or the change over that period. Over the last three Fed-hiking cycles since 1999, the change in real rates was on average 110 basis points, hence quite similar to the current adjustment. Nevertheless, history also shows that the Fed never stops to tighten financial conditions before 10-year real rates turn positive (4.2% in 2000, 2.5% in 2007 and 1% in 2018). Given that the current context features a record overshoot of inflation vs. its target and that the starting point for monetary normalisation is unusually accommodative, it seems reasonable to expect a larger rise in real rates and terminal real rates close to those seen during 2015/2018 hiking cycle, around 1%. If history repeats itself, we should continue to experience an environment driven by sudden volatility spikes and short-term correlation shocks. On a longer-term horizon however, higher real rates would also underline central bank credibility and confirm the Fed scenario, which sees the US economy as strong enough to absorb the current financial tightening.
Unigestion Nowcasting
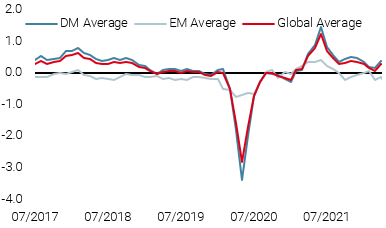
World Growth Nowcaster
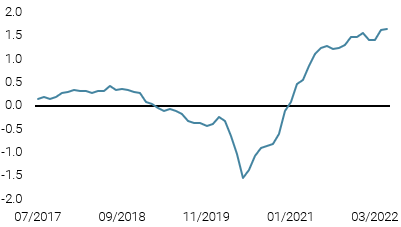
World Inflation Nowcaster
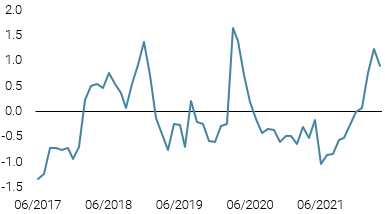
Market Stress Nowcaster
Weekly Change
- Last week, our World Growth Nowcaster declined slightly, as US and Chinese economies slowed.
- Our World Inflation Nowcaster moved up slightly with most economies seeing additional inflationary pressures.
- Our Market Stress Nowcaster was steady, as improving liquidity was offset by higher volatilities.
Sources: Unigestion, Bloomberg, as of 02 May 2022.
Important Information
This document is provided to you on a confidential basis and must not be distributed, published, reproduced or disclosed, in whole or part, to any other person.
The information and data presented in this document may discuss general market activity or industry trends but is not intended to be relied upon as a forecast, research or investment advice. It is not a financial promotion and represents no offer, solicitation or recommendation of any kind, to invest in the strategies or in the investment vehicles it refers to. Some of the investment strategies described or alluded to herein may be construed as high risk and not readily realisable investments, which may experience substantial and sudden losses including total loss of investment.
The investment views, economic and market opinions or analysis expressed in this document present Unigestion’s judgement as at the date of publication without regard to the date on which you may access the information. There is no guarantee that these views and opinions expressed will be correct nor do they purport to be a complete description of the securities, markets and developments referred to in it. All information provided here is subject to change without notice. To the extent that this report contains statements about the future, such statements are forward-looking and subject to a number of risks and uncertainties, including, but not limited to, the impact of competitive products, market acceptance risks and other risks.
Data and graphical information herein are for information only and may have been derived from third party sources. Although we believe that the information obtained from public and third party sources to be reliable, we have not independently verified it and we therefore cannot guarantee its accuracy or completeness. As a result, no representation or warranty, expressed or implied, is or will be made by Unigestion in this respect and no responsibility or liability is or will be accepted. Unless otherwise stated, source is Unigestion. Past performance is not a guide to future performance. All investments contain risks, including total loss for the investor.
Unigestion SA is authorised and regulated by the Swiss Financial Market Supervisory Authority (FINMA). Unigestion (UK) Ltd. is authorised and regulated by the UK Financial Conduct Authority (FCA) and is registered with the Securities and Exchange Commission (SEC). Unigestion Asset Management (France) S.A. is authorised and regulated by the French “Autorité des Marchés Financiers” (AMF). Unigestion Asset Management (Canada) Inc., with offices in Toronto and Montreal, is registered as a portfolio manager and/or exempt market dealer in nine provinces across Canada and also as an investment fund manager in Ontario and Quebec. Its principal regulator is the Ontario Securities Commission (OSC). Unigestion Asset Management (Copenhagen) is co-regulated by the “Autorité des Marchés Financiers” (AMF) and the “Danish Financial Supervisory Authority” (DFSA). Unigestion Asset Management (Düsseldorf) SA is co-regulated by the “Autorité des Marchés Financiers” (AMF) and the “Bundesanstalt für Finanzdienstleistungsaufsicht” (BAFIN).