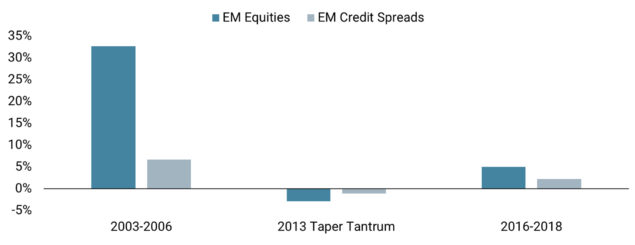
The chart compares the returns on the MSCI EM index to those of a long exposure to five-year EM CDX over the last three periods of rising US 10-year yields. EM equities tend to perform better in such an environment as they can benefit from the repricing of the growth premium embedded in bond yields.
We believe that EM equities provide an attractive risk/reward opportunity, as they had been flat year-to-date up until late May and stand to benefit from improved global demand and a fall in risk aversion. If the growth gap between the regions is closed by a pickup in emerging world growth, EM equities will be the greatest beneficiary.
Conversely, EM credit spreads are at risk in our view: with five-year spreads near their three-year lows, there is little room for prices to rise and the carry offered is minor. Indeed, our cross-asset valuation metric ranks EM credit spreads as the most expensive asset in our investment universe.
Source: Unigestion, Bloomberg, as of 2 June 2021
Important Information
The information and data presented in this page may discuss general market activity or industry trends but is not intended to be relied upon as a forecast, research or investment advice. It is not a financial promotion and represents no offer, solicitation or recommendation of any kind, to invest in the strategies or in the investment vehicles it refers to. Some of the investment strategies described or alluded to herein may be construed as high risk and not readily realisable investments, which may experience substantial and sudden losses including total loss of investment.
The investment views, economic and market opinions or analysis expressed in this page present Unigestion’s judgement as at the date of publication without regard to the date on which you may access the information. There is no guarantee that these views and opinions expressed will be correct nor do they purport to be a complete description of the securities, markets and developments referred to in it. All information provided here is subject to change without notice. To the extent that this page contains statements about the future, such statements are forward-looking and subject to a number of risks and uncertainties, including, but not limited to, the impact of competitive products, market acceptance risks and other risks.
Data and graphical information herein are for information only and may have been derived from third party sources. Although we believe that the information obtained from public and third party sources to be reliable, we have not independently verified it and we therefore cannot guarantee its accuracy or completeness. As a result, no representation or warranty, expressed or implied, is or will be made by Unigestion in this respect and no responsibility or liability is or will be accepted. Unless otherwise stated, source is Unigestion.
Past performance is not a guide to future performance. All investments contain risks, including total loss for the investor.