Financial Tightening: More To Come
Head of Macro and Dynamic Allocation, Cross Asset Solutions
As inflation surged to record highs not seen in decades around the world, most central banks embarked on a phase of monetary policy normalisation. While the path to normalisation may vary by region, depending on the inflationary contributors in each country, the time it took to recognise the “non-transitory” nature of the inflationary shock or the risk of recession, the direction for all central bankers is clear: financial conditions must tighten and shift from an accommodative to a restrictive stance. Where are we in this process? What can we expect in terms of asset allocation?

Bob Marley & The Wailers

What’s Next
Real Rates Curve Rises Expeditiously
The change in monetary policy bias can be measured in different ways. The spread between the policy rate and Taylor rate (the suggested Fed target rate with respect to inflation, employment and GDP) has often been a key indicator of how accommodative or restrictive monetary policy is. However, since the financial crisis of 2008 and the generalisation of quantitative easing, the Taylor rate has become less relevant. We believe that real rates, which reflect the difference between nominal rates and inflation expectations for a given maturity, are good tools for determining the nature of monetary policy. They reflect the real cost of any investment financed by debt. Thus, low or negative real rates indicate very favourable conditions for investing and taking risks and also represent a significant opportunity cost for holding cash, since its remuneration is eroded by the level of inflation that is not compensated by policy rates. Since the first Fed rate hike in March 2022, US real 10-year rates have risen by roughly 100 bps from -0.7% to 0.3%. Figure 1, which compares the current and pre-March rate hike U.S. real rate forward curves, highlights:
Figure 1: US Real Rates forward curve
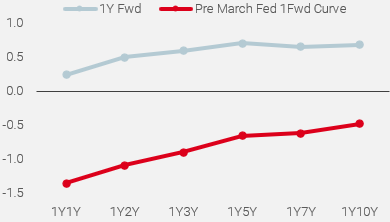
Source: Bloomberg, Unigestion, as of 27 May 2022
- that investors expect positive real rates in 1 year, regardless of maturity;
- that this increase was stronger on the short end of the curve – an adjustment of 160 bps for the 1Y1Y forward – than on the long end, where the increase was 115 bps for the 1Y10Y forward.
A rise in real rates can result either from a rise in nominal rates, a fall in inflation expectations, or a combination of both. An analysis of the recent movement observed in the 1-year forward curve of U.S. real rates since March 2022 shows:
Figure 2: Breakdown of changes of US real rates
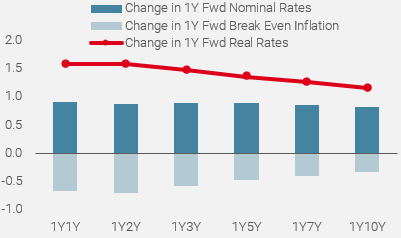
Source: Bloomberg, Unigestion, as of 27 May 2022
- that a large part of this adjustment was caused by the rise in nominal rates. Indeed, as shown in Figure 2, 10-year yields have risen by 82bps over the period, while inflation expectations have fallen from 2.6% to 2.3%, i.e. by 30bps.
- a flattening of the forward real rates curve via a more pronounced adjustment of short-term inflation expectations than those expected longer term. This curve shift reflects the Fed’s credibility and its desire to no longer be “behind the curve”, by aggressively and quickly normalising policy in the short term.
But Financial Conditions Only Shift Moderately
Major central banks monitor financial stability and their monetary policy stance through financial conditions indicators. The Chicago Fed has developed its own indicator to track the financial environment in debt, equity, and money markets as well as the traditional “shadow” banking system. This indicator is available on a weekly basis since 1970. The current level at -0.21 indicates that current financial conditions are looser than average, which goes counter the views on normalisation expressed by the Fed members. We are therefore convinced that, despite an increase of 0.3 in National Financial Conditions Index (NFCI) since the Fed’s U-turn about the transitory effect of inflation in Q4 2021, the path to tighter conditions is far from over. When analysing the 1970s episode of Fed tightening, we find that during this period of rate hikes, the NFCI was at 0.05 on average, 0.3 higher than current levels. More importantly, across these different periods, the NFCI increased by 1.02 on average during the rate hike cycles as shown in Figure 3.
Figure 3: Change in NFC during Fed hiking cycles since 1970
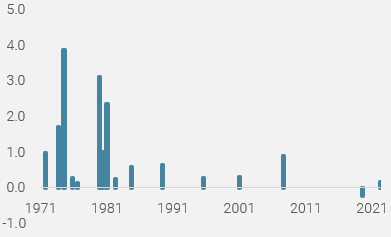
Source: Bloomberg, Unigestion, as of 30 April 2022
If we apply this to the indicator’s recent -0.2 reading from last March, an increase of 1.0 from current levels would imply a terminal level of +0.8 as for the NFCI.
The Chicago Fed has developed three sub-indexes to closely monitor the contributors in NFCI change. The risk sub index captures volatility and funding risk in the financial sector, the credit sub index is made up of credit conditions data and the leverage sub index consists of debt and equity measures. Higher risk, tighter credit conditions, and lower leverage are all consistent with tightening financial conditions. As shown in Figure 4, the recent evolution of these three sub-indexes gives a clear picture of which dimensions have already incorporated the change in monetary policy and which ones are lagging. The biggest change observed over the last 6 months is Leverage Index, which increased sharply from -0.70 in November to +0.34 mid-May. This perfectly reflects the rise in bond yields and the decline in equity markets. The Risk sub index has also risen, highlighting higher volatility and bigger funding risk. Finally, the Credit sub index did not move a lot over the period, showing that despite the sharp re-pricing of US monetary policy, visible through the jump in mortgage rates, access to credit remains favourable for household and corporates.
Figure 4: Sub indexes of Chicago Financial Condition Index

Source: Bloomberg, Unigestion, as of 27 May 2022
Historically, this sub index is negatively correlated to long term bond yields, because the growth risk matters more than inflation risk for solvability and debt sustainability. That’s why we believe that Financial Conditions should continue to tighten and that the NFCI will rise further. Indeed, we think that the required rise in rates needed to curb inflation will lead to a sharper slowdown than initially expected by the Fed, and then significantly weigh on the credit sub index as in previous hiking cycles. Since 1970, the average credit index level observed at the end of hiking was 1.1, far from the current level at 0.01.
Does Someone Say “More to Come”?
Last but not least, monetary policy is not the only element to normalise this year. As shown in Figure 5, fiscal policy is becoming restrictive after two years of supportive fiscal boost. Combining the Fed’s balance sheet and the Federal budget as a % of GDP exhibits an extraordinary change in the US policy mix stance, from +25% of GDP for 2021 to -10% of GDP for this year.
Figure 5: US Policy mix change
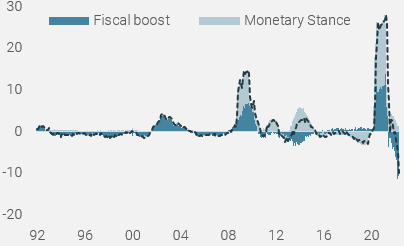
Source: Bloomberg, Unigestion, as of 27 May 2022
In such a worsening context for growth-oriented assets, we maintain a cautious stance in our tactical positioning. Credit spreads and most equity markets have room to deteriorate to incorporate the tighter financial conditions we expect to in the coming quarters. We also think that, given the slowdown we expect in investment and consumption, real assets should decline from very high levels in the inflation risk premium. This downward adjustment, combined with higher risk of market turmoil, should improve the risk-reward of using sovereign bonds for hedging growth risk.
Unigestion Nowcasting
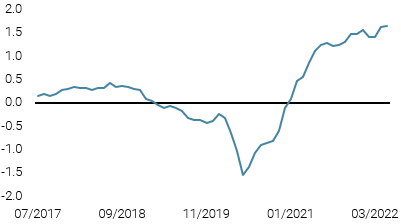
World Growth Nowcaster
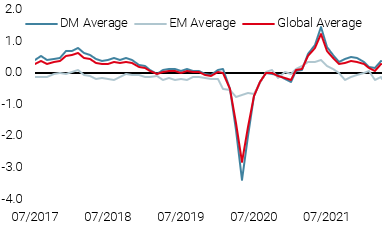
World Inflation Nowcaster
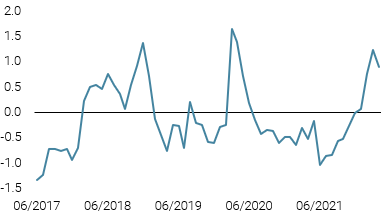
Market Stress Nowcaster
Weekly Change
- Last week, our World Growth Nowcaster was steady at just-under potential levels, continuing to be weighed down by China and the Eurozone.
- Our World Inflation Nowcaster was steady, with most countries continuing to experience elevated inflation pressures.
- Our Market Stress Nowcaster declined over the week, as implied volatilities fell and spreads tightened.
Sources: Unigestion, Bloomberg, as of 30 May 2022.
Important Information
This document is provided to you on a confidential basis and must not be distributed, published, reproduced or disclosed, in whole or part, to any other person.
The information and data presented in this document may discuss general market activity or industry trends but is not intended to be relied upon as a forecast, research or investment advice. It is not a financial promotion and represents no offer, solicitation or recommendation of any kind, to invest in the strategies or in the investment vehicles it refers to. Some of the investment strategies described or alluded to herein may be construed as high risk and not readily realisable investments, which may experience substantial and sudden losses including total loss of investment.
The investment views, economic and market opinions or analysis expressed in this document present Unigestion’s judgement as at the date of publication without regard to the date on which you may access the information. There is no guarantee that these views and opinions expressed will be correct nor do they purport to be a complete description of the securities, markets and developments referred to in it. All information provided here is subject to change without notice. To the extent that this report contains statements about the future, such statements are forward-looking and subject to a number of risks and uncertainties, including, but not limited to, the impact of competitive products, market acceptance risks and other risks.
Data and graphical information herein are for information only and may have been derived from third party sources. Although we believe that the information obtained from public and third party sources to be reliable, we have not independently verified it and we therefore cannot guarantee its accuracy or completeness. As a result, no representation or warranty, expressed or implied, is or will be made by Unigestion in this respect and no responsibility or liability is or will be accepted. Unless otherwise stated, source is Unigestion. Past performance is not a guide to future performance. All investments contain risks, including total loss for the investor.
Unigestion SA is authorised and regulated by the Swiss Financial Market Supervisory Authority (FINMA). Unigestion (UK) Ltd. is authorised and regulated by the UK Financial Conduct Authority (FCA) and is registered with the Securities and Exchange Commission (SEC). Unigestion Asset Management (France) S.A. is authorised and regulated by the French “Autorité des Marchés Financiers” (AMF). Unigestion Asset Management (Canada) Inc., with offices in Toronto and Montreal, is registered as a portfolio manager and/or exempt market dealer in nine provinces across Canada and also as an investment fund manager in Ontario and Quebec. Its principal regulator is the Ontario Securities Commission (OSC). Unigestion Asset Management (Copenhagen) is co-regulated by the “Autorité des Marchés Financiers” (AMF) and the “Danish Financial Supervisory Authority” (DFSA). Unigestion Asset Management (Düsseldorf) SA is co-regulated by the “Autorité des Marchés Financiers” (AMF) and the “Bundesanstalt für Finanzdienstleistungsaufsicht” (BAFIN).