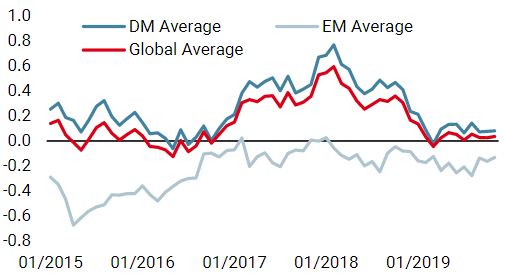
October began in the shadow of highly negative expectations but ended on a positive note, as key dangers were avoided. At the start of the month, fears of recession were making headlines, expectations of central bank action were high while geopolitical stress was elevated due to Brexit and trade war tensions. In addition, US corporate earnings for Q3 were released in the face of growing pessimism. However, these pockets of risk have since receded, feeding the bulls with fresh vitamins to prepare for the cold months ahead. Both risky and hedging assets have enjoyed the ride but rotation, dispersion, and correlation distortions have started to appear in numerous asset classes, leaving us with questions to answer. Will this trend continue, which assets will end up flying to the moon, and how can we position ourselves for the final 40 trading days of the year? Economic conditions have continued to stabilise and consolidate around potential levels in October, with the number of improving data prints increasing through the month. Our proprietary Growth Nowcaster indicates that global economic activity is growing moderately but far from recessionary levels. We have observed this stabilisation for more than six months now without any signs of deterioration, both in developed and emerging countries, and we remain comfortable with the quality of the signal. Our assessment has been validated recently with a higher-than-expected US quarterly GDP at a 1.9% annualised growth rate, broadly unchanged versus Q2. Naysayers will argue that the breakdown is worrying given that only consumer-based measures contributed positively, while other components were more muted. The weakness in investment can be attributed to an escalation in trade tensions over the summer. If true, any improvement on that front will have a positive impact on soft data and capex, which could push growth above 2% in the near term. The consumer is therefore getting most of the attention these days and as long as employment data remains firm, the long-lasting effects of a benign job market will continue to be favourable for growth. Elsewhere, early signs of improvement are a source of hope in Europe, particularly France and Italy, while China shows signs of strengthening from below-potential levels. October also saw another round of hotly anticipated central bank meetings. The Fed, ECB, BoJ and others adjusted their monetary policy stances, and largely delivered on investors’ expectations to keep monetary support alive for longer. Ample accommodation remains in place to sustain growth and revive inflation, which remains the missing part in the equation. Mario Draghi left the ECB against a mixed backdrop with both growth and inflation undershooting the bank’s target, but having avoided a major systemic breakdown and recession. Fed President Jerome Powell very recently delivered the third and possibly last of his so-called “mid-cycle adjustment” rate cuts. He and his fellow FOMC colleagues contend with acceptable economic growth and sound employment data on one hand and undershooting inflation, industrial slowdown and trade risks on the other. We consider that central banks have adjusted their policies pragmatically, achieved their goals, and will now need to observe the effects of monetary support over the quarters to come. Looking forward, we do not expect headwinds from policy makers, who should maintain their accommodative stances unless they start posing risks of overheating economic activity, or inflation. The latter is still nowhere to be seen and represents another positive for risk-taking. Concerns around Brexit, trade, Middle East tensions and Q3 earnings have all waned over the course of the month, improving market sentiment. The great wall of worry has disappeared and paved the way for gradual increases in risk appetite throughout October. Odds of a hard Brexit have substantially diminished, although election risks will now take centre stage. Trade tensions between the US and China subsided as well, with both parties finally showing the will to compromise. Skies have cleared on the micro front too. More than 80% of S&P 500 companies that have reported Q3 results thus far have beaten earnings expectations. In Europe, 61% of Stoxx 600 earnings are better than expected, an improvement from previous quarters in spite of absolute negative earnings growth. Owing to strong initial pessimism, companies beating expectations were better rewarded than poorer performing ones were punished. Altogether, global stock indices reached new all-time highs in October, with a return of +2.7% for the MSCI All Country and more than +20% year to date. Meanwhile, the Volatility Index (VIX) dropped from 20% early in the month to 13% on October 31st. Hedging assets (government bonds) weakened accordingly: 10-year treasury yields rose to three-month highs of 1.86%, while broad sovereign indices lost 0.45% in total return terms, ending lower for the second month in a row. Under the surface however, rotation and correlation distortions have been at work for a couple of months and these will have to be monitored closely to optimise allocation decisions and avoid being caught in unwanted style reversals. Lately, the rise in real yields has finally started to trigger outperformance in value and high dividend stocks versus growth and momentum styles, which had massively outperformed earlier in the year. The same applies to emerging stock indices, which outperformed their developed peers, posting 4.18% and 2.8% respectively. The quest for increased carry, improvements in macroeconomic and geopolitical conditions and a weakening US dollar helped buoy emerging assets. In contrast, low volatility equity strategies suffered from the repricing in duration and the surge in risk appetite, while high yield credit undershot its historical beta to stock indices as rich valuations and extreme crowding weighed on demand for the asset class.“Fly Me to The Moon” – Frank Sinatra, 1954
What’s Next?
Economic Growth Revives…
… Thanks to Central Bank Action
Sentiment has Improved, Rotation and Dispersion Matter

The combination of tepid but improving growth, low inflation, supportive central banks and decreasing risks creates, in our opinion, a very favourable environment to maintain higher exposures to growth-related asset classes while seeking carry opportunities. However, given style rotations and correlation distortions, our preference within risky assets goes to equities and selective portions of the credit and volatility universes. In contrast, supportive central bank policies and lower recession risk pricing lead us to underweight government and inflation-related securities. Within the equity space, we still consider emerging market assets as a potential outperformer while we see current dividend growth pessimism as an opportunity, which we implement on an opportunistic basis.Asset Allocation Going Into Year End

Fly Me to The Moon

Our medium-term view is currently more constructive, as we are still overweight growth assets and underweight real assets. Given the current cost of hedging, we are using forex based strategies exposures to hedge ourselves against adverse market conditions. For the month of October, the Multi Asset Risk Targeted Strategy was flat versus a 2.7% return for the MSCI AC World Index and a -0.2% return for the Barclays Global Aggregate (USD hedged). Year-to-date, the Multi Asset Risk Targeted Strategy has returned 10.2% versus 19.4% for the MSCI AC World index, while the Barclays Global Aggregate (USD hedged) index is up 8.6%. * The Multi Asset Risk Targeted Strategy performance is shown in USD net of fees for the representative account of the Multi Asset Risk Targeted (Medium) USD Composite and reflects the deduction of advisory fees and brokerage commission and the reinvestment of all dividends and earnings. Past performance is not indicative of future performance. This information is presented as supplemental information only and complements the GIPS compliant presentation provided on the following page.Strategy Behaviour
Performance Review
Unigestion Nowcasting
World Growth Nowcaster
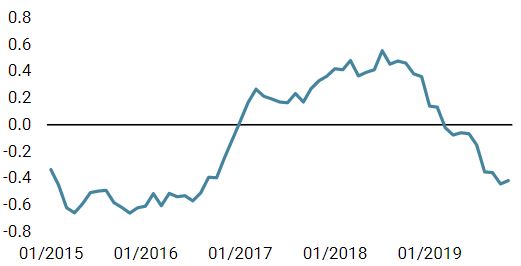
World Inflation Nowcaster
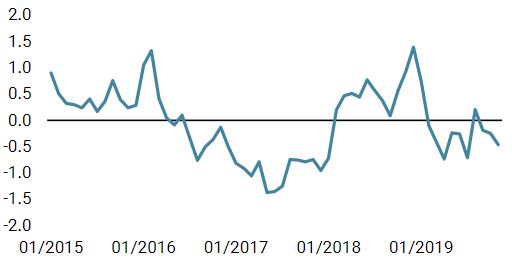
Market Stress Nowcaster
Weekly Change
- Our world Growth Nowcaster remained unchanged this week, as both emerging and developed economies showed further signs of stabilisation.
- Our world Inflation Nowcaster stabilised as its diffusion index surged to 50% levels from lows.
- Market stress decreased, driven by all its components.
Sources: Unigestion. Bloomberg, as of 04 November 2019.
Important Information
Past performance is no guide to the future, the value of investments can fall as well as rise, there is no guarantee that your initial investment will be returned. This document has been prepared for your information only and must not be distributed, published, reproduced or disclosed by recipients to any other person. This is a promotional statement of our investment philosophy and services only in relation to the subject matter of this presentation. It constitutes neither investment advice nor recommendation. This document represents no offer, solicitation or suggestion of suitability to subscribe in the investment vehicles it refers to. Please contact your professional adviser/consultant before making an investment decision. Where possible we aim to disclose the material risks pertinent to this document, and as such these should be noted on the individual document pages. Please contact Unigestion for a complete list of all the applicable risks. Some of the investment strategies described or alluded to herein may be construed as high risk and not readily realisable investments, which may experience substantial and sudden losses including total loss of investment. These are not suitable for all types of investors. To the extent that this report contains statements about the future, such statements are forward-looking and subject to a number of risks and uncertainties, including, but not limited to, the impact of competitive products, market acceptance risks and other risks. As such, forward looking statements should not be relied upon for future returns. Data and graphical information herein are for information only and may have been derived from third party sources. Unigestion takes reasonable steps to verify, but does not guarantee, the accuracy and completeness of this information. As a result, no representation or warranty, expressed or implied, is or will be made by Unigestion in this respect and no responsibility or liability is or will be accepted. All information provided here is subject to change without notice. It should only be considered current as of the date of publication without regard to the date on which you may access the information. Rates of exchange may cause the value of investments to go up or down. An investment with Unigestion, like all investments, contains risks, including total loss for the investor.
This information is issued by Unigestion (UK) Ltd (“Unigestion”), which is authorised and regulated by the UK Financial Conduct Authority (“FCA”). Unigestion is also registered as an investment adviser with the U.S. Securities and Exchange Commission (“SEC”). This information is intended only for professional clients, institutional clients and eligible counterparties, as defined by the FCA, and qualified purchasers as defined by the SEC and has therefore not been adapted to retail clients.
Unigestion Multi Asset Risk-Targeted (USD): 31 December 2014 to 30 September 2019
| Year | Composite Return Gross of Fees |
Composite Net Return | Benchmark Return | Number of Accounts | Internal Dispersion | Composite 3-Yr Std Dev | Benchmark 3-Yr Std Dev | Composite AUM (M) | Firm AUM (M) |
| 2015 | -1.61% | -2.80% | – | 1 | – | – | – | 127.24 | 15,550.31 |
| 2016 | 5.05% | 3.79% | – | 1 | – | – | – | 129.66 | 18,144.46 |
| 2017 | 11.16% | 9.82% | – | 1 | – | 4.79% | – | 169.51 | 22,340.80 |
| 2018 | -2.91% | -4.08% | – | 1 | – | 3.72% | – | 286.93 | 21,403.49 |
| 20191 | 10.70% | 9.70% | – | 1 | – | 4.43% | – | 361.96 | 20,974.34 |
1: This year is incomplete, it stops in September.
Special Disclosure: For presentations prior to 31.03.2018 the strategy was measured against the LIBOR 3M USD + 4%. Beginning April 2018 the firm determined that the benchmark did not accurately reflect the strategy mandate and the benchmark was removed. Definition of the Firm: For the purposes of applying the GIPS Standards, the firm is defined as Unigestion. Unigestion is responsible for managing assets on the behalf of institutional investors. Unigestion invests in several strategies for institutional clients: Equities, Hedge Funds, Private Assets and the solutions designed for the clients of our Cross Asset Solution department. The GIPS firm definition excludes the Fixed Income Strategy Funds, which started in January 2001 and closed in April 2008, and the accounts managed for private clients. Unigestion defines the private clients as High Net Worth Families and Individual investors. Policies: Unigestion policies for valuing portfolios, calculating performance, and preparing compliant presentations are available upon request. Composite Description: The Multi Risk Targeted (Medium) composite was defined on 15 December 2014. It consists of accounts which aim to deliver consistent smooth returns of cash + 5% gross of fees across all market conditions over a 3-year rolling period. It seeks to achieve this by capturing the upside during bull markets while protecting capital during market downturns. Benchmark: Because the composites strategy is absolute return and investments are permitted in all asset classes, no benchmark can reflect this strategy accurately. Fees: Returns are presented gross of management fees, administrative fees but net of all trading costs and withholding taxes. The maximum management fee schedule is 1.2% per annum. Net returns are net of model fees and are derived by deducting the highest applicable fee rate in effect for the respective time period from the gross returns each month. List of Composites: A list of all composite descriptions is available upon request. Minimum Account Size: The minimum account size for this composite is 5’000’000.- USD. Valuation: Valuations are computed in US dollars (USD). Performance results are reported in US dollars (USD). Internal Dispersion & 3YR Standard Deviation: The annual composite dispersion presented is an asset-weighted standard deviation calculated for the accounts in the composite the entire year. When internal dispersion is not presented it is as a result of an insufficient number of portfolios in the composite for the entire year. When the 3 Year Standard Deviation is not presented it is as a result of an insufficient period of time. Compliance Statement Unigestion claims compliance with the Global Investment Performance Standards(GIPS®) and has prepared and presented this report in compliance with the GIPS standards. Unigestion has been independently verified for the periods 1 January 2003 to 31 December 2016. The verification report(s) is/are available upon request. Verification assesses whether (1) the firm has complied with all the composite construction requirements of the GIPS standards on a firm-wide basis and(2) the firms policies and procedures are designed to calculate and present performance in compliance with the GIPS standards. Verification does not ensure the accuracy of any specific composite presentation.