Fooled by Recession Data
Key Points
-
After 18 months of economic slowdown, the first real signs of alarming macro conditions are starting to surface.
-
When looking at the origins of the slowdown and historical dynamics, we find limited risk of a worldwide recession, with a large portion of the economic deceleration reflecting a deterioration in expectations.
-
Growth remains at risk as deteriorations such as the current one rarely stop on their own. However, this time, central banks seem to be pre-empting, which is a first.
Overview
After a year and a half of economic slowdown, the first real signs of alarming macro conditions are starting to surface. Worried investors now have plenty of evidence to sustain their bearishness. Yield curves are inverted or flat, industrial surveys are at low levels and even the mighty Germany has had a quarter of negative GDP. Is a global recession already here? We do not think so.
We understand that by cherry-picking data, an analyst could make the case for a recession. However, when we look at the large cross-section of data that comprise our proprietary Growth Nowcasters, we find limited evidence that recession risk is currently high.
Having said that, China and Europe are at risk and are already flashing red in our metrics. Recession risk is very much uneven around the world and that is probably the reason why investors are puzzled by the recent data. To them we say: look at a large cross-section of macro data and screen for consistent signs of recession across economic sectors and countries.
Will we see a recession in the coming months? Hard to answer, but when looking at (1) the origin of the slowdown and (2) the historical dynamics of growth that precede situations similar to today’s, we find limited risk of a worldwide recession.
Why Investors are Worried
There are clouds gathering on the investment horizon that are usually a precursor to recession. First, as shown in Figure 1, several yield curves are now either flat or inverted. This means that for many G10 countries, the 10-year yield is either equal to or lower than the short-term yield. This implies that markets are expecting interest rates to be lower tomorrow than today. At this stage of the cycle, there is only one economic scenario that can make this possible – the economy enters into a recession.
Figure 1: Yield Curve Slopes (10-year Minus 2-year) Across G10 Countries
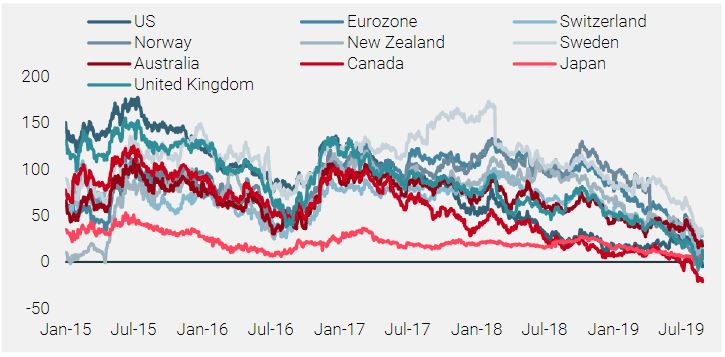
If this curve situation is on investors’ minds, it is because it also comes with a handful of other consistent signals: breakeven rates (market measures of expected inflation) have taken a plunge, the price of commodities are low, volatility curves have recently been inverted and many hedges are currently expensive, including bonds, the Japanese yen and the Swiss franc.

Macro data would suggest that a recession is imminent.

In terms of the macro picture, data here is also less than compelling. In the US, the ISM took a serious plunge and the capacity utilisation rate peaked in October 2018 and has been dropping since. In Germany, the IFO survey already places the country’s economy in a recession and this is consistent with surveys from the European Commission. Elsewhere, the growth rate in the production of Chinese electricity dropped to 2015 levels, while South Africa’s Q1 GDP was -3.2%. Finally, the CPB World Trade Index shows that global trade volumes declined by 3% over the last year. There is, it seems, no place to hide. All the signs are here and a global recession is looking increasingly likely within the next 12 months. But is this really so?
Our Take
We think this question about recession is essential to portfolio positioning, given its bearing on macroeconomic, sentiment and valuation considerations.
Our approach to measuring recession risk is based on two conclusions from our macro research:
- Recessions are hard to predict. They always come for different reasons, from the bursting of an equity bubble in 2001, the collapse of the US housing market in 2008 or excessive debt in the Eurozone in 2011.
- Asset returns are connected to the current macro situation. A prediction exercise is usually not rewarded by markets, even when getting it right. From this perspective, a nowcasting exercise makes a lot more sense.
Our Nowcasters aim at assessing the current macro situation across a set of 39 countries, including 11 significant emerging economies. In total, our indicators cover about 90% of the world’s GDP. They screen for signs of recession risk across the different key dimensions of each economy. Instead of looking at a cherry-picked set of time series, they favour the inspection of a large cross-section of data. What do these indicators have to say?
When we look at the large cross-section of data our Growth Nowcasters are comprised of, we find limited evidence that recession risk is currently high.
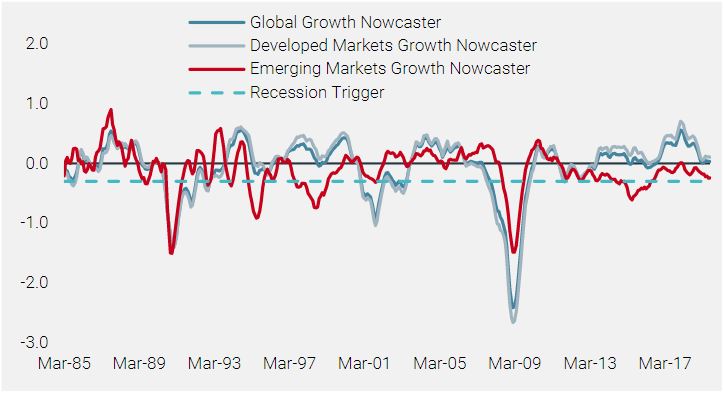
Figure 2 shows our global Growth Nowcaster, alongside its breakdown between developed and emerging countries. The blue dotted line on the chart highlights the threshold that needs to be crossed for the economy to be at risk of recession. This threshold is set at -0.3 and has been calibrated from the past 30 years of history. When the Growth Nowcaster of a country historically declines and drops below this number, it has been through either a sharp slowdown or a recession. For the moment, we have seen a decline, but not the drop. Today, the risk of being in a recession is limited, especially for developed economies.
Figure 2: Global Growth Nowcaster, 1985–2019
Recession risk is very much uneven around the world, with China and Europe most at risk.
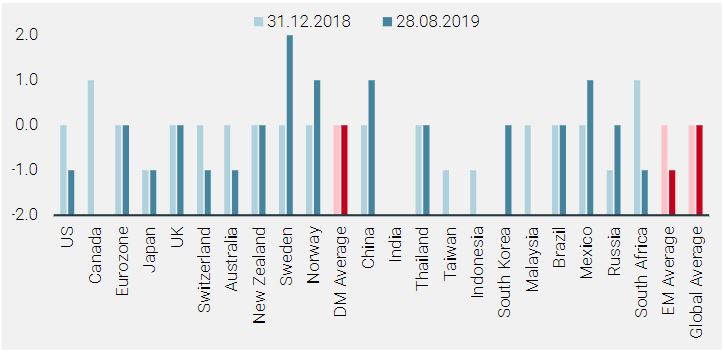
Given the geographical granularity of our indicators, we can also rank countries for their level of recession risk, from -2 (very low risk) to +2 (very high risk) based on the Growth Nowcaster and the level of its Diffusion Index (the percentage of improving data in the Nowcasters). Figure 3 shows such country-level information. As indicated by the previous graphical analysis, global recession risk is overall neutral. However, looking at a more granular level, this neutral level hides disparities: Sweden, Norway, China and Mexico are currently ranking the worst, with Sweden the most likely to currently be in a recession. Selected Asian economies, the US and Japan are getting the best grades. If no recession today, what of the medium term?
Figure 3: Recession Risk Grade Across Countries
There are two ways to try to gain knowledge on this matter. First, by looking at the origin of the current lower numbers and, secondly, by looking at what has happened historically once we have reached points similar to today’s.
The deceleration reflects a deterioration in expectations, probably tied to the trade war.
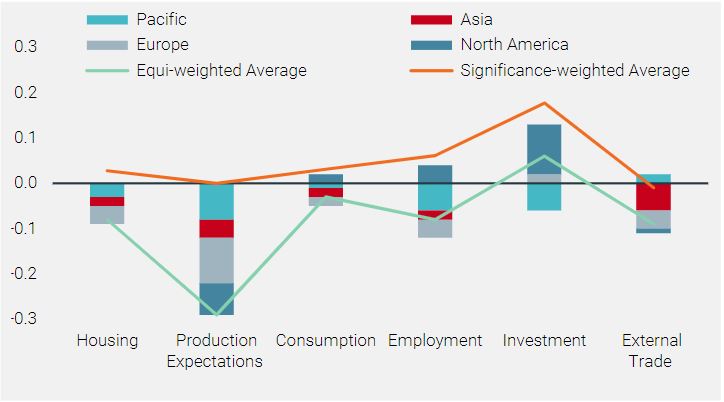
First, the origin of the slowdown. A key feature of recessions is that they consistently affect a broad range of sectors of an economy: Figure 4 shows the value of our Nowcasters per economic zone as well as their detailed breakdown by component. A large portion of the economic deceleration reflects a deterioration in expectations, probably tied to the trade war situation. Without this component, the Growth Nowcasters would stand much higher.
Figure 4: Nowcasters’ Decomposition Across the Key Sectors of Each Zone
Even with a significant deterioration in the macro situation, by historical comparisons there are very limited chances of a US recession.
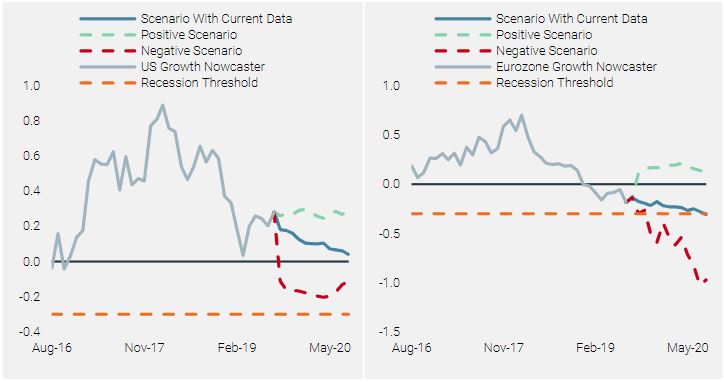
Second, we can also run regressions to assess the usual trajectory taken by an economy once we have historically reached the macro conditions that are with us today. Figure 5 shows such numbers, alongside projections obtained by assuming (1) a further significant deceleration and (2) a significant improvement in the macro momentum. When applying this scenario analysis to the US and to the Eurozone, two very different conclusions arise. First, in the US, even with a significant deterioration of the macro situation, by historical comparisons there are very limited chances of a recession occurring over the next year. However, in the case of the Eurozone the situation is very different. If the current trend continues, the Eurozone is set to enter into a recession within 12 months.
Figure 5: Historical Scenario Analysis for the US (left) and the Eurozone (right) Economies
Conclusion
These are the three key takeaways from our set of Nowcasters:
- For now, recession risk is neutral and uneven across economic zones, making the current situation incomparable to 2008 or 1990.
- There are no signs in the US of an imminent entry into recession, though the situation for the Eurozone is very different.
- Despite a limited overall risk of recession, growth remains at risk as the current deterioration has been ongoing for a year and a half, and such slowdowns rarely stop on their own. Yet, this time, central banks seem to be acting pre-emptively, which is a first.
Important Information
This document is provided to you on a confidential basis and must not be distributed, published, reproduced or disclosed, in whole or part, to any other person.
The information and data presented in this document may discuss general market activity or industry trends but is not intended to be relied upon as a forecast, research or investment advice. It is not a financial promotion and represents no offer, solicitation or recommendation of any kind, to invest in the strategies or in the investment vehicles it refers to. Some of the investment strategies described or alluded to herein may be construed as high risk and not readily realisable investments, which may experience substantial and sudden losses including total loss of investment.
The investment views, economic and market opinions or analysis expressed in this document present Unigestion’s judgement as at the date of publication without regard to the date on which you may access the information. There is no guarantee that these views and opinions expressed will be correct nor do they purport to be a complete description of the securities, markets and developments referred to in it. All information provided here is subject to change without notice. To the extent that this report contains statements about the future, such statements are forward-looking and subject to a number of risks and uncertainties, including, but not limited to, the impact of competitive products, market acceptance risks and other risks.
Data and graphical information herein are for information only and may have been derived from third party sources. Although we believe that the information obtained from public and third party sources to be reliable, we have not independently verified it and we therefore cannot guarantee its accuracy or completeness. As a result, no representation or warranty, expressed or implied, is or will be made by Unigestion in this respect and no responsibility or liability is or will be accepted. Unless otherwise stated, source is Unigestion.
Past performance is not a guide to future performance. All investments contain risks, including total loss for the investor.
Unigestion SA is regulated by the Swiss Financial Market Supervisory Authority (FINMA). Unigestion (UK) Ltd is authorised and regulated by the Financial Conduct Authority (FCA) and SEC registered. Unigestion Asset Management (France) SA is regulated by the “Autorité des Marchés Financiers” (AMF). Unigestion (Luxembourg) SA is an Alternative Investment Fund Manager authorised by the Commission de Surveillance du Secteur Financier (CSSF) under the Luxembourg law of 12 July 2013 on AIFM. Unigestion Asset Management (Canada) Inc., with offices in Toronto and Montreal, is regulated in Canada by the securities regulatory authorities in Ontario, Quebec; Alberta, Manitoba, Saskatchewan, Nova Scotia, New Brunswick and British Columbia. Its principal regulator is the Ontario Securities Commission. Unigestion Asia Pte Ltd is regulated in Singapore by the MAS, as Capital Market Services (CMS) license holder and Exempt Financial Adviser under the Securities and Futures Act and Financial Advisers Act.
Document issued September 2019