Fx Risk Premia: a cost-efficient and liquid way to hedge equity risk
Key Points
-
Alternative risk premia FX strategies deliver robust, cost-efficient protection comparable to sovereign bonds, and benefit from deep liquidity in FX markets.
-
Simulated performance on three alternative FX strategies, FX Value, FX Trend and FX Growth Hedging, clearly illustrate these defensive characteristics – and their cost efficiencies.
-
The combination of these three strategies further improves these results, performing better than a traditional bond allocation over the last five years in periods of equity market turmoil and low bond yields.
Overview
- In many of the world’s advanced economies, central banks have set policy rates close to, or below, zero. Rates have been negative for some time in many countries and central bank ammunition appears limited in light of their large balance sheets.
- Historically, sovereign bonds have helped to balance equity risk in a multi asset portfolio. However, the current context raises questions about their potential to offer similar levels of protection in the next recession and highlights the need for substitutes or complements.
- In this article, we propose an innovative FX-based strategy that investors could use to deal with this issue in their asset allocations. We show that alternative FX strategies offer significant liquidity, sustainable patterns of protection and positive carry over the medium term.
Sovereign Bonds Have Been the Perfect Asset Class …
High income with limited drawdown has forever been the quest for all investors. Historically, this quest has had a name: sovereign bonds. Supported by central bankers over the last four decades, sovereign bonds have provided high income and protection in cases of macroeconomic shock (except during periods of inflation surprise). As an illustration, the Barclays US Treasury index has posted a 7.1% annualised return since 1973 with only four negative years (1994/1999/2009/2013), and none of these below -4%. Over the same period, the S&P 500 index delivered higher returns of 11% per annum but experienced several large drawdowns, with 11 negative years, including six below -10%.
Sovereign bonds have benefited from positive factors over the last 40 years. The first phase started during the “Great Inflation” period. In the eighties, Fed president Volcker used aggressive monetary policy to fight inflation volatility, prompting a sharp fall in realised inflation. Consequently, sovereign bonds delivered regular and positive returns, similar to growth-oriented assets but with a lower volatility. The second step occurred in 2000 with the “Greenspan put”. On top of positive and regular income, the former Fed president gave a new function to sovereign bonds: protection against economic and financial turmoil. As illustrated by Figure 1, the correlation between US Treasuries and US equities turned from positive to negative from 2000 when the Fed aggressively eased its monetary policy to smooth the negative effects of financial crisis. Previously, monetary policy had been used only for fighting inflation pressures and an overheating economy.

Sovereign bonds have offered both income and protection against macroeconomic shocks that have affected other asset classes during adverse periods – particularly growth assets.

Figure 1: Correlation between US Treasuries and US Equities (3Y Rolling Correlation, Monthly Data)
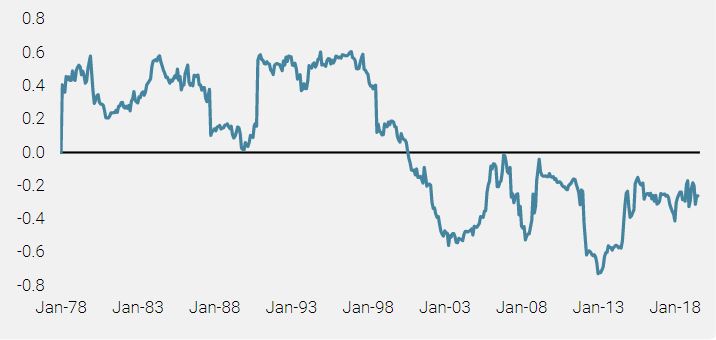
Since this period, sovereign bonds have played an important role in diversified portfolios. They have offered both income and protection against macroeconomic shocks that have affected other asset classes during adverse periods – particularly growth assets, such as equities during recessions. In fact, as the only traditional risk premia that offers high liquidity, regular income and negative beta to equity, as shown in Figure 2, it has been the ideal asset class.
Figure 2: Which Assets Offer Positive Carry and a Negative Beta to Global Equity?
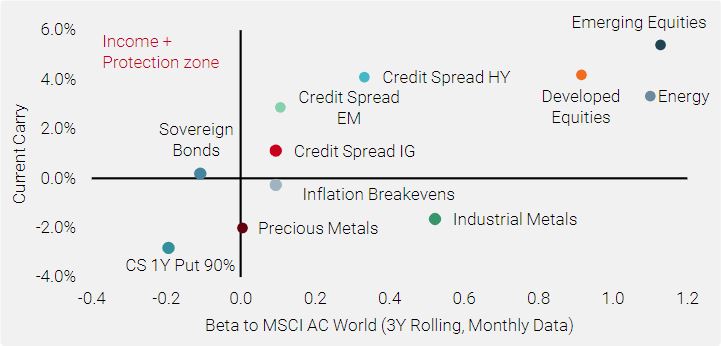
Note: Carry is the return generated by a long position in an asset if prices do not change; see Koijen et al. (2016) For bonds and credit spreads, this corresponds to the current yield spread relative to the risk-free rate plus the roll-down; for equities it is the earnings yield in excess of the risk-free rate; for inflation break-evens, it is the CPI also in excess of the risk-free rate; and finally for commodities, the roll yield between the current front-end contract and the 12 month ahead contract. CS 1Y Put 90% is Credit Suisse Index reflecting cost of hedging for 1Y OTM 90% Put.
… But Things Are Changing
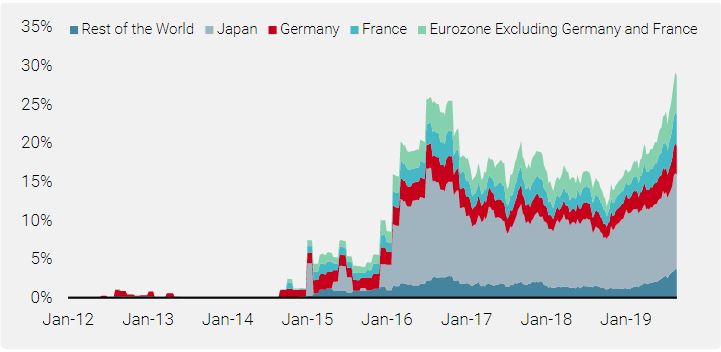
Before the Global Financial Crisis, we saw the “Global Disinflation Period” that drove asset returns between 1980 and 2000 and the “Great Moderation”, as defined by Stock and Watson, which led risk premia performance between 2000 and 2008. Since then, we have been in a “new normal” context, called “Secular Stagnation”, characterised by low sovereign bond yields globally. This situation has been deteriorating, with unconventional monetary policy implemented by most central banks. Currently, several developed countries have negative yields on the majority of their yield curve. Consequently, the proportion of sovereign bonds offering negative yields reached a new record recently, representing 30% of the Barclays Global Aggregate universe (Figure 3).
Figure 3: Proportion of Negative Bond Yields in the Barclays Global Aggregate USD Hedged Index
 Read more
This situation raises a simple question: what protection will sovereign bonds with low or negative yields offer in the next recession?
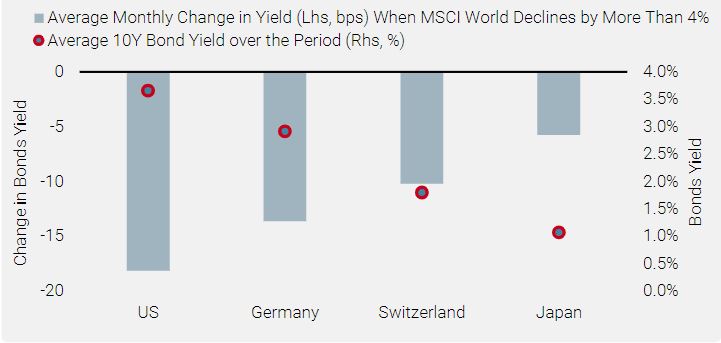
This situation raises a simple question: what protection will sovereign bonds with low or negative yields offer in the next economic downturn? The question is pertinent because a low or negative yield implies two important things. Firstly, the risk/reward of sovereign bonds declines with a fall in nominal yields because of skewness, as shown by Teiletche. The author illustrates empirically and numerically that the existence of a floor on bond yields does indeed give rise to negative asymmetry in the return distribution of government bonds when current yields are close to it. In simple terms, when bond yields cannot fall any further, they can only stabilise or rise, leaving the investor with a highly asymmetric payoff. As Figure 4 illustrates, the US 10-year bond has delivered the highest protection across developed sovereign bonds over the period (1997-2019) when global equities declined by more than one standard deviation over a month (a monthly decline of more than 4%). On average, during that period, the monthly change in bond yields has been -18 basis points (bps) for US bonds vs -13 bps for German bonds and -6 bps for Japanese bonds. Over the period, the average nominal bond yield was 3.6% for the US 10-year vs 2.9% for German, 1.8% for Swiss, and 1.1% for Japanese counterparts.
Figure 4: Change in Bond Yields When Equities Decline and Level of Nominal Bond Yield (1997–2019)
One alternative solution that provides good protection for most shocks is to go long equity volatility. However, it has substantial negative carry, and therefore cannot constitute a buy-and-hold solution (Figure 2). Similarly, “safe haven” currencies, such as the CHF or JPY, deliver robust protection relative to higher yielding emerging FX in cases of financial shock but again, the flip side is negative carry. Rather, we think that investors will have to seek income and protection separately. On the income side, carry strategies such as bonds carry, FX carry, commodity carry or volatility carry provide positive and regular income. On the protection side, we like FX strategies because they are easily implementable thanks to their high liquidity. They have delivered robust protection historically and are much less costly than long volatility strategies or standalone safe haven currencies.
On the protection side, we like FX strategies because they deliver robust protection historically and are much less costly than long volatility strategies or standalone safe haven currencies.
However, we do not believe that the solution is necessarily to avoid bond investing completely. The asset class will continue to offer negative correlation to risky assets thanks to unconventional monetary policy implemented to tackle deflation forces. Moreover, some institutional investors are being forced to reduce their equity allocation due to regulations or benchmarking. Despite record low nominal yields, sovereign bonds have been one of the best-performing asset classes of 2019 as recession fears rise. Nevertheless, we believe that the future income and protection delivered by bonds will be significantly lower.
Liquid Alternative FX Strategies Offer Good Defensive Characteristics …
Liquid alternative risk premia present compelling alternative hedging strategies. Following an intensive research programme, Unigestion has developed a broad spectrum of new sources of return designed to deliver regular and consistent returns with a lower sensitivity to the economic cycle and less market directionality. Some liquid alternative strategies present attractive defensive profiles comparable to sovereign bonds. We like using FX strategies as hedges because they offer robust defensive patterns, provide positive asymmetry and benefit from the significant liquidity offered by the currency market. We have selected three individual, alternative FX strategies.
FX Value
The concept of value investing is well known in the equity space and has been documented and used by investors for many years. This general strategy of buying undervalued assets and selling overvalued ones is also profitable in FX markets. A common method for assessing fair value in currencies relies on the Purchasing Power Parity (PPP) model, which states that exchange rates should equalise purchasing powers in different economies. Our valuation score is defined as the ratio of the current spot rate to the PPP rate: the smaller (larger) this value, the more under (over)-valued the currency is.
Unigestion has developed a broad spectrum of new sources of return designed to deliver regular and consistent returns with a lower sensitivity to the economic cycle and less market directionality.
The investment universe consists of G10 currencies quoted against the USD. The strategy is cross-sectional, taking long (short) positions in the currencies with below (above)-median scores. Final sizing will take into account proximity to the median as well as the current risk, as estimated by our Expected Shortfall risk model.
FX Trend
Trend Following is an established market anomaly where assets that have risen/fallen will continue to do so. Trending contradicts the old adage of “buy low/sell high” and the market efficiency principles where prices should mean-revert to fundamental values. Nevertheless, empirical evidence shows that an investment strategy that buys assets that have performed well and sells those that have performed poorly generates positive returns over the long run. CTAs have exploited this strategy for many years.
Although the Trend risk premia is traditionally harvested through many asset classes, for the purpose of this study, we have restricted our investment universe to G10 currencies and a set of 11 emerging market currencies all quoted against the USD (BRL, MXN, PLN, RUB, ZAR, INR, KRW, TWD, SGD, and CNH).
Trend signals are measured using an average of medium to long-term historical windows of three, six, and 12 months. We transform the signal-to-capital weights using risk budgets and current risk estimates given by our Expected Shortfall model.
FX Growth Hedging
Our FX Growth Hedging strategy is built around the two important components that investors look for to protect a portfolio (Figure 2): (1) it must have hedging properties, meaning positive performance in market downturns; and (2) a limited cost in the long run.
Taken individually, these alternative FX strategies provide positive return over the long term, high protection in market downturns and low correlations between them.
For the first component, we look for currency pairs that present:
- A strong negative correlation to equities
- A large positive asymmetry of returns between negative weeks for equities versus positive ones
- A high enough hit ratio during negative weeks for equities.
Unfortunately, currencies that best meet the above criteria tend to yield a large negative carry and therefore do not respect our second important requirement. To tackle this, we filter out pairs that have a negative carry of -1% or lower. We will therefore hold currency pairs that will not drag significantly on long-term performance while still displaying good defensive characteristics. The final portfolio equally weights the ten currencies with the largest carry.
Taken individually, these alternative FX strategies provide 1) positive returns over the long term, 2) high protection in market downturns and economic shocks, and 3) low correlations between them.
Below we present the main findings from backtests of the three strategies listed above since the beginning of 2002. In Table 1 below, we can easily see the defensive nature of these strategies: all three have long-term negative beta to the MSCI AC World index.
Table 1: Strategy Metrics (in USD)
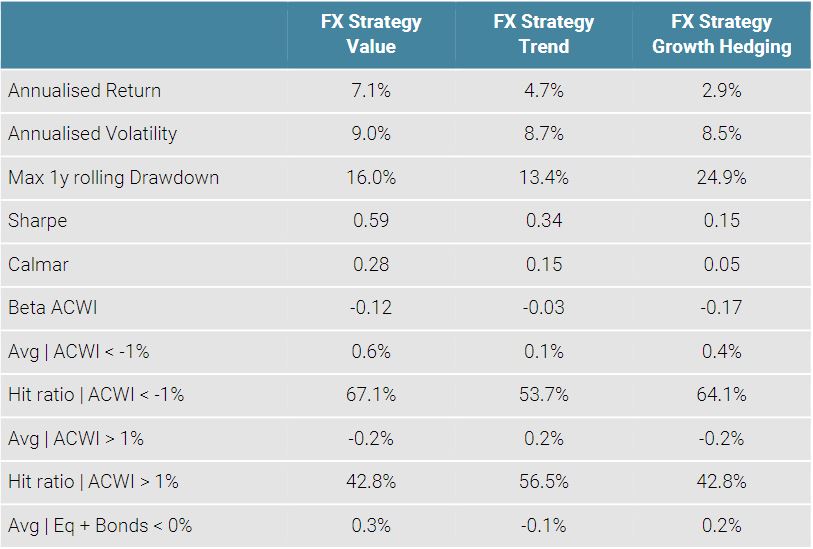
Furthermore, they delivered positive returns during the largest equity drawdowns observed over the last five years (Figure 5). They also provide hit ratios significantly above 50% in equity bear markets. However, the most important part is their asymmetrical behaviour, as the cost of holding them during upward-trending periods is very small and even positive for the Trend strategy. FX Growth Hedging is, by construction, the most defensive of the three.
Figure 5: FX Alternative Performance in Recent Equity Drawdowns
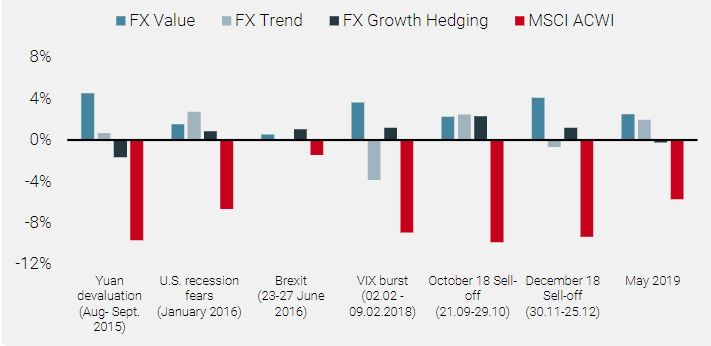
The combination of the three individual alternative FX strategies further improves the results.
… To Complement Bonds in a Diversified Portfolio
The combination of the three individual alternative FX strategies further improves the results. The combination strategy, called Defensive FX, is an equally weighted portfolio investing in the each of the three strategies. The correlation structure in Table 2 below illustrates a significant reduction in risk when combining them.
Table 2: Correlations Table
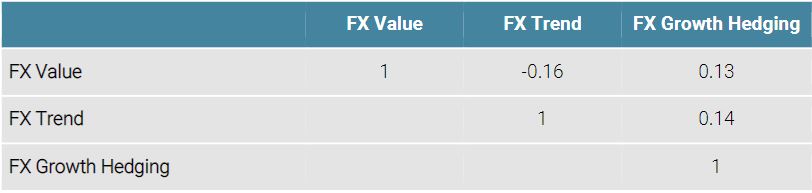
The result is a strategy with a long-term positive return and very attractive hedging properties during difficult periods for equities (Table 3 and Figure 6).
Table 3: Strategy Metrics (in USD)
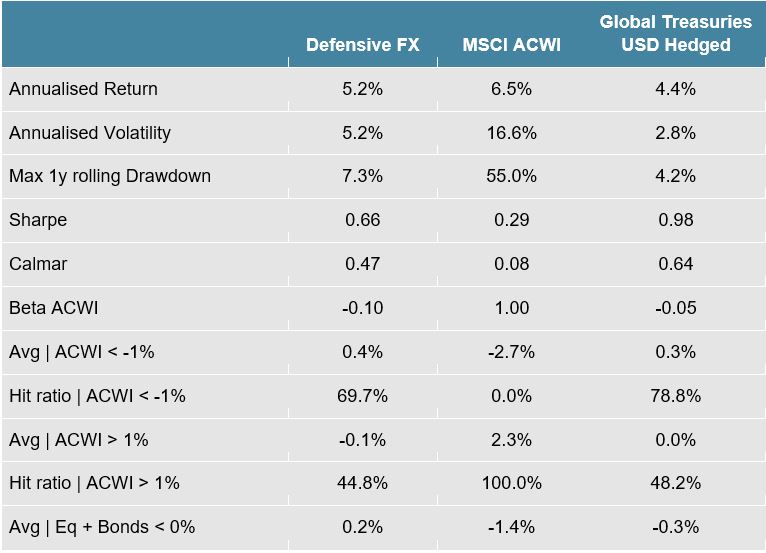
Figure 6: Defensive FX Strategy vs Sovereign Bonds and Global Equities
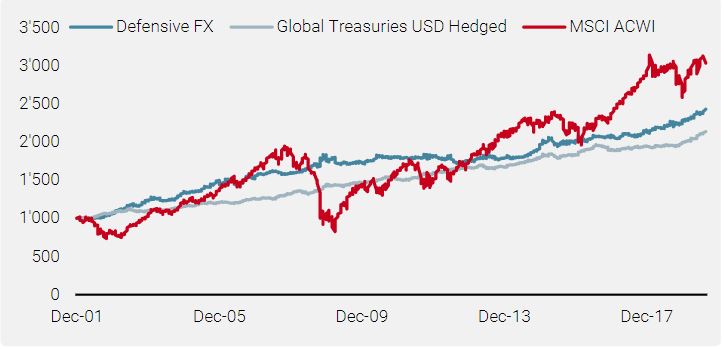
The result is a strategy with a long-term positive return and very attractive hedging properties during difficult periods for equities.
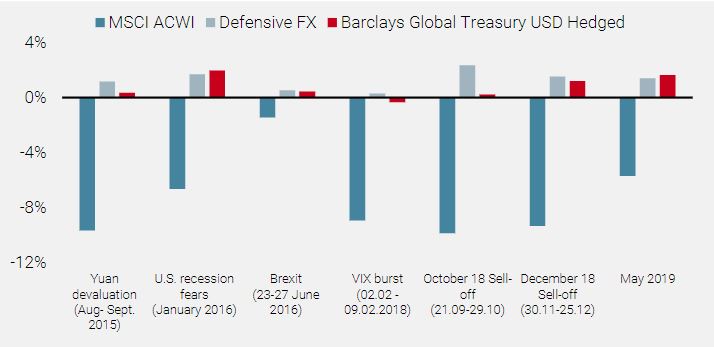
It performed better in periods of equity market turmoil over the last five years than a traditional bond allocation as global bond yields declined (Figure 7).
Figure 7: Defensive FX Strategy vs Sovereign Bonds in Recent Equity Market Turmoil
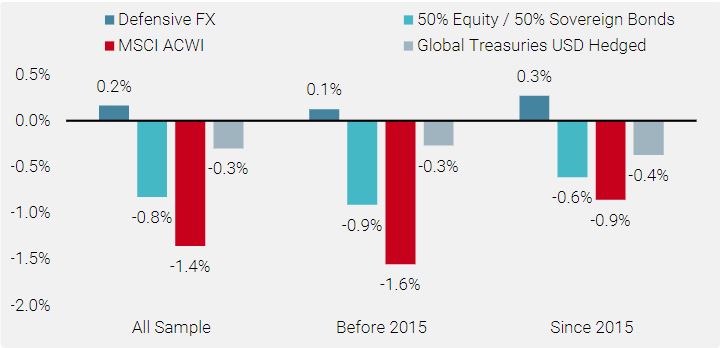
Finally, Table 4 shows how our Defensive FX strategy offers improved protection relative to a traditional balanced portfolio of 50% global equity/50% global sovereign bonds, with a lower drawdown and volatility. More importantly, that improvement is more significant in a low bond yield context (see Figure 8).
Table 4: Replacing Sovereign Bonds by Our Defensive FX Strategy in a Balanced Portfolio (in USD)
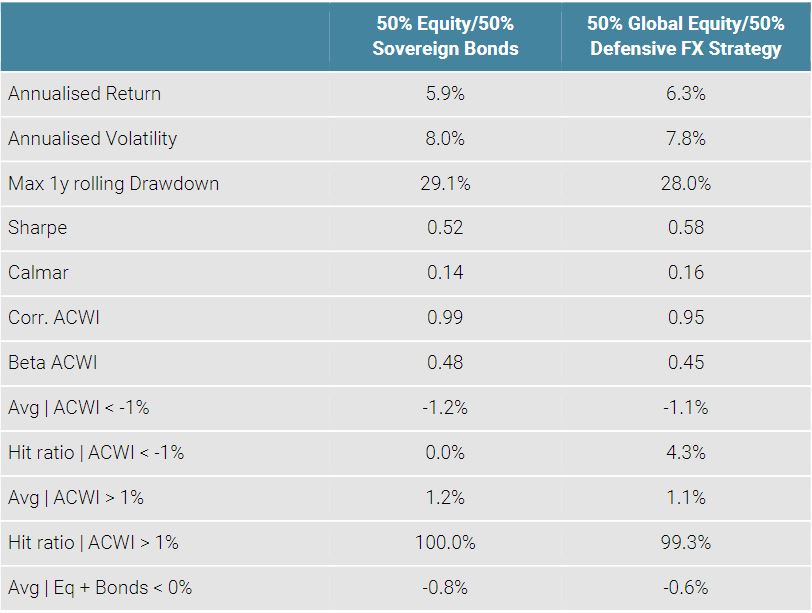
Figure 8: Defensive FX Strategy when Global Equities and Global Bonds are Down
Effective Hedging in a Negative Yielding Environment Requires Preparation and Innovation
The current context has become very challenging for multi asset solutions while sovereign bond yields are either close to zero or negative. We are convinced that to deliver smooth and consistent returns, asset managers need to adapt their thinking on portfolio construction and expand their investment universe to include new liquid alternative strategies.
Combining FX factor strategies allows investors to lower duration exposure without decreasing the level of protection.
Currency markets present an attractive opportunity to design defensive strategies thanks to their deep liquidity. Combining factor investing strategies such as “value” and “trend following” as applied to FX, with a growth hedging FX strategy, allows investors to lower duration exposure without decreasing the level of protection. It also expands the range of hedging solutions in a long-only equity context beyond optional strategies or tactical overlays.
References
[1] Michael Bryan, Federal Reserve Bank of Atlanta, https://www.federalreservehistory.org/essays/great_inflation
[2] Ralph Koijen, Tobias Moskowitz, Lasse Heje Pedersen, and Evert Vrugt, “Carry” (2016)
[3] James Stocks and Mark Watson, “Has the Business Cycle changed and Why?”, NBER paper (2002)
[4] Jérôme Teiletche, “The risky asymmetry of low bond yields”, Unigestion Perspective Paper (2015)
[5] Triennial Central Bank Survey of Foreign Exchange and Over-the-counter (OTC) Derivatives Markets in 2019, BIS 2019
Important Information
Past performance is no guide to the future, the value of investments, and the income from them change frequently, may fall as well as rise, there is no guarantee that your initial investment will be returned. This document has been prepared for your information only and must not be distributed, published, reproduced or disclosed by recipients to any other person. It is neither directed to, nor intended for distribution or use by, any person or entity who is a citizen or resident of, or domiciled or located in, any locality, state, country or jurisdiction where such distribution, publication, availability or use would be contrary to law or regulation. This is a promotional statement of our investment philosophy and services only in relation to the subject matter of this presentation. It constitutes neither investment advice nor recommendation. This document represents no offer, solicitation or suggestion of suitability to subscribe in the investment vehicles to which it refers. Any such offer to sell or solicitation of an offer to purchase shall be made only by formal offering documents, which include, among others, a confidential offering memorandum, limited partnership agreement (if applicable), investment management agreement (if applicable), operating agreement (if applicable), and related subscription documents (if applicable). Please contact your professional adviser/consultant before making an investment decision.
Where possible we aim to disclose the material risks pertinent to this document, and as such these should be noted on the individual document pages. The views expressed in this document do not purport to be a complete description of the securities, markets and developments referred to in it. Reference to specific securities should not be considered a recommendation to buy or sell. Investors shall conduct their own analysis of the risks (including any legal, regulatory, tax or other consequences) associated with an investment and should seek independent professional advice. Some of the investment strategies described or alluded to herein may be construed as high risk and not readily realisable investments, which may experience substantial and sudden losses including total loss of investment. These are not suitable for all types of investors.
To the extent that this report contains statements about the future, such statements are forward-looking and subject to a number of risks and uncertainties, including, but not limited to, the impact of competitive products, market acceptance risks and other risks. Actual results could differ materially from those in the forward-looking statements. As such, forward looking statements should not be relied upon for future returns. Targeted returns reflect subjective determinations by Unigestion based on a variety of factors, including, among others, internal modeling, investment strategy, prior performance of similar products (if any), volatility measures, risk tolerance and market conditions. Targeted returns are not intended to be actual performance and should not be relied upon as an indication of actual or future performance.
Data and graphical information herein are for information only and may have been derived from third party sources. Unigestion takes reasonable steps to verify, but does not guarantee, the accuracy and completeness of this information. As a result, no representation or warranty, expressed or implied, is or will be made by Unigestion in this respect and no responsibility or liability is or will be accepted. All information provided here is subject to change without notice. It should only be considered current as of the date of publication without regard to the date on which you may access the information. Rates of exchange may cause the value of investments to go up or down. An investment with Unigestion, like all investments, contains risks, including total loss for the investor.
Backtested or simulated performance is not an indicator of future actual results. The results reflect performance of a strategy not currently offered to any investor and do not represent returns that any investor actually attained. Backtested results are calculated by the retroactive application of a model constructed on the basis of historical data and based on assumptions integral to the model which may or may not be testable and are subject to losses.
Data set used for backtested simulations is all in USD, gross of management fees from 12/2001 – 08/2019 in weekly data. Carry is estimated as the 3 month risk-free rate per currency minus 3 month USD Libor. All signals and risk estimates use proprietary models.
Changes in these assumptions may have a material impact on the backtested returns presented. Certain assumptions have been made for modeling purposes and are unlikely to be realized. No representations and warranties are made as to the reasonableness of the assumptions. This information is provided for illustrative purposes only. Backtested performance is developed with the benefit of hindsight and has inherent limitations. Specifically, backtested results do not reflect actual trading or the effect of material economic and market factors on the decision-making process. Since trades have not actually been executed, results may have under- or over-compensated for the impact, if any, of certain market factors, such as lack of liquidity, and may not reflect the impact that certain economic or market factors may have had on the decision-making process. Further, backtesting allows the security selection methodology to be adjusted until past returns are maximized. Actual performance may differ significantly from backtested performance.
Unigestion SA is authorised and regulated by the Swiss Financial Market Supervisory Authority (FINMA). Unigestion (UK) Ltd. is authorised and regulated by the UK Financial Conduct Authority (FCA) and is registered with the Securities and Exchange Commission (SEC). Unigestion Asset Management (France) S.A. is authorised and regulated by the French “Autorité des Marchés Financiers” (AMF). Unigestion Asset Management (Canada) Inc., with offices in Toronto and Montreal, is registered as a portfolio manager and/or exempt market dealer in nine provinces across Canada and also as an investment fund manager in Ontario and Quebec. Its principal regulator is the Ontario Securities Commission (OSC). Unigestion Asia Pte Limited is authorised and regulated by the Monetary Authority of Singapore (MAS). Unigestion Asset Management (Copenhagen) is co-regulated by the “Autorité des Marchés Financiers” (AMF) and the “ Danish Financial Supervisory Authority” (DFSA). Unigestion Asset Management (Düsseldorf) SA is co-regulated by the “Autorité des Marchés Financiers” (AMF) and the “Bundesanstalt für Finanzdienstleistungsaufsicht” (BAFIN).