Gold surged higher last week and eclipsed the USD 2,000/oz. level, firmly establishing its new all-time high. The precious metal has benefitted from several tailwinds, some of which we expect to continue while others are likely to stabilise or even reverse. The longer-term factors – expansive monetary policy, negative real rates, and solid demand from price-insensitive players – are all supportive for gold and likely to continue. However, shorter-term factors, such as record inflows, strong momentum, and substitution, suggest a more nuanced view. Until the short-term factors fade behind us, we maintain a more neutral exposure to gold within our portfolios.

Shiny

For almost two months now, our Nowcasters have pointed to a rather benign environment for financial assets: global recession risk and inflation risk have hovered around neutral, while the risk of a market stress episode has been low. Such an environment would typically be a rather poor one for gold: many investors view gold as a contra-currency and storehold of wealth, and flock to it when fears of inflation or crisis arise. Indeed, our analysis of the performance of gold in such a macro environment provides empirical support to this economic intuition and points towards a negative view on the precious metal. At the same time, the valuation of gold looks expensive: the futures curve is in deeper-than-usual contango, with prices of further-dated futures contracts bid more than shorter-dated ones, making a long positon in gold futures more expensive relative to its own history. Gold also remains expensive from a cross-asset perspective, pushing the net view from our systematic investment process to be bearish. However, there are some key supports to gold that have overwhelmed these negative factors and are unlikely to reverse in the near-term. Foremost among these is the coordination of fiscal and monetary policy to fight off the coronavirus-induced economic contraction, especially in the US. As we have communicated previously, the amount of fiscal stimulation is massive and financed largely by issuing debt. However, central bank purchases have kept nominal yields from rising, helping to ensure governments can borrow at low rates and incentivising investors to allocate to higher yielding and riskier assets. At the same time, inflation expectations have recovered strongly and are back near pre-crisis levels. The net impact of these forces has been declining and negative real rates. For example, the US 2-year real rate has collapsed by 250bps since late March. The expansionary policy of the Fed, combined with an acceleration of cases in the US versus other developed countries and China, has put downward pressure on the US dollar. With gold typically quoted in US dollars, negative US real rates and a falling greenback have a significant impact on the price of gold, which becomes even more attractive as a storehold of wealth when cash, treasury bills, and bonds are all offering negative real yields. And unlike nominal yields that have a lower bound (though not necessarily zero, as the Eurozone experience has shown), real yields can move significantly negative. It is clear to us that the Fed and other central banks will not be concerned by an inflation overshoot any time soon and will likely tolerate inflation much above their targets if the economy is still in need of recovery. Thus, while inflation expectations have recovered to pre-crisis levels, there remains ample room for them to move higher, while nominal yields will remain anchored by central banks, potentially leading real rates to fall further and supporting another leg in the gold rally. Monetary policy is just one part of gold’s recent surge: physical supply and demand have also been critical. Not surprisingly, supply has been flat while consumer demand for gold has fallen due to lower economic activity. According to data from the World Gold Council, demand for gold jewellery in Q2 2020 fell by 53% y-o-y (in mass terms) while demand from technology (including electronics, industrial uses, and dentistry) fell by 18% y-o-y. Overall demand fell by 11%, and while central banks and other supranational organisations (IMF, BIS, etc.) have slowed down their purchases, they remain one of the largest sources of gold demand and are largely price-insensitive. Indeed, data from the IMF covering up to Q1 2020 confirms that these organisations have been increasing their gold holdings almost non-stop since 2009. Given their slow-moving nature, it is reasonable to assume this demand driver will continue to be supportive for some time. One key source of demand has seen explosive growth recently. Demand from ETFs and other investment products have surged 470% y-o-y, becoming the largest contributor of gold demand. This is reflective of a feedback loop: as gold prices start to rise and investors pile into gold ETFs, the product managers must purchase physical bullion to back the certificates they are issuing, putting further upward pressure on gold prices. This year has already seen the largest flows into gold ETFs since at least 2003: USD 49bn or about 900 tonnes of gold have flowed into these products year to date. To put that number in context, the previous record year was 2009 when USD 19bn or 646 tonnes of gold flowed into such products. However, with any feedback loop, the unwind can get ugly: if gold falls out of investor favour and gold ETFs see large outflows, the downward pressure on prices will be massive and reinforce a collapse in much the same way it did the rise. The unwind of long positioning and subsequent outflows from gold ETFs (and futures to a lesser extent) is just one of the risks on the short-term horizon. Momentum indicators also suggest gold is overbought at this point: its 14-day RSI has hovered around 80 for the last two weeks, as the price surged 12%. This is in stark contrast to the 12% rally from the end of March to mid-July, when the RSI stayed in the 40-70 range and pointed to positive technicals. At the same time that gold looks to be overbought, the US dollar looks to be oversold, with the 14-day RSI of the DXY index hovering in the 20-30 range over the last two weeks. A resurgence in the US dollar, potentially driven by the pick-up in tension with China, would add downward pressure to gold. Investors are also re-assessing what other assets could offer gold’s properties at a lower cost. While much attention has been paid to gold breaking the USD 2,000 level, its 14% rise since the end of June pales in comparison to the 54% rise in silver over the same time. Indeed, the gold/silver ratio is back down to 72, a level last seen in early 2017, after peaking at 124 in mid-March, but remains above its long-term average of 59. These short-term headwinds have led to our discretionary view moving less bullish, as we take profits on our long gold exposure (as well as our pro-growth exposures, as mentioned last week). Netting this with the bearish view from our systematic process leads us to a more neutral exposure to gold, which we think appropriate until we see some improvement in the short-term technical factors. Such an improvement would then motivate us to re-introduce a bullish view as the longer-term drivers, in particular monetary policy and supply/demand dynamics, remain favourable for the precious metal.What’s Next?
Our systematic indicators do not favour gold
Monetary policy has been and will likely remain supportive
Supply and demand have reinforced the rally so far
Technicals and short-term factors are not favourable at this point
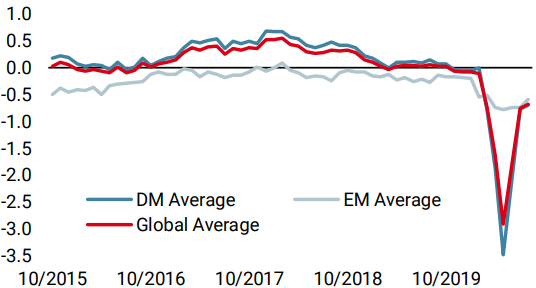
Unigestion Nowcasting
World Growth Nowcaster
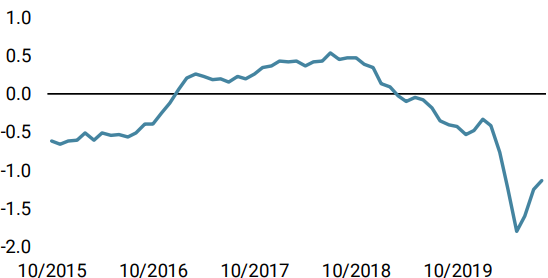
World Inflation Nowcaster
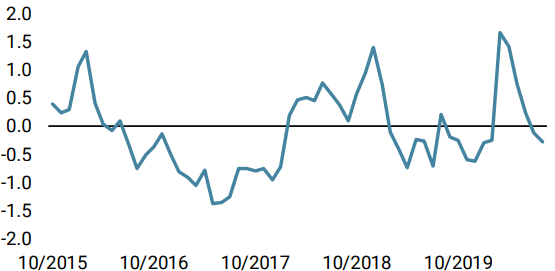
Market Stress Nowcaster
Weekly Change
- Our world Growth Nowcaster was up again over the week, as the broad improvement in the macro economy continues.
- Our world Inflation Nowcaster increased last week, as increasing inflation pressures worldwide took momentum.
- Our Market Stress Nowcaster decreased last week: market stress risk is now very low.
Sources: Unigestion. Bloomberg, as of 10 August 2020.
Important Information
This document is provided to you on a confidential basis and must not be distributed, published, reproduced or disclosed, in whole or part, to any other person.
The information and data presented in this document may discuss general market activity or industry trends but is not intended to be relied upon as a forecast, research or investment advice. It is not a financial promotion and represents no offer, solicitation or recommendation of any kind, to invest in the strategies or in the investment vehicles it refers to. Some of the investment strategies described or alluded to herein may be construed as high risk and not readily realisable investments, which may experience substantial and sudden losses including total loss of investment.
The investment views, economic and market opinions or analysis expressed in this document present Unigestion’s judgement as at the date of publication without regard to the date on which you may access the information. There is no guarantee that these views and opinions expressed will be correct nor do they purport to be a complete description of the securities, markets and developments referred to in it. All information provided here is subject to change without notice. To the extent that this report contains statements about the future, such statements are forward-looking and subject to a number of risks and uncertainties, including, but not limited to, the impact of competitive products, market acceptance risks and other risks.
Data and graphical information herein are for information only and may have been derived from third party sources. Although we believe that the information obtained from public and third party sources to be reliable, we have not independently verified it and we therefore cannot guarantee its accuracy or completeness. As a result, no representation or warranty, expressed or implied, is or will be made by Unigestion in this respect and no responsibility or liability is or will be accepted. Unless otherwise stated, source is Unigestion. Past performance is not a guide to future performance. All investments contain risks, including total loss for the investor.
Unigestion SA is authorised and regulated by the Swiss Financial Market Supervisory Authority (FINMA). Unigestion (UK) Ltd. is authorised and regulated by the UK Financial Conduct Authority (FCA) and is registered with the Securities and Exchange Commission (SEC). Unigestion Asset Management (France) S.A. is authorised and regulated by the French “Autorité des Marchés Financiers” (AMF). Unigestion Asset Management (Canada) Inc., with offices in Toronto and Montreal, is registered as a portfolio manager and/or exempt market dealer in nine provinces across Canada and also as an investment fund manager in Ontario and Quebec. Its principal regulator is the Ontario Securities Commission (OSC). Unigestion Asia Pte Limited is authorised and regulated by the Monetary Authority of Singapore (MAS). Unigestion Asset Management (Copenhagen) is co-regulated by the “Autorité des Marchés Financiers” (AMF) and the “Danish Financial Supervisory Authority” (DFSA). Unigestion Asset Management (Düsseldorf) SA is co-regulated by the “Autorité des Marchés Financiers” (AMF) and the “Bundesanstalt für Finanzdienstleistungsaufsicht” (BAFIN).