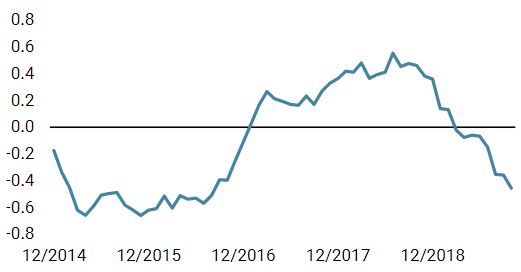
The Eurozone has been a source of concern to us for 20 consecutive months in light of alarming signs of broad-based deceleration. A lack of clear governance made Europe, and more particularly the Eurozone, the weakest link in the investment world, in our view. But things seem to be changing. We see (very) early signs of macro stabilisation and consumption growth looks firm. We also see too much pessimism in markets as these first signs of improvement surface. With the ECB’s new President pushing for more fiscal spending, an extremely low euro and a lower exposure to the trade war, we think European growth assets could become more appealing. We need to strengthen our faith here a little more, but we have already started reducing our defensive positioning. We have been worried about the European situation for almost two years now. Our European Growth Nowcaster reached a peak in January 2018, just like it did for the rest of the developed world. However, unlike the rest of the world, it has collapsed since then. The indicator was at 0.67 in January 2018, where zero represents growth in line with potential. From this extreme level, the fall has been sharp: by March this year, the indicator had plunged to -0.19, very close to our -0.3 recession threshold and indicative of growth being below potential. Historically, when an economy reaches that threshold, its GDP has typically started to contract: Canada and South Africa are recent examples. The Eurozone managed to remain above this threshold but this -0.19 level is concerning. Our Growth Nowcaster has only been lower 30% of the time: a clear sign of growth being at risk. Moreover, the fall was not just sharp, it was also broad-based, unlike other developed economies. Since February 2018, on average, across the 41 data series used to create our Eurozone Growth Nowcaster incorporating seven economic dimensions (such as consumption, production expectations, housing or investment), 65% of them were declining. In March 2018, this number increased to 81%, with its 30-year historical maximum at 90%. Little wonder we started feeling nervous about the European economy, with 2011 still fresh in our minds. There are early signs that things are finally stabilising, an unexpected but welcome breather after almost two years of economic slowdown. Four key elements are potentially turning this very bearish story into something more positive:“Got to Have Faith” – Europe, 2004
What’s Next?
Heading Towards 2011?
Macro: A New Hope

The final element we are seeing is excess pessimism across markets, which has caused hedging assets to become extremely expensive. This is even more the case for European assets.Sentiment/Valuation: Bearish Sentiment Overly Priced
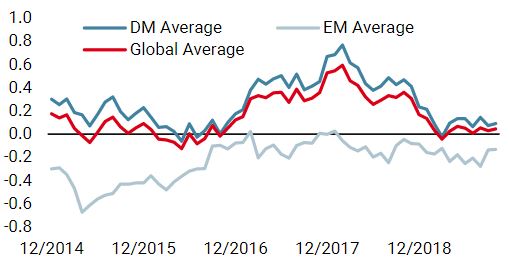
Sentiment is negative now that markets have recovered from their Q4 2018 collapse, driving people to take profits and to hedge themselves. The equity skew is currently as high as in January 2018: a clear sign that investors are seeking protection. Also, portfolio positioning in European equities has steadily decreased, as shown when studying the beta of multi asset portfolios to US and European stocks. If investors only recently decreased their holdings in US stocks (basically since July 2019), they gave up on European equities in January 2018 and have steadily reduced their investments there since then (as measured from the beta of a pool of multi asset funds to the S&P 500 and to the Eurostoxx index).
We see this situation as more of an issue among regional equities where valuations look uneven. According to our estimates covering a large spectrum of valuation metrics such as price-to-book, earnings yield or sales-to-book ratios, there is now a large difference between the very expensive US stocks (above their 80th historical percentile) and the very cheap Japanese and emerging stocks (30th percentile).
Interestingly, European stocks are sitting in a higher range without being as expensive as US stocks (70th percentile). Historically (1990-2018), when they reached these values in terms of expensiveness, European stocks delivered a positive performance in the following three to six months. In addition, most of the metrics we use are based on forward-looking earnings/sales, which are currently very pessimistic for European stocks. Should these numbers improve in the upcoming earning season, these valuations could actually be even lower than where they stand today.
In our opinion, the case for European assets is still early, and we have only lightened our bearishness on them for now, gaining an exposure to global equities rather than regional ones. However, European equities contain a larger portion of value stocks and a macro bottoming in Europe could ignite a value rally that could help European stocks to outperform. If the macro situation does improve, this could become an interesting investment theme to add to our constructive positioning in growth assets.

Got to Have Faith

Our medium-term view is currently more constructive, as we are still overweight growth assets and underweight real assets. Given the current cost of hedging, we are using forex-based strategies exposures to hedge ourselves against adverse market conditions. Over the month of October to date, the Multi Asset Risk Targeted Strategy lost -0.63% versus 0.14% for the MSCI AC World index and -0.46% for the Barclays Global Aggregate (USD hedged). Year-to-date, the Multi Asset Risk Targeted Strategy has returned 9.51% versus 16.36% for the MSCI AC World index, while the Barclays Global Aggregate (USD hedged) index is up 8.26%. * The Multi Asset Risk Targeted Strategy performance is shown in USD net of fees for the representative account of the Multi Asset Risk Targeted (Medium) USD Composite and reflects the deduction of advisory fees and brokerage commission and the reinvestment of all dividends and earnings. Past performance is not indicative of future performance. This information is presented as supplemental information only and complements the GIPS compliant presentation provided on the following page.Strategy Behaviour
Performance Review
Unigestion Nowcasting
World Growth Nowcaster
World Inflation Nowcaster
Market Stress Nowcaster
Weekly Change
- Our world Growth Nowcaster increased last week, particularly in developed countries.
- Our world Inflation Nowcaster fell again last week, particularly in the US and the Eurozone.
- Market stress decreased after a more volatile period.
Sources: Unigestion. Bloomberg, as of 14 October 2019.
Important Information
Past performance is no guide to the future, the value of investments can fall as well as rise, there is no guarantee that your initial investment will be returned. This document has been prepared for your information only and must not be distributed, published, reproduced or disclosed by recipients to any other person. This is a promotional statement of our investment philosophy and services only in relation to the subject matter of this presentation. It constitutes neither investment advice nor recommendation. This document represents no offer, solicitation or suggestion of suitability to subscribe in the investment vehicles it refers to. Please contact your professional adviser/consultant before making an investment decision. Where possible we aim to disclose the material risks pertinent to this document, and as such these should be noted on the individual document pages. Please contact Unigestion for a complete list of all the applicable risks. Some of the investment strategies described or alluded to herein may be construed as high risk and not readily realisable investments, which may experience substantial and sudden losses including total loss of investment. These are not suitable for all types of investors. To the extent that this report contains statements about the future, such statements are forward-looking and subject to a number of risks and uncertainties, including, but not limited to, the impact of competitive products, market acceptance risks and other risks. As such, forward looking statements should not be relied upon for future returns. Data and graphical information herein are for information only and may have been derived from third party sources. Unigestion takes reasonable steps to verify, but does not guarantee, the accuracy and completeness of this information. As a result, no representation or warranty, expressed or implied, is or will be made by Unigestion in this respect and no responsibility or liability is or will be accepted. All information provided here is subject to change without notice. It should only be considered current as of the date of publication without regard to the date on which you may access the information. Rates of exchange may cause the value of investments to go up or down. An investment with Unigestion, like all investments, contains risks, including total loss for the investor.
This information is issued by Unigestion (UK) Ltd (“Unigestion”), which is authorised and regulated by the UK Financial Conduct Authority (“FCA”). Unigestion is also registered as an investment adviser with the U.S. Securities and Exchange Commission (“SEC”). This information is intended only for professional clients, institutional clients and eligible counterparties, as defined by the FCA, and qualified purchasers as defined by the SEC and has therefore not been adapted to retail clients.
Unigestion Multi Asset Risk-Targeted (USD): 31 December 2014 to 30 June 2019
| Year | Composite Return Gross of Fees |
Composite Net Return | Benchmark Return | Number of Accounts | Internal Dispersion | Composite 3-Yr Std Dev | Benchmark 3-Yr Std Dev | Composite AUM (M) | Firm AUM (M) |
| 2015 | -1.61% | -2.80% | – | 1 | – | – | – | 127.24 | 15,550.31 |
| 2016 | 5.05% | 3.79% | – | 1 | – | – | – | 129.66 | 18,144.46 |
| 2017 | 11.16% | 9.82% | – | 1 | – | – | – | 169.51 | 22,340.80 |
| 2018 | -2.91% | -4.08% | – | 1 | – | – | – | 286.93 | 21,403.49 |
| 20191 | 7.45% | 6.80% | – | 1 | – | – | – | 364.46 | 21,692.55 |
1: This year is incomplete, it stops in June.
Special Disclosure: For presentations prior to 31.03.2018 the strategy was measured against the LIBOR 3M USD + 4%. Beginning April 2018 the firm determined that the benchmark did not accurately reflect the strategy mandate and the benchmark was removed. Definition of the Firm: For the purposes of applying the GIPS Standards, the firm is defined as Unigestion. Unigestion is responsible for managing assets on the behalf of institutional investors. Unigestion invests in several strategies for institutional clients: Equities, Hedge Funds, Private Assets and the solutions designed for the clients of our Cross Asset Solution department. The GIPS firm definition excludes the Fixed Income Strategy Funds, which started in January 2001 and closed in April 2008, and the accounts managed for private clients. Unigestion defines the private clients as High Net Worth Families and Individual investors. Policies: Unigestion policies for valuing portfolios, calculating performance, and preparing compliant presentations are available upon request. Composite Description: The Multi Risk Targeted (Medium) composite was defined on 15 December 2014. It consists of accounts which aim to deliver consistent smooth returns of cash + 5% gross of fees across all market conditions over a 3-year rolling period. It seeks to achieve this by capturing the upside during bull markets while protecting capital during market downturns. Benchmark: Because the composites strategy is absolute return and investments are permitted in all asset classes, no benchmark can reflect this strategy accurately. Fees: Returns are presented gross of management fees, administrative fees but net of all trading costs and withholding taxes. The maximum management fee schedule is 1.2% per annum. Net returns are net of model fees and are derived by deducting the highest applicable fee rate in effect for the respective time period from the gross returns each month. List of Composites: A list of all composite descriptions is available upon request. Minimum Account Size: The minimum account size for this composite is 5’000’000.- USD. Valuation: Valuations are computed in US dollars (USD). Performance results are reported in US dollars (USD). Internal Dispersion & 3YR Standard Deviation: The annual composite dispersion presented is an asset-weighted standard deviation calculated for the accounts in the composite the entire year. When internal dispersion is not presented it is as a result of an insufficient number of portfolios in the composite for the entire year. When the 3 Year Standard Deviation is not presented it is as a result of an insufficient period of time. Compliance Statement Unigestion claims compliance with the Global Investment Performance Standards(GIPS®) and has prepared and presented this report in compliance with the GIPS standards. Unigestion has been independently verified for the periods 1 January 2003 to 31 December 2016. The verification report(s) is/are available upon request. Verification assesses whether (1) the firm has complied with all the composite construction requirements of the GIPS standards on a firm-wide basis and(2) the firms policies and procedures are designed to calculate and present performance in compliance with the GIPS standards. Verification does not ensure the accuracy of any specific composite presentation.