The last three US recessions were not caused by inflation but rather by the bursting of asset bubbles driven by the Fed’s own easy-money policies. They occurred after economic growth and inflation had remained positive (though subdued) for extended periods. As a direct result of low interest rates and unconventional monetary policy, investors were forced out on the risk curve, scrambling for yields. European high yield corporate bonds, aka junk bonds, which traded at an effective yield of 26% in December 2008, collapsed to a low of 2% in October 2017. This is one of the most incredible central bank induced distortions of all time. Has the corporate bond market become “hooked on junk” again? The corporate bond market has boomed, tripling in size from the peak of the prior cycle in 2007. During that period, the corporate bond ETF market has expanded by over ten times. As with the structured mortgage products in 2008, investors seem to be complacent about the debt products they (are forced to) own. In 2007, the lie was that you could take a bunch of low-quality loans, package them together and somehow get a AAA-rated bond. This time, the lie is that you can take a bunch of bonds that trade by appointment, lump them together in an ETF, and magically make them liquid. Investors are desperate for yield and US companies are happy to tap this additional source of cheap money to lever up for stock buybacks, dividends and M&A, given the investor appetite for such financial engineering. The result is that US equity markets trade close to all–time highs while corporate balance sheets deteriorate. Of particular concern is the BBB-rated corporate debt market. It is considered “investment grade,” but it sits on the lowest rung of the ladder. When BBB debt gets downgraded just one notch by ratings agencies to BB, it becomes a “fallen angel” and is reclassified from investment grade to high yield. Importantly, at that point, many institutions, including endowments, pension funds and certain bond funds, are typically handcuffed with legal and/or self-imposed limits based on credit quality and must sell these holdings. Many investors still believe the investment grade corporate bond market to be the safest slice of their portfolio pie, but they should treat the BBB portion of the bond market for what it is: a medium to high-risk slice of the corporate debt pie. At the peak of the last cycle in 2007, the total investment grade market was USD 1.7 trillion, and BBB-rated debt accounted for under 25% of the total. Since then, we have experienced the second longest economic expansion on record in the United States. The investment grade market has ballooned to over USD 5 trn, with BBB-rated debt accounting for over 50% of the total. If half of the BBB-rated bonds were to be downgraded, it would entail a shift of USD 1.3 trn bonds to junk status. To put that into perspective, the entire junk market today is less than USD 1.25 trn, and the subprime mortgage market that caused so many problems in 2008 peaked at USD 1.3 trn.“Hooked on Junk” – k.d. lang, 1984
What’s Next?
Too much money chasing too few deals
Credit cycles do not die of age and leverage alone …
… but the past suggests danger is on the way
Years of balance sheet re-leveraging and, in some cases, lingering structural challenges have greatly diminished the ability of many corporations to withstand negative growth shocks. Throughout the first quarter this year, profit forecasts have tumbled and many investors worry that profit margins have peaked as the fiscal stimulus wears off. The threats are a combination of faster wage growth, global growth deceleration and concerns around global trade. If we see a less-friendly macro backdrop, the most indebted businesses will begin to run into trouble.
Additionally, it is very likely that the rating agencies will be far more proactive with downgrades when merited this time after they faced much scrutiny and criticism during the great financial crisis for failing to meet their responsibilities in the mortgage market. Even if only a small part of the immense BBB market were to be downgraded, investors with investment grade mandates could be forced to offload large amounts of bonds quickly. The knock-on effect to the high yield market would be catastrophic as it would swamp the much smaller and illiquid junk bond market with supply. This would come at a time when corporations are facing record levels of repayment requirements over the coming years.

Even though we are cautious on corporate credit, and especially the BBB segment, we do not considering shorting investment grade-rated bonds. The market believes that the Fed will counter with aggressive interest rate cuts (currently, a cut of almost 50 bps is priced in by year-end) which will be very supportive for investment grade bonds. Additionally, every CFO is conscious that retaining an investment grade rating will be key to surviving a major crisis. These companies need the credit market to not worry about their balance sheet, and whether or not they will be able to refinance those debts that mature in the near future. Confidence is everything.The obvious trade will not be the money maker
Regaining market confidence will not be shareholder-friendly, but rather creditor friendly. Corporates will likely cut down on equity buybacks, dividends, M&A and capital expenditures to maintain their rating. It could be a troubling indicator for equity markets, if the biggest buyers of stocks during the recent bull market withdraw. Recently, another danger signal showed up: New corporate offerings have jumped to their highest level in years. Is the corporate crowd starting to feel that stocks are overdone?
High yield reads like a bond, but trades like a stock. We keep our defensive stance and continue to protect our equity and high yield bond exposure with a convex equity derivatives overlay.

Hooked on Junk

Our medium-term view remains cautious and we are pairing a small overweight in government bonds with an underweight in emerging assets. We are also complementing our equity exposure with options to protect the portfolio in case of equity drawdowns. For the month of May, the Multi Asset Risk Targeted Strategy was down 1.68% versus -5.93% for the MSCI AC World Index, while the Barclays Global Aggregate (USD hedged) was up 1.44%. Year-to-date, the Multi Asset Risk Targeted Strategy has returned 3.62% versus 9.08% for the MSCI AC World index and 4.54% for the Barclays Global Aggregate (USD hedged). * The Multi Asset Risk Targeted Strategy performance is shown in USD net of fees for the representative account of the Multi Asset Risk Targeted (Medium) USD Composite and reflects the deduction of advisory fees and brokerage commission and the reinvestment of all dividends and earnings. Past performance is not indicative of future performance. This information is presented as supplemental information only and complements the GIPS compliant presentation provided on the following page.Strategy Behaviour
Performance Review
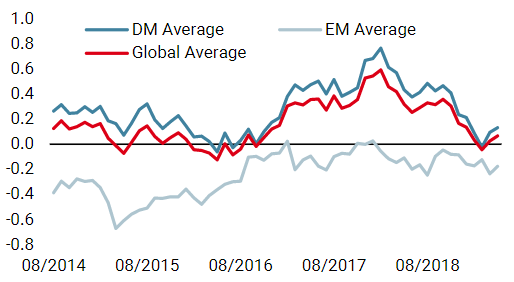
Unigestion Nowcasting
World Growth Nowcaster
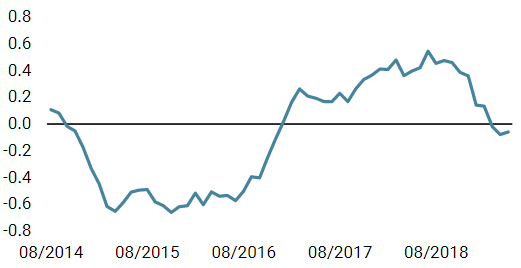
World Inflation Nowcaster
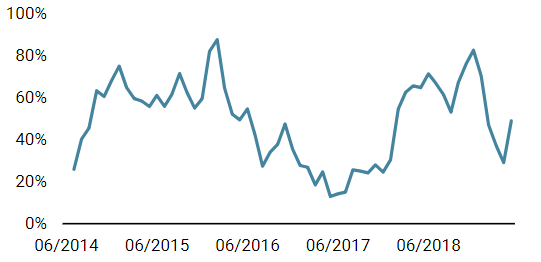
Market Stress Nowcaster
Weekly Change
- Our world Growth Nowcaster marginally decreased last week, with economic data showing softer readings in the US, Canada and China.
- Our world Inflation Nowcaster continued to rise last week, especially in the US.
- Market stress increased over the past week, especially on Friday: volatilities are higher while credit spreads widened.
Sources: Unigestion. Bloomberg, as of 3 June 2019.
Important Information Past performance is no guide to the future, the value of investments can fall as well as rise, there is no guarantee that your initial investment will be returned. This document has been prepared for your information only and must not be distributed, published, reproduced or disclosed by recipients to any other person. This is a promotional statement of our investment philosophy and services only in relation to the subject matter of this presentation. It constitutes neither investment advice nor recommendation. This document represents no offer, solicitation or suggestion of suitability to subscribe in the investment vehicles it refers to. Please contact your professional adviser/consultant before making an investment decision. Where possible we aim to disclose the material risks pertinent to this document, and as such these should be noted on the individual document pages. Please contact Unigestion for a complete list of all the applicable risks. Some of the investment strategies described or alluded to herein may be construed as high risk and not readily realisable investments, which may experience substantial and sudden losses including total loss of investment. These are not suitable for all types of investors. To the extent that this report contains statements about the future, such statements are forward-looking and subject to a number of risks and uncertainties, including, but not limited to, the impact of competitive products, market acceptance risks and other risks. As such, forward looking statements should not be relied upon for future returns. Data and graphical information herein are for information only and may have been derived from third party sources. Unigestion takes reasonable steps to verify, but does not guarantee, the accuracy and completeness of this information. As a result, no representation or warranty, expressed or implied, is or will be made by Unigestion in this respect and no responsibility or liability is or will be accepted. All information provided here is subject to change without notice. It should only be considered current as of the date of publication without regard to the date on which you may access the information. Rates of exchange may cause the value of investments to go up or down. An investment with Unigestion, like all investments, contains risks, including total loss for the investor. This information is issued by Unigestion (UK) Ltd (“Unigestion”), which is authorised and regulated by the UK Financial Conduct Authority (“FCA”). Unigestion is also registered as an investment adviser with the U.S. Securities and Exchange Commission (“SEC”). This information is intended only for professional clients, institutional clients and eligible counterparties, as defined by the FCA, and qualified purchasers as defined by the SEC and has therefore not been adapted to retail clients. Unigestion Multi Asset Risk-Targeted (USD): 31 December 2014 to 31 December 2018 1: This year is incomplete. Special Disclosure: For presentations prior to 31.03.2018 the strategy was measured against the LIBOR 3M USD + 4%. Beginning April 2018 the firm determined that the benchmark did not accurately reflect the strategy mandate and the benchmark was removed. Definition of the Firm: For the purposes of applying the GIPS Standards, the firm is defined as Unigestion. Unigestion is responsible for managing assets on the behalf of institutional investors. Unigestion invests in several strategies for institutional clients: Equities, Hedge Funds, Private Assets and the solutions designed for the clients of our Cross Asset Solution department. The GIPS firm definition excludes the Fixed Income Strategy Funds, which started in January 2001 and closed in April 2008, and the accounts managed for private clients. Unigestion defines the private clients as High Net Worth Families and Individual investors. Policies: Unigestion policies for valuing portfolios, calculating performance, and preparing compliant presentations are available upon request. Composite Description: The Multi Risk Targeted (Medium) composite was defined on 15 December 2014. It consists of accounts which aim to deliver consistent smooth returns of cash + 5% gross of fees across all market conditions over a 3-year rolling period. It seeks to achieve this by capturing the upside during bull markets while protecting capital during market downturns. Benchmark: Because the composites strategy is absolute return and investments are permitted in all asset classes, no benchmark can reflect this strategy accurately. Fees: Returns are presented gross of management fees, administrative fees but net of all trading costs and withholding taxes. The maximum management fee schedule is 1.2% per annum. Net returns are net of model fees and are derived by deducting the highest applicable fee rate in effect for the respective time period from the gross returns each month. List of Composites: A list of all composite descriptions is available upon request. Minimum Account Size: The minimum account size for this composite is 5’000’000.- USD. Valuation: Valuations are computed in US dollars (USD). Performance results are reported in US dollars (USD). Internal Dispersion & 3YR Standard Deviation: The annual composite dispersion presented is an asset-weighted standard deviation calculated for the accounts in the composite the entire year. When internal dispersion is not presented it is as a result of an insufficient number of portfolios in the composite for the entire year. When the 3 Year Standard Deviation is not presented it is as a result of an insufficient period of time. Compliance Statement Unigestion claims compliance with the Global Investment Performance Standards(GIPS®) and has prepared and presented this report in compliance with the GIPS standards. Unigestion has been independently verified for the periods 1 January 2003 to 31 December 2016. The verification report(s) is/are available upon request. Verification assesses whether (1) the firm has complied with all the composite construction requirements of the GIPS standards on a firm-wide basis and(2) the firms policies and procedures are designed to calculate and present performance in compliance with the GIPS standards. Verification does not ensure the accuracy of any specific composite presentation.
Year
Composite
Return Gross
of FeesComposite Net Return
Benchmark Return
Number of Accounts
Internal Dispersion
Composite 3-Yr Std Dev
Benchmark 3-Yr Std Dev
Composite AUM (M)
Firm
AUM (M)
2015
-1.61%
-2.80%
–
1
–
–
–
127.24
15,550.31
2016
5.05%
3.79%
–
1
–
–
–
129.66
18,144.46
2017
11.16%
9.82%
–
1
–
–
–
169.51
22,340.80
2018
-2.91%
-4.08%
–
1
–
–
–
286.93
21,403.49
20191
5.06%
4.74%
–
1
–
–
–
278.23
23,204.71