2019 was a great year for global stocks, with the MSCI World index delivering 27.7% in USD – the fifth best annual return since 1970 and the best since the market rebound of 2009. As in 2009, monetary policy was the key driver for risky assets. If last year had a song, it would be called “Thanks for the Dance, Central Bankers!” and the chorus would be: “The higher the beta to equity, the better the yearly performance”. We believe that market conditions should remain favourable for risky assets thanks to supportive monetary policy. Nevertheless, a similar return in 2020 is unlikely and our conviction is that discrimination within and across assets will be crucial to deliver positive and smooth returns.How to position the portfolio after the “beta” party
Thanks for the Dance, Leonard Cohen, 2019

Thanks for the Dance

What’s Next?
Central bankers helped financial markets to deliver amazing returns in 2019
December was another great month for risky assets with high positive returns for developed equities (+3%), emerging equities (7.5%) and credit (+2.3% for Barclays Global HY). Stabilisation of macroeconomic momentum and positive trade war developments were the key factors over the month. As a result, safe assets such as duration declined markedly. The US 10 year yield rose from 1.77% to 1.92%, mainly driven by the inflation premium.
If December’s returns were driven by macro and sentiment risk factors, the main driver over the year was once again monetary policy. The easing implemented by key central banks over the year prevented economic recession and supported great returns for most assets. In 2019, global equities returned 27.7% (MSCI World) with US equities outperforming (+30.2% for S&P 500) as Japanese and UK equities underperformed (+23.8% for Nikkei 225 and +16.3% for FTSE 100). Emerging equities lagged developed ones due to underperformance in Chinese markets (+19.4% for MSCI Emerging and +16.4% for HSCEI Index). Within sectors and styles, dispersion was large. In terms of sectors, the MSCI World IT index delivered an amazing 48% in 2019 while the MSCI World Utilities index rose by 23%. The Energy sector lagged other sectors with a 12.5% annual return. Regarding styles, investors rewarded Quality (+36% for the MSCI World Quality) at the expense of Value (+21% for the MSCI World Value) over the year, while Momentum, Low Vol and Size were in line with the market.
Contrary to 2009 when equity markets delivered similar returns, 10-year bond yields declined by 75bps on average for developed countries in 2019, having risen significantly in 2009 (from 2.2% to 3.8% for the US 10-year). That is the wizardry of QE: all asset prices can rise at the same time. Corporate credit delivered great returns, benefiting from both spread compression and the duration effect of declining yields.
In currency markets, the global picture was mixed. The US dollar strengthened against Nordic currencies and the euro, but declined versus the British pound, and the Canadian and Australian dollars over the year. Idiosyncratic factors drove currency in the emerging space. The greenback appreciated versus the Brazilian real and the yuan, but declined versus the Mexican peso and the South African rand.
We are positive for 2020…
While our dynamic allocation framework revealed an alignment of planets four months ago (satisfactory global growth, overly bearish sentiment and attractive valuations for growth-oriented assets), the narrative for 2020 has changed slightly. In our view, although the macroeconomic picture should remain far from recessive territories, helped by the continued accommodative stance of central banks, valuation and market sentiment are now appearing less supportive for risky assets. For 2020, our major source of optimism comes from monetary policy. A supportive policy mix is likely to remain in place, with a potential for amplification in the case of an economic slowdown. We believe that this will keep the volatility of macroeconomic variables at low levels, reduce the risk of large shocks and reduce the probability of sustained financial turmoil. As a result, we expect a reduction in the risk premium of most liquid risky assets.
…but we expect more dispersion across and within assets
Based on this, we maintain a preference for equities and credit at the expense of sovereign bonds and real assets, but with much greater discrimination than in the past. While 2019 was a year for beta, we think that 2020 will bring about a larger dispersion, both within and across assets.
Of course, it is always difficult to forecast yearly asset returns. Who would have forecast in 2018 that returns for 2019 would represent one of the best years for most asset classes? Ten years ago, everybody thought that accommodative monetary policy would be inflationary. No one would have predicted that the biggest monetary experiment of all time would result in zero inflationary pressures.
Within growth-oriented assets, besides a long bias to equities and credit, we like relative value strategies, such as FX carry strategies, credit carry and volatility carry. They should benefit from the lower realised volatility brought about by central bank support. From a valuation perspective, emerging market and Japanese equities appear the most attractive.
Within diversifying assets, we prefer US bonds at the expense of European ones because the Fed has much more scope to ease compared to the ECB, SNB, Riskbank or BofE. We also expect a steepening of the US and German curves, driven by an improvement in the economic outlook without any inflationary pressures.
Finally, we are looking toward the FX market as an attractive tool to diversify rather than the usual safety of sovereign bonds and gold. Within FX, our preference is for defensive strategies in order to balance our positive tilts in favour of growth-oriented assets.

Overall, we believe that market sentiment will lie at the heart of our tactical allocation for three main reasons. Firstly, the political agenda is full in 2020 with the US election, rising instability in European governments, Brexit, unrest in several emerging countries, trade war and Middle East tensions. Therefore, political risks are likely to determine investor sentiment and, consequently, positioning and return. Secondly, political polarisation has increased and is expected to remain high over the coming months. This could generate a higher frequency of binary outcomes for expected and unexpected events in a manner similar to Brexit and the US election in 2016. Thirdly, markets are more sensitive to sentiment because valuations are expensive now. In this challenging environment, the rationale for reducing risk and adding protection to a portfolio is high. Nevertheless, for assessing market sentiment, risk/reward analysis is crucial and here, more than elsewhere, details matter. Defining the risks to cover is not enough to protect your portfolio. Evaluating the cost of hedging, defining its implementation and timing its monetisation are as important as deciding on the risks to hedge. In our opinion, investors tend to overestimate two elements: 1) the nature of the risk and its impact on assets, and 2) the protection offered by typical hedging methods using puts or put spreads. Generalised quantitative easing has structurally modified the relationship between volatility and risky asset returns. That change should be seen as: 1) an opportunity to capture spread between low realised volatility and a high, implied one, and 2) a driver for changing the way portfolios are protected, from using optional strategies to a diversification-led approach that incorporates FX or alternative liquid strategies. In fact, expanding the investment universe would allow the sensitivity of a portfolio to specific events to be lowered, thereby reducing the need for specific hedging. With political risks set to rise further in 2020, these two elements will play a big role in our strategy. Our conviction is that short-term shocks will be more frequent than in the past.What are the risks?
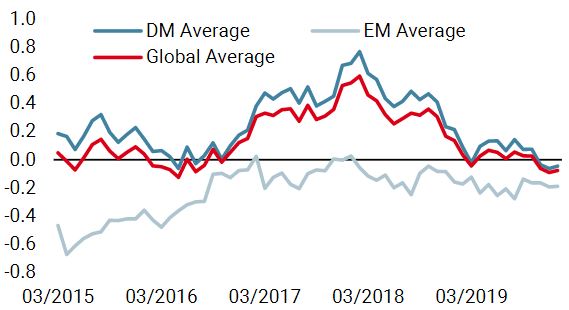
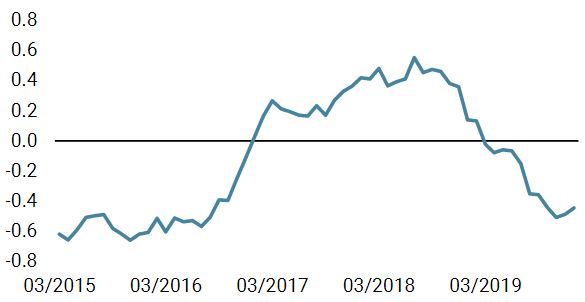
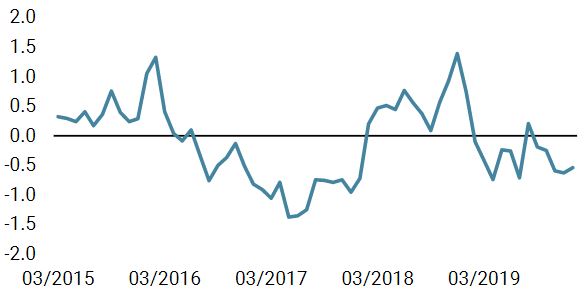
Unigestion Nowcasting
World Growth Nowcaster
World Inflation Nowcaster
Market Stress Nowcaster
Weekly Change
- Our world Growth Nowcaster increased last week. 50% of the data is improving: growth stabilisation remains on the cards.
- Our world Inflation Nowcaster increased last week but inflation risk remains low.
- Market stress increased at the end of last week but market stress risks remains low.
Sources: Unigestion. Bloomberg, as of 06 January 2020.
Important Information
This document is provided to you on a confidential basis and must not be distributed, published, reproduced or disclosed, in whole or part, to any other person.
The information and data presented in this document may discuss general market activity or industry trends but is not intended to be relied upon as a forecast, research or investment advice. It is not a financial promotion and represents no offer, solicitation or recommendation of any kind, to invest in the strategies or in the investment vehicles it refers to. Some of the investment strategies described or alluded to herein may be construed as high risk and not readily realisable investments, which may experience substantial and sudden losses including total loss of investment.
The investment views, economic and market opinions or analysis expressed in this document present Unigestion’s judgement as at the date of publication without regard to the date on which you may access the information. There is no guarantee that these views and opinions expressed will be correct nor do they purport to be a complete description of the securities, markets and developments referred to in it. All information provided here is subject to change without notice. To the extent that this report contains statements about the future, such statements are forward-looking and subject to a number of risks and uncertainties, including, but not limited to, the impact of competitive products, market acceptance risks and other risks.
Data and graphical information herein are for information only and may have been derived from third party sources. Although we believe that the information obtained from public and third party sources to be reliable, we have not independently verified it and we therefore cannot guarantee its accuracy or completeness. As a result, no representation or warranty, expressed or implied, is or will be made by Unigestion in this respect and no responsibility or liability is or will be accepted. Unless otherwise stated, source is Unigestion. Past performance is not a guide to future performance. All investments contain risks, including total loss for the investor.
Unigestion SA is authorised and regulated by the Swiss Financial Market Supervisory Authority (FINMA). Unigestion (UK) Ltd. is authorised and regulated by the UK Financial Conduct Authority (FCA) and is registered with the Securities and Exchange Commission (SEC). Unigestion Asset Management (France) S.A. is authorised and regulated by the French “Autorité des Marchés Financiers” (AMF). Unigestion Asset Management (Canada) Inc., with offices in Toronto and Montreal, is registered as a portfolio manager and/or exempt market dealer in nine provinces across Canada and also as an investment fund manager in Ontario and Quebec. Its principal regulator is the Ontario Securities Commission (OSC). Unigestion Asia Pte Limited is authorised and regulated by the Monetary Authority of Singapore (MAS). Unigestion Asset Management (Copenhagen) is co-regulated by the “Autorité des Marchés Financiers” (AMF) and the “Danish Financial Supervisory Authority” (DFSA). Unigestion Asset Management (Düsseldorf) SA is co-regulated by the “Autorité des Marchés Financiers” (AMF) and the “Bundesanstalt für Finanzdienstleistungsaufsicht” (BAFIN).