- The current inflation surge is the result of an exceptional confluence of Covid-related events
- Despite increased geopolitical risk, inflation looks set to cool significantly in 2022
- From its current 7.9% peak, we expect US CPI to drop towards 3% in December
The evidence was there for everyone to see. And yet the authorities chose to ignore the threat, dismissing it as “transitory”, their dots and gazes firmly fixed no higher than the horizon and the promise of smooth sailing as enjoyed up until now. But reality sank in and the markets tanked, when the central banks finally decided to counter inflation with aggressive rate hikes over the next year. Now it’s official, US consumer prices surged by 7.9% on a year-on-year basis in February, with no apparent end in sight. To make matters worse, the Ukraine crisis propelled many commodity markets to record highs. Although fears of an inflationary spiral may now seem justified, a deeper analysis suggests otherwise. We believe, in fact, that the peak of inflation is very near.
While inflation represents the balance between supply and demand for goods and services, its scale and length depends on its triggers and their drivers. An inflation shock reflects an unbalanced situation, which can come from either higher than expected demand, lower supply because of disruption, or both. It’s also usually a backward-looking indicator, reflecting past imbalances that tend to revert to the mean, as changes in price dynamically recalibrate supply and demand and reduce the asymmetry between the two over time.
In this short paper we will explain how the current high level of inflation is the result of an exceptional situation, driven by an uneven policy mix and a “no inventory/just in time” supply chain. Our “inflation peak” view is based on the following factors:
- Reversing supportive policy mix
- Easing in bottlenecks
- Limited risk of an inflationary wage spiral
- Large base effects ahead, even with a higher geopolitical risk
How Far “Behind the Curve” Is the Fed?
With price stability being one of the pillars of its dual mandate, the Fed has always reacted to rising inflation surprises. Over the last five decades, the only time the Fed did not change its stance despite an upward inflation surprise was between 2010-2011, when US activity and inflation were both recovering from very depressed levels and Europe was struggling with its own financial crisis. Nevertheless, that surprise was small compared to the current one. Figure 1 illustrates how late the Fed has been so far to react to the most recent inflation shock.
Figure 1: 12m Change in Fed Funds vs Core Inflation
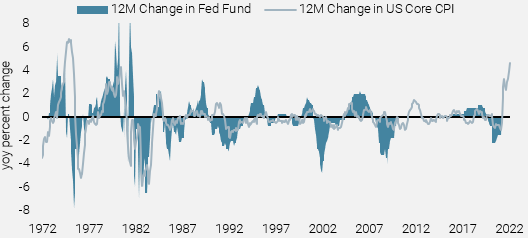
Sources: Unigestion, Fed, BLS.

The current situation reflects the magnitude of inflationary pressures piling in from both sides: higher demand and disrupted supply.

How Exceptional Is the Current Inflation Spike?
Monetary authorities could argue that the current situation is exceptional, because the Covid crisis and the lockdowns thrust the global economy into unchartered territory. This is true in terms of the massive policy support that ensued. Never before did central banks’ balance sheets balloon by so much (Figure 2). Monetary stimulus and fiscal measures combined boosted demand by a massive 25% of US GDP in 2021; roughly double the 2008 policy-mix support and eight times the one provided in 2001.
Figure 2: US Policy Mix in GDP Terms
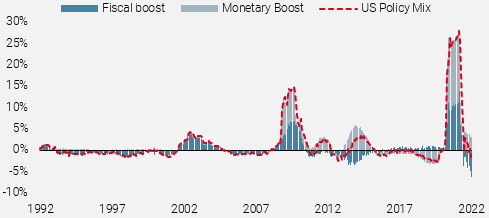
Fiscal boost represented by the 12m change in US fiscal surplus/deficit as a % of GDP. Monetary policy boost represented by the 12m change in Fed balance sheet as a % of GDP,
Sources: Unigestion, Fed, BLS. Data as at 28.02.2022
This aggressive policy mix, implemented by the US administration and the Fed, caused both cyclical and non-cyclical inflation components to surge at the same time, which has never occured since 1985. Previous jumps in non-cyclical components were associated with declining cyclical components as in 1987, 2022 and 2009 (Figure 3). The current situation therefore looks exceptional, featuring a positive correlation between both components, as well as a record jump for the non-cyclical elements. It reflects the magnitude of inflationary pressures piling in from both sides: higher demand and disrupted supply.
The bad news is that the US Inflation Nowcaster currently stands at a very high level. The good news is that this dynamic is reversing.
Figure 3: US Cyclical and Non-Cyclical Core Inflation (YoY, %)
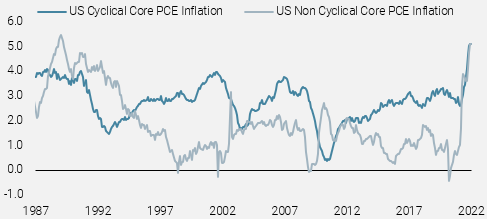
Sources: Unigestion, Fed, BLS. Data as at 28.02.2022
How Long Can the Current Trend Last?
We monitor the risk of an inflation shock through our proprietary Nowcasters, which track supply and demand pressures for a large spectrum of sectors and countries in real time. The bad news is that the US Inflation Nowcaster currently stands at a very high level. Nevertheless, the good news is that this dynamic is reversing. As shown in Figure 4, the 3-month change for sub components of our US Inflation Nowcaster are null or slightly up. Moreover, the Atlanta Fed inflation report shows a decline in 3 month annualised prices for both Core Flexible and Flexible readings, confirming our view that inflation has peaked.
Figure 4: US Inflation Nowcaster by Components
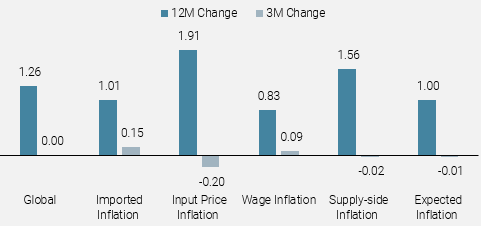
Sources: Unigestion
In our view, core inflation should decelerate thanks to three key elements:
Base effects
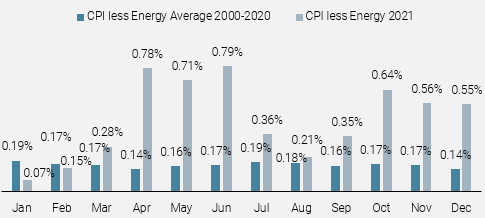
Indeed, the base effect for the US CPI less energy will be large in the coming months. As depicted in Figure 5, which compares the monthly change observed last year versus the average over the last 20 years, the biggest surprise in realised inflation occurred in April, May, and June 2021.
A ‘back to normal’ scenario would lead to a peak in headline inflation in February 2022 at 7.9%, declining to 5.5% in June and ending the year around 3%.
Figure 5: Monthly Change in US CPI Less Energy
Sources: Unigestion, BLS, Bloomberg. Data as at 28.02.2022
Easing in some bottlenecks and inventory rebuilding
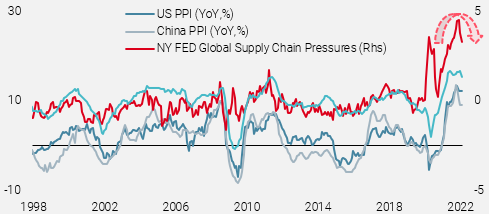
The dynamic in producer prices is also encouraging, as they are decelerating in China. As shown in Figure 6, correlation with US producer prices is historically very high and suggests a similar reversal in the coming months for the US, which in turn should give some flexibility for corporate pricing. Moreover, as highlighted by the NY Fed indicators that track Global Supply Chain Pressures, bottlenecks are easing in 2022 with most of its sub-components decreasing in January and February, which is in line with our US Inflation Nowcaster, indicating a peak for US inflation.
Figure 6: Supply Chain Pressures and Producer Prices (YoY, %)
Sources: Unigestion, Fed, BLS. Data as at 28.02.2022
Lower demand as fiscal boost ends and change in monetary policy expectations signals the end of easy money
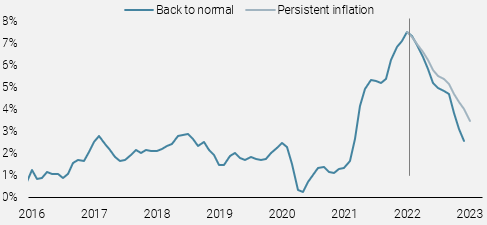
As a result, our analysis of the drivers of the surge in US inflation leads us to forecast a large deceleration that could happen soon. A “back to normal” scenario, assuming that monthly changes in 2022 align with the ones observed between 2000 and 2020, would lead to a peak in headline inflation in February 2022 at 7.9%, declining to 5.5% in June and ending the year around 3.0%. A scenario of “persistent inflation”, corresponding to injecting half of the monthly changes observed in 2021, already much higher than the historical ones, would result in US headline inflation at 6.3% in June and at 4.5% for end of this year (Figure 7). In both cases, the deceleration will be large and ease the pressure on central bankers to normalise “Volcker” style.
The major and only risk for the US economy would be a continued rise in wage growth that would push inflation pressures higher and corporate profitability lower.
Figure 7: US Inflation Under Two Scenarios%)
Sources: Unigestion, Fed, BLS. Data as at 28.02.2022
How Big Is the Risk of a Policy Mistake?
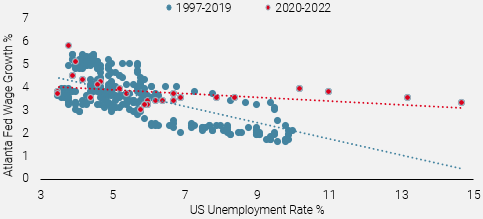
In our view, the major and only risk for the US economy and the path of Fed normalisation would be a continued rise in wage growth that would push inflation pressures higher and corporate profitability lower. To assess its magnitude, we employ various relationships connecting inflation, unemployment rates and wage growth. Historically, Okun’s law implies that stronger activity leads to lower unemployment rates and higher inflation, while according to the Phillips curve, the lower the unemployment rate, the larger the wage growth. Plotting these three variables shows that current relationships don’t support the inflation/wages spiral narrative.
Firstly, the current Phillips curve appears flatter than the historical one, reflecting a lower wage growth sensitivity to changes in employment. Figure 8a also shows that current wage growth at 5.8% is in line with past episodes of low unemployment rates. Secondly, as shown in Figure 8b, given the current level of inflation, wage growth would be much higher historically. In our view, wage growth would need to be above 7% on a YoY basis to justify the likelihood of an inflation/wage spiral scenario. Given the decline in medium-term inflation expectations from households exhibited in the latest NY Fed survey, we doubt that wage growth will reach this level.
Figure 8a: Historical Wage Growth and Unemployment Relationships vs Current
Sources: Unigestion, Fed, BLS. Data as at 28.02.2022
Figure 8b: Historical Wage Growth and Inflation Relationships vs Current
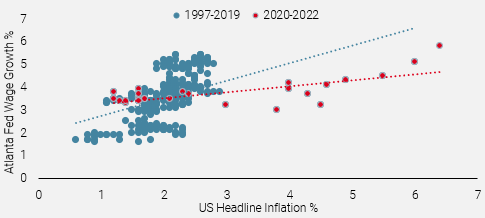
Sources: Unigestion, Fed, BLS. Data as at 28.02.2022
Moreover, recent studies from both the Federal Reserve Board and the NY Fed , show that realised inflation doesn’t drive long term household inflation expectations. The main argument of these studies is that households strongly believe that any short term change will reverse on a longer term horizon. This conviction anchors their long term inflation expectations around the central bank target and doesn’t determine the wage rate that they are willing to accept (Figure 9). This stability in expectations upholds the credibility of the Fed’s monetary policy. It also applies to most other economies, as documented by the recent the BIS study , outlining the stability of medium term inflation expectations, despite the strong rise in realised inflation.
Figure 9: Short vs Long Term Household Inflation Expectations
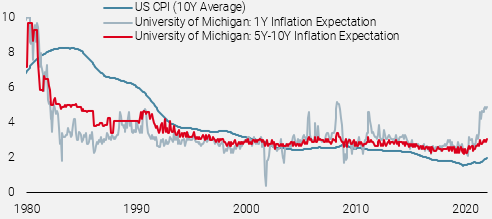
Sources: Unigestion, Fed, BLS. Data as at 28.02.2022
In our view, the risk is, on the contrary, that household demand decelerates too much. We continue to see depressed consumer sentiment, high prices, and negative real wage growth threatening consumption in the first half of this year.
Overall, the Fed has stepped into the inflation-fighting arena exceptionally late. Forward-looking indicators such as orders books, inventory/sales ratios, or the forward short-term yield curve indicate that beneath the surface, the robustness of the US economy could be questioned sooner than expected. Adding to this fragile situation, tighter financial conditions could create a marked slowdown via the inventory cycle. A vicious negative feedback loop, starting from depressed consumer confidence, translating into lower demand and slowing orders, would lead to excess inventories and subsequently to a classic recession, triggered by a monetary policy mistake. Looking at Figure 10, the picture could quickly deteriorate if the “Growth Tax” continues to worsen.
The stage is set for inflation to peak in the not too distant future, if it hasn’t already done so.
Figure 10: US Policy-Mix: From Boost to Brake
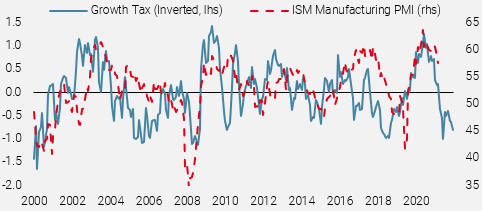
Growth Tax is a combination of the US dollar, oil prices and interest rates, advanced by 9 months. It expresses their negative impact on the US economy, working as a growth tax.
Source: Bloomberg, Unigestion. Data as at 28.02.2022
The recent surge in inflation is the result of an exceptional confluence of events since Covid first hit the planet: US fiscal boost equivalent to 25% of GDP, ultra-loose monetary policy, pent up demand, and severe supply bottlenecks across the globe all combined to create the perfect inflationary “storm”. This dynamic is now going into reverse, and given the moderate risk of a wage spiral and very strong upcoming base effects, the stage is set for inflation to peak in the not too distant future, if it hasn’t already done so. Although geopolitics may influence the timing of the peak by temporarily increasing inflation pressures, markets should rather focus on the growth outlook and the pace of its deceleration, as inflation risk is already priced into the bond and commodities markets. Indeed, inflation tells a tale of the past, and from the evidence we see going forward, it should cool down significantly in 2022.
The Oil Base Case
To illustrate the significance of the upcoming base effects, let’s focus on the market which has been making all the headlines lately. WTI oil recently broke through the $100 barrier, nearly doubling in the space of one year. So WTI oil would need to grow at the same pace over the next year, just to stay at the same year-on-year “inflation” rate. Assuming an oil price currently at $100 that increases by 5% every month for the next 12 months, it would be at $180 in a year, but its yoy inflation rate would remain nearly constant. Hence, even if oil were to rally to these high levels in a year’s time due to ongoing geopolitical tensions, it would hardly make a dent in the US headline CPI next year because of its large base effect. Moreover, in Europe, where the situation could turn dramatic due its energy dependency, most of the countries heavily tax gasoline, giving them more leeway to absorb crude price increases and thereby limit the pass-through effect to consumer price inflation.
Figure 11: 12-Month Scenarios for WTI Oil Inflation
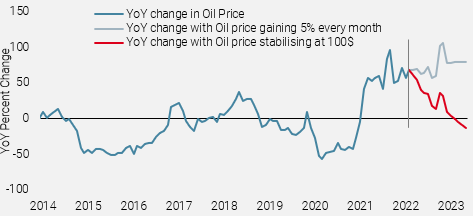
Sources: Unigestion Bloomberg. Data as at 28.02.2022
Important information
Past performance is no guide to the future, the value of investments, and the income from them change frequently, may fall as well as rise, there is no guarantee that your initial investment will be returned. This document has been prepared for your information only and must not be distributed, published, reproduced or disclosed by recipients to any other person. It is neither directed to, nor intended for distribution or use by, any person or entity who is a citizen or resident of, or domiciled or located in, any locality, state, country or jurisdiction where such distribution, publication, availability or use would be contrary to law or regulation. This is a promotional statement of our investment philosophy and services only in relation to the subject matter of this presentation. It constitutes neither investment advice nor recommendation. This document represents no offer, solicitation or suggestion of suitability to subscribe in the investment vehicles to which it refers. Any such offer to sell or solicitation of an offer to purchase shall be made only by formal offering documents, which include, among others, a confidential offering memorandum, limited partnership agreement (if applicable), investment management agreement (if applicable), operating agreement (if applicable), and related subscription documents (if applicable). Please contact your professional adviser/consultant before making an investment decision.
Where possible we aim to disclose the material risks pertinent to this document, and as such these should be noted on the individual document pages. The views expressed in this document do not purport to be a complete description of the securities, markets and developments referred to in it. Reference to specific securities should not be considered a recommendation to buy or sell. Investors shall conduct their own analysis of the risks (including any legal, regulatory, tax or other consequences) associated with an investment and should seek independent professional advice. Some of the investment strategies described or alluded to herein may be construed as high risk and not readily realisable investments, which may experience substantial and sudden losses including total loss of investment. These are not suitable for all types of investors.
To the extent that this report contains statements about the future, such statements are forward-looking and subject to a number of risks and uncertainties, including, but not limited to, the impact of competitive products, market acceptance risks and other risks. Actual results could differ materially from those in the forward-looking statements. As such, forward looking statements should not be relied upon for future returns. Targeted returns reflect subjective determinations by Unigestion based on a variety of factors, including, among others, internal modeling, investment strategy, prior performance of similar products (if any), volatility measures, risk tolerance and market conditions. Targeted returns are not intended to be actual performance and should not be relied upon as an indication of actual or future performance.
Data and graphical information herein are for information only and may have been derived from third party sources. Unigestion takes reasonable steps to verify, but does not guarantee, the accuracy and completeness of this information. As a result, no representation or warranty, expressed or implied, is or will be made by Unigestion in this respect and no responsibility or liability is or will be accepted. All information provided here is subject to change without notice. It should only be considered current as of the date of publication without regard to the date on which you may access the information. Rates of exchange may cause the value of investments to go up or down. An investment with Unigestion, like all investments, contains risks, including total loss for the investor.
Backtested or simulated performance is not an indicator of future actual results. The results reflect performance of a strategy not currently offered to any investor and do not represent returns that any investor actually attained. Backtested results are calculated by the retroactive application of a model constructed on the basis of historical data and based on assumptions integral to the model which may or may not be testable and are subject to losses.
Data set used for backtested simulations are all in USD, gross of management fees and net of estimated transaction costs, from 17.01.2008 to 31.03.2019. Passive Equities represents the MSCI All Country World Index TR Net in USD. Low-Risk Equities is a backtested simulation that replicates Unigestion’s expertise in managing risk-based equity strategies on an all country universe. Futures Hedge Portfolio represents a combination of Bloomberg generic futures on S&P 500, Euro STOXX 500 and TOPIX, in USD, gross of fees, net of estimated transaction costs. Options strategies represents backtested simulation in USD, gross of fees, net of estimated transaction costs using Morgan Stanley data.
Changes in these assumptions may have a material impact on the backtested returns presented. Certain assumptions have been made for modeling purposes and are unlikely to be realized. No representations and warranties are made as to the reasonableness of the assumptions. This information is provided for illustrative purposes only. Backtested performance is developed with the benefit of hindsight and has inherent limitations. Specifically, backtested results do not reflect actual trading or the effect of material economic and market factors on the decision-making process. Since trades have not actually been executed, results may have under- or over-compensated for the impact, if any, of certain market factors, such as lack of liquidity, and may not reflect the impact that certain economic or market factors may have had on the decision-making process. Further, backtesting allows the security selection methodology to be adjusted until past returns are maximized. Actual performance may differ significant ly from backtested performance.
Unigestion (UK) Ltd. is authorised and regulated by the UK Financial Conduct Authority (FCA). It is also registered with the Securities and Exchange Commission (SEC). Unigestion SA is authorised and regulated by the Swiss Financial Market Supervisory Authority (FINMA). Unigestion Asset Management (France) S.A. is authorised and regulated by the French Autorité des Marchés Financiers (AMF). Unigestion Asset Management (Canada) Inc., with offices in Toronto and Montreal, is regulated in Canada by the securities regulatory authorities in Ontario, Quebec, Alberta, Manitoba, Saskatchewan, Nova Scotia, New Brunswick and British Columbia. Its principal regulator is the Ontario Securities Commission.
Document issued March 2022.