INTRODUCING EQUITY INDEX VALUE
- Our research shows that the principles of stock-specific value investing can be applied at an index level to generate returns from the relative performance of regional equity indices.
- Backtests on our equity index value strategy show strong longterm performance with low or negative correlation to other risk premia, including single stock value strategies.
- Equity index value presents a valuable new source of potential, uncorrelated returns to our flagship Alternative Risk Premia strategy.
Overview
Value factor investing has been shown to be an effective strategy across all asset classes. Single stock value factor in particular has garnered considerable investor and academic attention for decades. Unigestion’s Cross Asset Solutions team has found that the same theoretical approach applied at an index level can also deliver long-term performance but with a low correlation to other factors, including single stock equity value. In this paper, we discuss index value strategy implementation, the results of our backtested performance analysis and why performance correlations are low.
What is the Value Premium?
Value is one of the most well-studied risk premia, referring to the strategy of going long assets that are ‘cheap’ and short assets that are ‘expensive’. It was first shown to be an effective strategy on single stock equities, most prominently by Fama and French, but has since been shown to work across equity indices, currencies, government bonds and commodity futures (Asness et al, 2013). Most impressively, they show evidence of co-movement amongst value strategies across different asset classes. In other words, on average, when value does well in one asset class, it tends also to do well in others, and vice versa. This implies the presence of common global factors which drive the returns of value risk premia as a whole. This style has also been employed by some of the greatest financial investors: a recent paper notably showed that Warren Buffet’s alpha could be well explained by a large, consistent exposure to a “value” factor (Frazzini et al, 2018).
That such a seemingly simple idea (buy cheap, sell expensive assets) has been so strong historically and so pervasive across asset classes can seem puzzling, but reasons for the existence of a “value” premium have been studied extensively.
Behavioural Biases and Risk Explain the Existence of the Premium
There are a number of theories that seek to explain these global factors, which broadly fall into two camps: behavioural and risk-based. Behavioural explanations say that value assets are too cheap because investors are either scared of them or not interested by them. Risk-based explanations centre on the notion that value assets are riskier: they may be distressed and / or have volatile outlooks, and the value premium exists as compensation for bearing this risk. In reality, both schools of thought have merit and probably contribute to the long-term performance of the value factor. A particularly appealing characteristic of value strategies is that they tend to have low to negative correlation with momentum or trend-following strategies. This intuitively makes sense, as assets trending up (down) will eventually become expensive (cheap), meaning that trend-following and value strategies will take opposing positions. We currently run value strategies on single stocks and currencies but have recently developed our equity index value strategy, which applies the same theory to equity indices.
Value Investing in Equities: Single Stocks vs Indices
While the underlying principle behind single stock and equity index value is the same, the strategies take very different exposures. To create a single stock value portfolio, we rank the universe of stocks on a set of valuation measures, then go long the cheapest stocks and short the most expensive ones. Here, the portfolio manager is seeking to gain exposure to the value risk premia, with as little market exposure as possible. As such, these strategies are normally constructed to be sector and region neutral (long and short equal amounts within each sector and region) and have little to zero market beta (indifferent to whether equities move up or down).
Our equity index value strategy is completely different to this. We rank indices in our investment universe on value, going long cheap markets and short expensive ones, implicitly leading to geographic bets. Unlike single stock value, equity index value is expected to generate returns from the relative performance of regional equity indices. This gives us confidence that, from a theoretical perspective, the strategies are not exposed to the same risks.
How do we Construct the Equity Index Value Strategy?
Signal: The first stage of building an equity index value strategy is to develop a value signal. Common sense tells us that no single metric is consistently accurate so, as with other risk premia, we prefer to use a blend of signals. At the single stock level, valuation is usually best assessed through different metrics depending on each security’s sector. In this strategy, we trade broad indices so this fine-tuning is not possible. However, three financial ratios seem to deliver consistent information about valuation across sectors and regions: Price to Earnings (P/E), Price to Dividend (P/D) and Enterprise Value to EBITDA (EV/EBITDA). These metrics are converted to yields in excess of the corresponding short-term interest rates, and z-scored in order to allow direct comparison between indices and relative to history.
Figure 1: Historical Value Signals of Two Regional Indices (Z-scored)
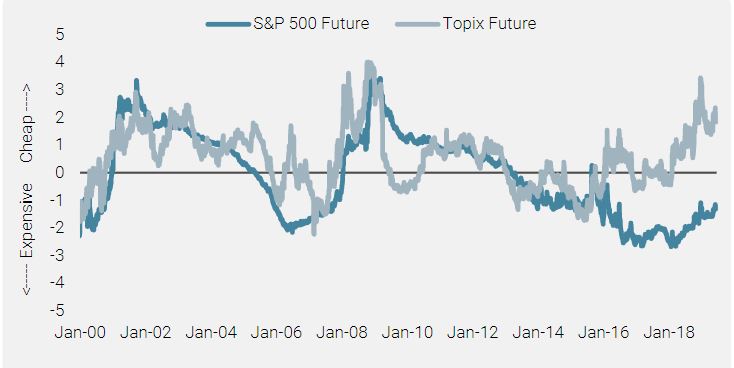
Note: The higher the score, the cheaper the index.

The drivers of our equity index value strategy are completely separate to those of single stock value.

Allocation: Once we obtain those z-scores, we allocate long (short) positions to indices with higher (lower) than median scores, and scale the long and short legs to obtain a beta-neutral portfolio. This ensures that we capture the value premium without being affected by fluctuations in the overall level of equity markets.
How does Equity Index Value Interact with Other Risk Premia?
Backtests show that this strategy has exhibited a low or negative correlation to other risk premia that we manage. As we expect with valuation-based strategies, equity index value performs worst in periods of market stress. This pattern of behaviour can also be observed in single stock equity value. However, the correlations between the two equity value implementations is very low; on average just 0.05 using 15 years of rolling 1-year weekly data. This may seem counterintuitive but, if we analyse the risks that the two strategies capture, it is easily rationalised. Studies show that single stock value strategies expose investors to companies with highly variable earnings that are generally ‘riskier’. This is not the exposure we capture when trading equity index futures. Instead of being long (short) companies that investors deem risky (safe), we are long (short) a whole market. There are many factors that investors use to determine how risky an equity market is; the most obvious being the political and economic backdrop of the country of the equity market. As such, the drivers of this value strategy are completely separate to those of single stock value, namely macroeconomic as opposed to company-specific. This explains the low average correlation through time and confirms our expectation that we are adding a new source of return to our flagship Alternative Risk Premia strategy.
Figure 2: Long-term Correlations of Equity Index Value with other Alternative Risk Premia
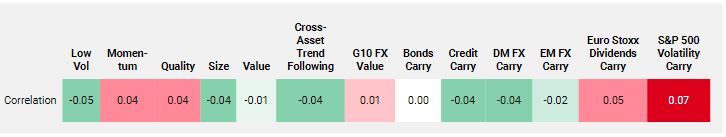
Note: Simulated past performance includes back-tested data and is not a reliable indicator of future performance, the value of investments can fall as well as rise and there is no guarantee that your initial investment will be returned.
A differentiating return stream with low correlation to other alternative risk premia strategies.
Figure 3: Rolling 1-year Correlation between Equity Index Value and Single Stock Value
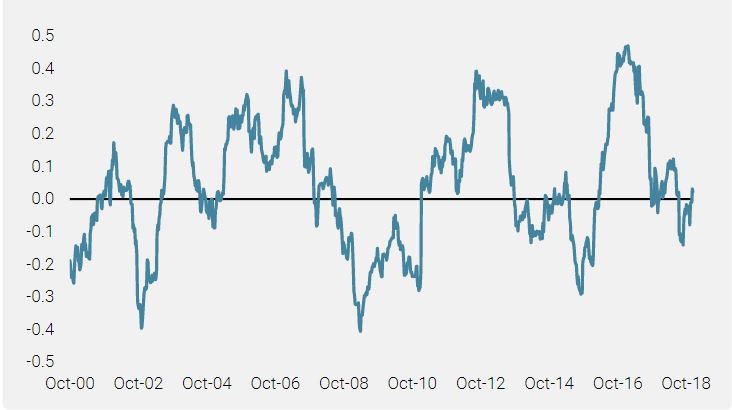
Note: Simulated past performance includes back-tested data and is not a reliable indicator of future performance, the value of investments can fall as well as rise and there is no guarantee that your initial investment will be returned.
Backtest analysis reveals that the strategy has performed well through history, generating an annualised return of just over 4% and a Sharpe ratio of 0.67.
Simulated Performance
Backtest analysis of equity index value reveals that the strategy has performed well through history, generating an annualised return of just over 4% and a Sharpe ratio of 0.67. However, it has had a difficult time over the past five years, not generating any return. Naturally, we sought to understand why this was the case in the research process.
The most likely explanation is that since 2012, we have been in a market that simply does not care about value: cheap markets have become cheaper and expensive markets, more expensive. In such an environment, we do not expect a valuation strategy to perform well. In fact, if a value strategy does perform well in this environment, it’s probably not a value strategy. In other words, that long period of underperformance shows us that the strategy is behaving exactly as we’d expect.
Figure 4: Excess Sharpe Ratio of the Equity Index Value Strategy in Different Macro Regimes vs the Overall Sample
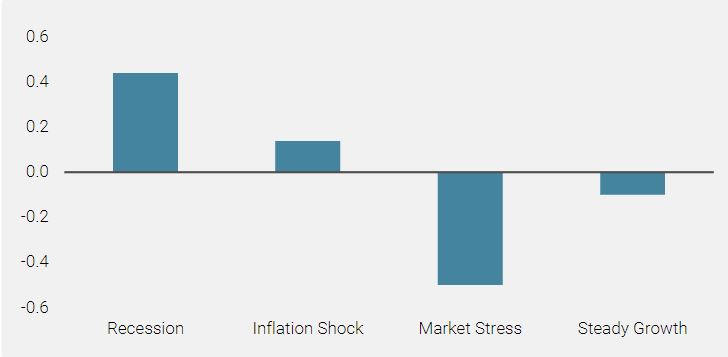
Note: Simulated past performance includes back-tested data and is not a reliable indicator of future performance, the value of investments can fall as well as rise and there is no guarantee that your initial investment will be returned.
Equity index value is expected to perform well during recession regimes, when the economy is still relatively weak but the market is recovering.
Looking at the regime-conditional behaviour, we see that the strategy performs well in most periods except for market stress. Poor performance in periods of market stress is logical as value strategies tend to load on riskier assets. Performance in periods of recession may seem less intuitive but there is some logic to this. Value strategies often perform well as markets recover, when investors realise that the situation perhaps isn’t quite as bad as feared, rotating away from assets that have become expensive as markets suffered, into assets that have become cheap. As periods of recession and market stress do not always coincide, periods where the economy is still relatively weak but the market is recovering can be good for value strategies.
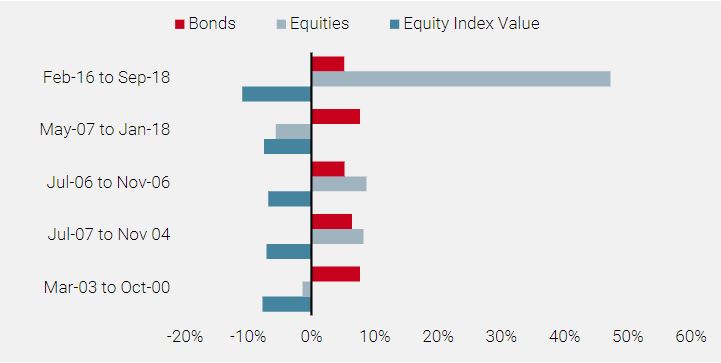
Finally, looking at the drawdowns, we can see that they are relatively limited, with a max drawdown of just 10.9% since 2001. These occur both in periods where equities have performed well and performed badly, which implies that there is no clear downside correlation between the strategy and equity markets. The more consistent pattern is with bonds, which have delivered strong positive returns in all instances of drawdowns for the strategy. This relationship does not hold over the full backtest, with a full-period weekly correlation to bonds of -0.03 and a downside beta to bonds of 0.03. As such, it is fair to assume that the relationship we appear to see below is not indicative of anything more persistent.
Figure 5: Five Largest Market Drawdowns of the Equity Index Value Strategy since 2000
Note: Simulated past performance includes back-tested data and is not a reliable indicator of future performance, the value of investments can fall as well as rise and there is no guarantee that your initial investment will be returned.
We believe that our equity index value strategy can be combined with a broad range of other alternative risk premia to deliver liquid, cost-efficient returns with a low correlation to traditional risk premia.
A Diversifying Return Stream
Our research shows that value can be successfully identified at an index level using key valuation signals. While both equity index value factor and single stock equity value factor perform worst in market stress environments, the two exhibit a low pairwise-correlation. We believe that this is because the former has a greater exposure to regional macroeconomic factors and less exposure to company-specific profitability.
Our backtested performance analysis also reveals equity index value’s strength as a diversifier. Overall, long-term returns are compelling despite the recent market preference for growth stocks but the strategy excels during periods of macroeconomic recovery. Moreover, drawdown analysis reveals some evidence for low or negative correlation to traditional risk premia, particularly bonds.
Overall, we believe that equity index value offers investors access to a differentiated, and diversifying return stream that can be combined with a broad range of other alternative risk premia to deliver liquid, cost-efficient returns with a low correlation to traditional risk premia.
References
C.Asness, T.Moskowitz, L.Pedersen, ‘Value and Momentum Everywhere’ – Journal of Finance, 68, 929-985.
A.Frazzini, D.Kabiller, L.Pederson, ‘Buffet’s Alpha’ – Financial Analysis Journal, 74, 3555.
 Read more
Important Information
This information is issued by Unigestion (UK) Ltd (“Unigestion”), which is authorised and regulated by the UK Financial Conduct Authority (“FCA”). Unigestion is also registered as an investment adviser with the U.S. Securities and Exchange Commission (“SEC”). This information is intended only for professional clients, institutional clients and eligible counterparties, as defined by the FCA, and qualified purchasers as defined by the SEC and has therefore not been adapted to retail clients.
It must not be published, reproduced, distributed or disclosed (in whole or in part) by recipients to any other person without the prior consent of Unigestion. The information provided should only be considered current as of the date of publication without regard to the date on which you may access the information. Unigestion maintains the right to delete or modify information without prior notice. This presentation is a promotional statement of our investment philosophy and services and does not constitute an offer or solicitation to acquire, sell or subscribe to any securities or financial instruments described or alluded to herein which may be construed as high risk and not readily realisable investments and may experience substantial and sudden loss including total loss of investment. The securities mentioned in this document may not be authorised for public distribution in certain jurisdictions and are not offered or distributed on a public basis in or from any country where such distribution would be prohibited by law. The investments described herein are not suitable for all types of investors. All investors must obtain additional information needed to evaluate a potential investment and provide important disclosures regarding risks, fees and expenses. Investors shall in particular conduct their own analysis of the risks (including any legal, regulatory, tax or other consequence) associated with an investment and should seek independent professional advice.
No separate verification has been made as to the accuracy or completeness of the data included in this presentation, which may have been derived from third party sources, such as fund managers, administrators, custodians and other third party sources. As a result, no representation or warranty, express or implied, is or will be made by Unigestion as regards the information contained herein and no responsibility or liability will be accepted.
The performance figures are based on estimated fees and expenses as well as on the underlying strategy’s estimated performances given by fund managers, administrators, custodians and third party sources at a given date. Past performance is neither guaranteed nor a reliable indicator of future results. The value of investments may go down or up. Where performance is reflected gross of fees, potential investors should be aware that the inclusion of fees, costs and charges will reduce the overall value of performance. An investment with Unigestion, like all investments, contains risks, including the risk of total loss. Unless otherwise stated, the performance data source is Unigestion.
This information is provided to you solely to give you background information relating to Unigestion, certain strategies it implements and currently offers. Before making an investment decision with respect to the strategy discussed herein, potential investors are advised to consult with their tax, legal, ERISA and financial advisors. Note that not all strategies may be available or suitable for investment by U.S. investors.
This document does not purport to be complete and is qualified in its entirety by reference to the more detailed discussions relating to the strategies mentioned. Unigestion has the ability in its sole discretion to change the strategies described herein.
This document is being provided to you on a confidential basis solely to assist you in deciding whether or not to proceed with a further investigation of a strategy or Unigestion. Accordingly, this document may not be reproduced in whole or part, and may not be delivered to any person without the consent of Unigestion.
Nothing set forth herein shall constitute an offer to sell any securities or constitute a solicitation of an offer to purchase any securities. Any such offer to sell or solicitation of an offer to purchase shall be made only by formal offering documents, which include, among others, a confidential offering memorandum, limited partnership agreement (if applicable), investment management agreement (if applicable), operating agreement (if applicable), and related subscription documents (if applicable). Such formal offering documents contain additional information not set forth herein, which such additional information is material to any decision to invest in a strategy.
No information is warranted by Unigestion or its affiliates or subsidiaries as to completeness or accuracy, express or implied, and is subject to change without notice. This document contains forward-looking statements, including observations about markets and industry and regulatory trends as of the original date of this document. Forward-looking statements may be identified by, among other things, the use of words such as “expects,” “anticipates,” “believes,” or “estimates,” or the negatives of these terms, and similar expressions. Forward-looking statements reflect Unigestion’s views as of such date with respect to possible future events. Actual results could differ materially from those in the forward-looking statements as a result of factors beyond a strategy’s or Unigestion’s control. Readers are cautioned not to place undue reliance on such statements. No party has an obligation to update any of the forward-looking statements in this document.
These materials should only be considered current as of the date of publication without regard to the date on which you may receive or access the information. Unigestion maintains the right to delete or modify information without prior notice.
Charts, tables and graphs contained in this document are not intended to be used to assist the reader in determining which securities to buy or sell or when to buy or sell securities.
Return targets or objectives, if any, are used for measurement or comparison purposes and only as a guideline for prospective investors to evaluate a particular investment program’s investment strategies and accompanying information. Targeted returns reflect subjective determinations by Unigestion based on a variety of factors, including, among others, internal modeling, investment strategy, prior performance of similar products (if any), volatility measures, risk tolerance and market conditions. Performance may fluctuate, especially over short periods. Targeted returns should be evaluated over the time period indicated and not over shorter periods. Targeted returns are not intended to be actual performance and should not be relied upon as an indication of actual or future performance.
The past performance of Unigestion, its principals, shareholders, or employees is not indicative of future returns.
Except where otherwise specifically noted, the information contained herein, including performance data and assets under management, relates to the entire affiliated group of Unigestion entities over time including that of Unigestion UK. Such information is intended to provide the reader with background regarding the services, investment strategies and personnel of the Unigestion entities. No guarantee is made that all or any of the individuals involved in generating the performance on behalf the other Unigestion entities will be involved in managing any client account on behalf of Unigestion U.K. More specific information regarding Unigestion UK is set forth herein where indicated and is available on request.
There is no guarantee that Unigestion will be successful in achieving any investment objectives. An investment strategy contains risks, including the risk of complete loss.
The risk management practices and methods described herein are for illustrative purposes only and are subject to modification.
Data and graphical information herein are for information only and may have been derived from third party sources. Unigestion takes reasonable steps to verify, but does not guarantee, the accuracy and completeness of this information. As a result, no representation or warranty, expressed or implied, is or will be made by Unigestion in this respect and no responsibility or liability is or will be accepted. Unless otherwise stated, sources are Unigestion, Bloomberg and Compustat.
For US investors, Unigestion is relying on SEC Rule 15a-6 under the Securities Exchange Act of 1934 regarding exemptions from broker-dealer registration for foreign broker dealers. Foreside Global Services, LLC is acting as the chaperoning broker dealer for Unigestion for the purposes of soliciting and effecting transactions with or for U.S. institutional investors or major U.S. institutional investors.
Backtested or simulated performance is not an indicator of future actual results. The results reflect performance of a strategy not currently offered to any investor and do not represent returns that any investor actually attained. Backtested results are calculated by the retroactive application of a model constructed on the basis of historical data and based on assumptions integral to the model which may or may not be testable and are subject to losses.
Data set used for backtested simulations are all in USD, gross of management fees and net of estimated transaction costs, from October 1999 to December 2018. The backtested information is used to show and analyse the behaviour of the value strategy applied to a universe of indices rather than single stocks, over a long period. Indices used are: Equities: MSCI World Net Total Return Local Index, Bonds: Bloomberg Barclays Global 7-10 Year USD Hedged.
Changes in these assumptions may have a material impact on the backtested returns presented. Certain assumptions have been made for modeling purposes and are unlikely to be realized. No representations and warranties are made as to the reasonableness of the assumptions. This information is provided for illustrative purposes only. Backtested performance is developed with the benefit of hindsight and has inherent limitations. Specifically, backtested results do not reflect actual trading or the effect of material economic and market factors on the decision-making process. Since trades have not actually been executed, results may have under- or over-compensated for the impact, if any, of certain market factors, such as lack of liquidity, and may not reflect the impact that certain economic or market factors may have had on the decision-making process. Further, backtesting allows the security selection methodology to be adjusted until past returns are maximized. Actual performance may differ significantly from backtested performance.