After four consecutive months of uninterrupted price rises in equity markets, after the massive and combined intervention of governments and central banks around the world that supported this rebound, after a hitherto unthinkable lockdown of half of the planet, it is time to establish the balance of risks, to distinguish what has been correctly anticipated from what cannot yet be assessed, and to consider short-term risks in a broader perspective. Although we continue to believe in a “V-shaped” scenario for the global economy due to the exogenous aspect of the shock and the continued, unprecedented support from financial and political authorities, the short term seems more mixed. We believe there are a number of technical elements that could affect market sentiment in the coming weeks. As a result, we are moderating our overweight in growth assets and considering more hedging strategies within our multi asset portfolios.

Should I Stay Or Should I Go

While the S&P 500 index returned to its early January level, the rise in equity markets was more even in July than in previous months. The dispersion between styles, sectors and countries was thus more limited. For example, the MSCI World and the MSCI World Equal Weighted indices delivered similar performance in July until the last three days of the month, while the former has outperformed the latter by 8.2% since the beginning of the year. Another example: the MSCI World Tech was not the best-performing sector this month. Although it delivered a positive performance for the month (+5.9%), the MSCI World Utilities delivered a better return (6.9%). Historically, a broader and more global participation in the rally is a positive signal for the future performance of equity indices. However, despite this positive sign, we believe that the balance of risks for the coming weeks has deteriorated for several reasons: The first is the rally’s momentum. The S&P 500 has gained momentum over the last four months, delivering a performance of 24.5% compared to 12.5% on average for every increase of at least four consecutive months in the index since 1970. What signal does this rebound send us? Since 1970, four or more consecutive months of increase in the S&P 500 index has only happened 15% of the time. The average return for the three months following such a rally is slightly less than normal. The performance is 1.9% with a hit ratio of 69% against 2.1% and a hit ratio of 67% for the whole period. Nothing exciting therefore in the short term. Over the longer term, the situation looks much better. By extending the horizon to 12 months, the average yield rises to 10.7% with a hit ratio of 86.5%, which is much better than normal. This validates our scenario of a short-term pause that does not call into question our positive view in the longer term. The second element that may reduce short-term attractiveness is the seasonality of August. For all the indices we have analysed (S&P 500, Euro Stoxx and MSCI Emerging Markets), August is the worst month in terms of performance. This concerns the absolute performance over the month (negative on average since 1970), the hit ratio, and the average performance when the month is negative. The situation has deteriorated further since 2009 and the monetary paradigm shift. On average since 1990, the probability of a negative performance in August is 50% for the three indices versus 40% for all months. From 2009, this probability rises to 63% for August while the probability for all months remains at 40%. When August performance is negative, the magnitude is much greater than for the other months due to low liquidity in particular (-4.6% on average vs. -3.8% for the whole period). The last element concerns the health situation, whose curve has been reversed on a global scale with a resurgence in the number of cases and the implementation of containment measures, albeit localised, but steadily increasing throughout the world. The anticipation of a second wave with the arrival of autumn could lead investors to take their profits after a strong rebound and wait for better visibility on the health front before reallocating risk in favour of growth assets. As an echo to this scenario, our Newscaster indicator, which tracks growth-related coverage across a broad spectrum of communications, has declined in recent days, reflecting increased fears of a further macroeconomic slowdown. This dynamic risk management could occur before September and weigh on markets in the coming weeks. These technical elements could be amplified in the short term by two issues that characterise current market sentiment. The first concerns highly concentrated positioning. Many indicators reflect this concentration: the number of stocks replicating the performance of the S&P 500 at its lowest level since 1970; the extraordinary contribution of the five largest contributors to the total performance of the S&P 500 in 2020; and the sharp increase in the correlation between assets and between factors (quality, size, value, momentum, low vol). Our average correlation indicator between the main assets, including bonds, equities, commodities and major currencies, remains in the last decile after hitting a high since 1998 in March 2020. The correlation between gold and global equities is at an all-time high (80%) while the correlation between equities and the trade-weighted US dollar index is at its lowest level (-80%). Since 1998, these correlations have been observed only twice, in December 2009 after a 61% rally in the S&P 500 and in March 2012 after a 25% rebound in the index. In both cases, the upward momentum has slowed significantly for equities. This situation also illustrates the lack of diversification and reflects the fact that the rise in recent months is based on only a very limited number of factors (central bank liquidity injection; momentum and passive investment; lower real rates), if not just one (liquidity impulse). This situation increases the risk of a sudden liquidity crash if this limited number of factors were to be reversed, a risk accentuated by the poor liquidity offered in August due to the absence of many players who have gone on holiday. In short, any idiosyncratic shock that could affect the limited number of positive factors would turn into a more systemic shock due to the dependence of the global indices on these rare factors. The second factor that concerns us is the correlation between positive news and market reaction. In a bull market, macro or micro news with a positive surprise tends to generate an increase when it is published, whereas negative elements affect short-term performance less. Over the last few weeks, we have seen the opposite situation. Despite positive earnings results for companies in the second quarter, the stocks of the companies that made the most progress in the rebound fell following the announcement of the results. Similarly, since the unprecedented agreement on the European recovery plan, European equities have significantly underperformed other markets, reflecting anticipation of the agreement and profit-taking when it was formalised. This type of relationship between news and market pricing shows that in the absence of a major positive factor, the upside potential for risky assets appears limited in the short term. Finally, the message from the US yield curve calls into question the current pace of the equity rally. Historically, the yield curve reverses as activity increases and monetary policy tightens (short rate hike). It tends to steepen when activity has slowed and monetary policy has eased significantly. Since 1970, the spread averaged 142 basis points at the bottom of the easing cycle. While the Fed cut rates to an all-time low in March 2020, the current slope is only 41 basis points. This “flat” slope shows the low conviction of financial players in pricing a return to growth in the medium term. Consequently, without a net significant repricing of the growth and inflation premium, the rise in the equity market will be either limited or very fragile in the short term. Are these technical factors likely to call into question our conviction of a “V-shaped” economic recovery over the next 12 months that we have been anticipating for several months? Our answer is a clear ‘no’. The fundamental supports for an economic recovery are still very present in our eyes. It is their integration into prices and investor expectations that has changed over the last few months, not the extent of their positive medium-term effects. In this context, a correction in risky assets of between 5% and 10% over the next few weeks will be seen as an opportunity to increase our risk rather than as a signal of a second downturn in the markets, similar to the one observed in March. The elements justifying this conviction are 1) a continued and potentially increased presence of governments and central banks. Whether on the fiscal or monetary front, there are still opportunities to increase support and thus limit the extent of a potential decline. The US Treasury has raised 8% of its GDP already while Germany has raised 3% and this support implies economic relief in 2020; 2) a valuation of risky assets that is still attractive over the medium term due to the low level of interest rates. In a context of zero or negative interest rates, the most expensive assets are defensive assets, not growth assets. Regardless of the model used (Discount Factor Model, Cross Sectional Carry model or Fed Model) to compare the attractiveness of equities to sovereign bonds, the result is the same, equities have an attractive profile and should push long-term investors to increase their allocation once visibility improves. Moreover, savings rates are high while cash levels across corporates has increased; 3) the wider the horizon, the greater the likelihood that the “vaccine” and “second lockdown” scenarios will be reversed in favour of the positive case of a generalised vaccination. While the uncertainty concerning the vaccine remains high at 3-6 months, it is almost zero over a 12-month horizon. To date, this scenario is more positive for the health sector than for the sectors most affected by containment measures. The massive underperformance of sectors such as “Banks” and “Aeronautics/Airlines” in the rebound underscores the extent to which the positive scenario is poorly anticipated at the macroeconomic level. However, the cyclical improvement that we are seeing through our Nowscasters is widespread across all components and countries, and the arrival of a vaccine would only reinforce its sustainability.What’s Next?
Seasonality and technical factors ….
… could affect fragile market sentiment
Nevertheless, a correction can be seen as an opportunity
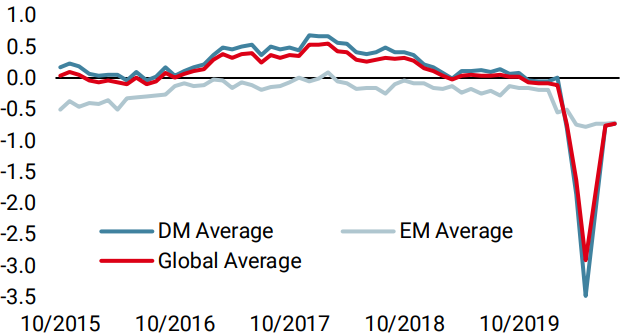
Unigestion Nowcasting
World Growth Nowcaster
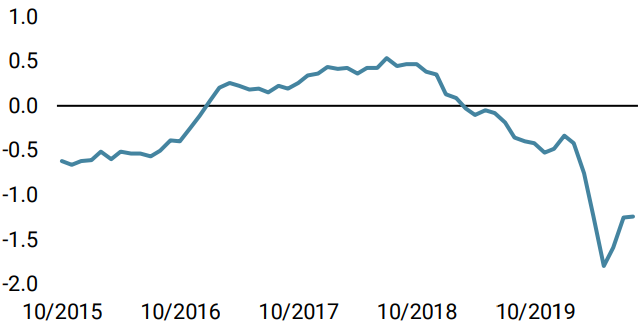
World Inflation Nowcaster
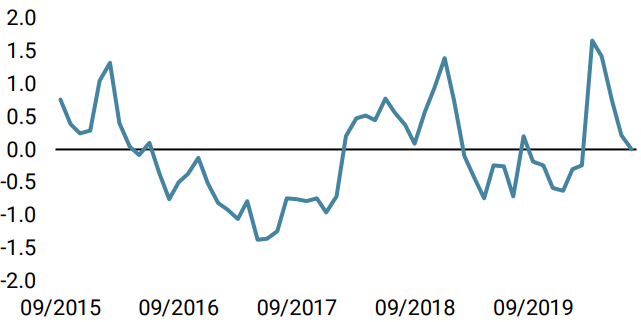
Market Stress Nowcaster
Weekly Change
- Our world Growth Nowcaster was up slightly over the week, as the broad improvement in the macroeconomy continues.
- Our world Inflation Nowcaster was flat over the week, as increasing inflation pressures in the US and UK were offset by lower pressures in the Eurozone.
- Our Market Stress Nowcaster moved up slightly over the week on the back of less supportive liquidity conditions.
Sources: Unigestion. Bloomberg, as of 3 August 2020.
Important Information
This document is provided to you on a confidential basis and must not be distributed, published, reproduced or disclosed, in whole or part, to any other person.
The information and data presented in this document may discuss general market activity or industry trends but is not intended to be relied upon as a forecast, research or investment advice. It is not a financial promotion and represents no offer, solicitation or recommendation of any kind, to invest in the strategies or in the investment vehicles it refers to. Some of the investment strategies described or alluded to herein may be construed as high risk and not readily realisable investments, which may experience substantial and sudden losses including total loss of investment.
The investment views, economic and market opinions or analysis expressed in this document present Unigestion’s judgement as at the date of publication without regard to the date on which you may access the information. There is no guarantee that these views and opinions expressed will be correct nor do they purport to be a complete description of the securities, markets and developments referred to in it. All information provided here is subject to change without notice. To the extent that this report contains statements about the future, such statements are forward-looking and subject to a number of risks and uncertainties, including, but not limited to, the impact of competitive products, market acceptance risks and other risks.
Data and graphical information herein are for information only and may have been derived from third party sources. Although we believe that the information obtained from public and third party sources to be reliable, we have not independently verified it and we therefore cannot guarantee its accuracy or completeness. As a result, no representation or warranty, expressed or implied, is or will be made by Unigestion in this respect and no responsibility or liability is or will be accepted. Unless otherwise stated, source is Unigestion. Past performance is not a guide to future performance. All investments contain risks, including total loss for the investor.
Unigestion SA is authorised and regulated by the Swiss Financial Market Supervisory Authority (FINMA). Unigestion (UK) Ltd. is authorised and regulated by the UK Financial Conduct Authority (FCA) and is registered with the Securities and Exchange Commission (SEC). Unigestion Asset Management (France) S.A. is authorised and regulated by the French “Autorité des Marchés Financiers” (AMF). Unigestion Asset Management (Canada) Inc., with offices in Toronto and Montreal, is registered as a portfolio manager and/or exempt market dealer in nine provinces across Canada and also as an investment fund manager in Ontario and Quebec. Its principal regulator is the Ontario Securities Commission (OSC). Unigestion Asia Pte Limited is authorised and regulated by the Monetary Authority of Singapore (MAS). Unigestion Asset Management (Copenhagen) is co-regulated by the “Autorité des Marchés Financiers” (AMF) and the “Danish Financial Supervisory Authority” (DFSA). Unigestion Asset Management (Düsseldorf) SA is co-regulated by the “Autorité des Marchés Financiers” (AMF) and the “Bundesanstalt für Finanzdienstleistungsaufsicht” (BAFIN).