Equity markets continued their rally in November, with the MSCI World index returning 2.8% in USD. To date, 2019 has been a great year for global stocks, with the index delivering 24% in USD – the 10th best annual return since 1970. Historically, such a return for equities has been driven by macroeconomic acceleration, an increase in corporate profitability or a positive shock such as globalisation or technological innovation. However, this time it has been different, with global growth low, earnings per share unchanged and geopolitical uncertainties and polarisation on the rise. Is the current bullish trend unbreakable? We believe that market conditions should remain favourable for risky assets thanks to supportive monetary policy. Nevertheless, while our market sentiment song has shifted from “Paint it, Black” in August to “Can’t Stop” in November, the risk of complacency is now higher, requiring a deeper analysis of what is and isn’t priced in.Equities: is political risk fairly priced in?
Unbreakable – Michael Jackson, 2001

Unbreakable

Contrary to previous months, when lower risk aversion triggered by positive news on both the trade war and Brexit supported the risky asset rally, November’s performance was led by a rising growth premium. Three elements illustrate this. Firstly, the MSCI World Growth index (+3.4%) outperformed the MSCI World index (+2.8%). Secondly, reflation pushed sovereign bond yields higher, with a rise in both the main premiums embedded in sovereign bonds – inflation and growth. US bond yields increased from 1.7% to 1.8%, while European bond yields rose by 10 bps across the curve. Thirdly, cyclical commodities were stronger, with oil (+3.2%) and copper (+0.6%) both gaining, while precious metals such as gold (-3.2%) declined. Beneath the surface of positive returns for risky assets, dispersion across sectors and regions was large. US equities outperformed the rest of the world, while emerging equities lagged developed ones. In terms of sectors, the MSCI World IT index delivered a 5.2% monthly return, pushing year-to-date performance up to 39%, while the MSCI World Utilities index declined by 2.2%. Regarding style, investors rewarded Quality at the expense of Minimum Volatility, while Momentum, Value and Size were in line with the market. In the FX market, the global picture was mixed. High yield emerging currencies did not benefit from the rise in the growth premium, except for the South African rand which strengthened by 2.6% vs the USD. Latam currencies underperformed significantly, led by a 5% decline in the Brazilian real and a 9% fall in the Chilean peso. Asian currencies were, on average, stable versus the USD. Within developed market currencies, rising interest rates supported the USD, helping it strengthen across the board except against the Swedish krona. Regarding our active asset allocation framework that aims to track the main risk factors driving asset returns in the long term, what has changed compared to the previous month? Although we are repricing in recession risk, and seeing diminishing risk-off sentiment and less attractive valuations for growth-oriented assets, our tactical asset allocation remains unchanged: 1) a positive view on equities and 2) a cautious stance on the usual hedges such as duration and precious metals. Nevertheless, the number and the amplitude of positive factors that prompted us in early September to adopt a tilt toward growth assets in our portfolios have receded after a rally for three consecutive months. Back in mid-August, global sentiment was very negative, as reflected by an inversed yield curve, the proportion of negative bond yields in the Barclays Global Aggregate universe and the high level of the VIX (24). Investors were pricing in a major economic slowdown, with a high probability of Brexit and trade war escalation. Three months later, the VIX is back to levels seen during the best periods of the “Goldilocks” era (12) and realised volatility remains historically low for most assets and macro data. More importantly, according to market pricing, political tail risks seem to have disappeared, as illustrated by the strength of the GBP and the decline of its implied 1-year volatility (8.3% vs 11% in August). Although not fully de-priced, the trade war risk has also sharply receded, as reflected by the low level of 3-month implied volatility for the Hang Seng China Enterprise index (16%). This level represents the 13th percentile over the last 12 months despite extreme and increasing tensions in Hong Kong and an unsigned Stage 1 deal. The muted reaction of global equities to negative headlines from Asia confirms the risk of complacency regarding policy mistakes is now high. Moreover, while some Democrat candidates for the US presidency seem to favour more regulation and higher taxes, the targeted sectors did not underperform. This mispricing of political risk is a clear change in our narrative and will limit our overweight in growth-oriented assets. Regarding macro risks, the situation is still stabilising. Our proprietary Growth Nowcaster shows global growth at slightly below its potential. Consumption and housing are the largest contributors to stabilisation, benefiting from an easing in monetary policy conditions triggered by the Fed’s rate cuts in 2019. Surveys bottomed recently, with a clear discrimination between services in good shape and manufacturing suffering from global trade collapse. However, despite this stabilisation in macroeconomic momentum since September, investors do not appear to believe in an extension of the current cycle and continue to price in a marked slowdown in the coming quarters, as reflected by monetary policy expectations for major central banks. Current pricing shows at least one cut in the US, Australia, Canada, Japan, New Zealand and the UK over the next 12 months. We believe that this pricing underestimates the rebound of the global economy that we expect in 2020 on the back of solid consumption and the housing market. Our analysis, which compares the current US situation to 1995-1996 and 1999-2001, finds large similarities with the mid-cycle context (1995-1996) and no common element with past US recessions. We share the Fed view about the economic outlook and are more positive than the consensus about macro risks. In our view, the macro context should remain supportive for risky assets in the coming months because we believe: 1) activity and inflation should not become tailwinds next year and 2) policy mix should continue to be very supportive.What’s Next?
Growth premium pushed risky assets higher in November
What has changed?
Policy mistakes are now underpriced
Global slowdown still overpriced

On the valuation side, investors tend to be nervous when they face rising P/E ratios and high expected earnings growth for next year. After a three-month rally, clearly the valuation factor is no longer a support for growth-oriented assets. Nevertheless, the risk, in our view, is not coming from the numerator of the equation (future cash flows). The key risk is in the denominator (the actualisation factor, i.e. interest rates). Since 2010, absolute returns for most assets have been boosted by liquidity injections and then lower rates, not by an exceptional period of expansion. Sensitivity to duration is now increasing everywhere, from fixed income products through to equities, private equity and private debt. Low rates have a double impact on non-fixed income assets. Firstly, they improve expected cash flow through the discount factor. Secondly, they reduce the probability and the impact of tail risk events. Simple numbers confirm this relationship: between 1988 and 2009, the average yearly performance of the S&P 500 Total Return index in excess of Fed rates has been 7.1%. Since 2010, it has been 13%. We observe a similar extra boost in US equity returns in excess of US GDP or US inflation. In our view, this “implied convexity” puts a clear risk for the future in case of significant expansion. Studies from the NY Fed1 about Taylor rules and natural rates of interest show that current Fed policy is very accommodative relative to history. The situation is similar in Japan, Europe and the UK. Therefore, if growth-oriented assets are being supported by low interest rates, then higher rates are the obvious risk not lower rates, and these would occur in the case of a market slowdown. Tactically, adding relative value trades able to perform in a rising rate environment would make sense in order to maintain a certain level of exposure to growth-oriented assets. Financial sectors, break even inflation or curve steepening are usually good strategies to smooth returns in such an environment. Moreover, both would also benefit from the improvement in global growth that we expect for next year. In conclusion, let’s continue to dance on the positive note but with a lower rhythm and tempo than in previous months.Higher rates is the main risk, not lower growth
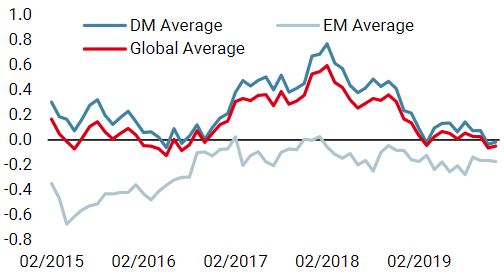
Unigestion Nowcasting
World Growth Nowcaster
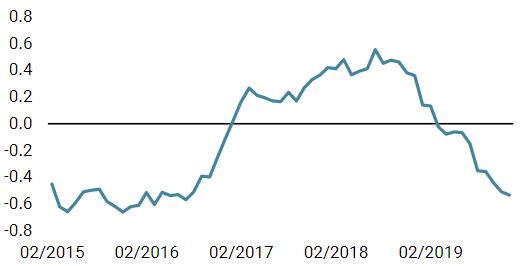
World Inflation Nowcaster
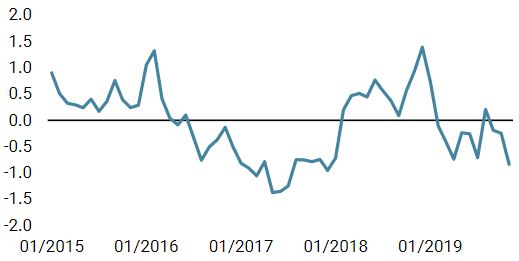
Market Stress Nowcaster
Weekly Change
- Our world Growth Nowcaster declined last week. However, 49% of the data is still improving: growth stabilisation remains on the cards.
- Our world Inflation Nowcaster decreased again last week. Inflation risk is very low.
- Market stress remained stable last week: market stress risk is low.
Sources: Unigestion. Bloomberg, as of 2 December 2019.
1 https://www.federalreserve.gov/monetarypolicy/2019-07-mpr-part2.htm and https://www.newyorkfed.org/research/policy/rstar
Important Information
This document is provided to you on a confidential basis and must not be distributed, published, reproduced or disclosed, in whole or part, to any other person.
The information and data presented in this document may discuss general market activity or industry trends but is not intended to be relied upon as a forecast, research or investment advice. It is not a financial promotion and represents no offer, solicitation or recommendation of any kind, to invest in the strategies or in the investment vehicles it refers to. Some of the investment strategies described or alluded to herein may be construed as high risk and not readily realisable investments, which may experience substantial and sudden losses including total loss of investment.
The investment views, economic and market opinions or analysis expressed in this document present Unigestion’s judgement as at the date of publication without regard to the date on which you may access the information. There is no guarantee that these views and opinions expressed will be correct nor do they purport to be a complete description of the securities, markets and developments referred to in it. All information provided here is subject to change without notice. To the extent that this report contains statements about the future, such statements are forward-looking and subject to a number of risks and uncertainties, including, but not limited to, the impact of competitive products, market acceptance risks and other risks.
Data and graphical information herein are for information only and may have been derived from third party sources. Although we believe that the information obtained from public and third party sources to be reliable, we have not independently verified it and we therefore cannot guarantee its accuracy or completeness. As a result, no representation or warranty, expressed or implied, is or will be made by Unigestion in this respect and no responsibility or liability is or will be accepted. Unless otherwise stated, source is Unigestion. Past performance is not a guide to future performance. All investments contain risks, including total loss for the investor.
Unigestion SA is authorised and regulated by the Swiss Financial Market Supervisory Authority (FINMA). Unigestion (UK) Ltd. is authorised and regulated by the UK Financial Conduct Authority (FCA) and is registered with the Securities and Exchange Commission (SEC). Unigestion Asset Management (France) S.A. is authorised and regulated by the French “Autorité des Marchés Financiers” (AMF). Unigestion Asset Management (Canada) Inc., with offices in Toronto and Montreal, is registered as a portfolio manager and/or exempt market dealer in nine provinces across Canada and also as an investment fund manager in Ontario and Quebec. Its principal regulator is the Ontario Securities Commission (OSC). Unigestion Asia Pte Limited is authorised and regulated by the Monetary Authority of Singapore (MAS). Unigestion Asset Management (Copenhagen) is co-regulated by the “Autorité des Marchés Financiers” (AMF) and the “Danish Financial Supervisory Authority” (DFSA). Unigestion Asset Management (Düsseldorf) SA is co-regulated by the “Autorité des Marchés Financiers” (AMF) and the “Bundesanstalt für Finanzdienstleistungsaufsicht” (BAFIN).