November threatened to be a month of perils and pitfalls, but turned out to be a month of clarification. The decisive outcome in the American elections and the prospect of vaccines for Covid-19 have greatly brightened the political, health and economic horizons. This reduction in uncertainty led to a spike in risky assets and an extreme rotation across sectors and factors. Can this rotation, which was largely determined by technical factors, be maintained? Is it time to move from “clicks” back to “Old Yellow Bricks”? History shows that it is possible, but one element seems indispensable: a significant drop in precautionary savings, accumulated in recent months, and a return of the inflation premium.

Old Yellow Bricks

What’s Next?
Revenge of the losers
The MSCI AC World index achieved its best monthly performance ever with a return of 12.3% in November, surpassing its previous record in April 2009 (11.8%), but geographical, sector and factor dispersion was extreme. In short, November was marked by the revenge of the losers. European stocks, which had been underperforming US and Japanese counterparts since the beginning of the year, gained 18% on the Euro Stoxx 50 index versus 11% for the S&P 500 index. The MSCI China index, one of the best performers of the year, rose just 2.7% in November, highlighting that the winners in 2020 thus far were definitely not the same as in November. The dispersion was even greater at the sector level as the companies most affected economically by the health crisis rebounded the most over the month. The MSCI World Energy and Financial indices posted gains of 29% and 19% respectively, while defensive sectors such as the MSCI World Utilities (5.4%) underperformed significantly. Unsurprisingly, the Value factor was the main beneficiary of this rotation with a 15% increase over the month for the MSCI World Value while the MSCI Minimum Volatility was up only 7% and the MSCI World Momentum, 9.8%. This rotation was not limited to equity markets: in credit, the high yield (HY) CCC index outperformed the HY BB index while in commodities, Energy increased 3.5% versus a 5% decrease in Precious Metals.
The clarity resulting from the US elections and the imminent availability of several vaccines were the main drivers of this rotation. On one hand, these elements have reduced risk aversion since the risk of a major political crisis has dissipated in the US. On the other, the absence of a “Blue Wave” moderates the risk of a tax increase for companies and therefore improves visibility on profits in the years to come. Finally, the prospects for a health solution by 2021 provide greater visibility for the sectors and companies most affected by the containment. As a reflection of this decline in risk aversion, the VIX future for December declined from 36 to 22 over the month.
In addition to positive fundamentals, technical factors also helped to exacerbate dispersion within asset classes. Investors were very negatively positioned on the sectors weakened the most by the crisis, such as Energy, Tourism and Banking. The reduction in this positioning, called “short covering”, thus contributed greatly to the rotation observed over the month. Our analysis shows that the short positions of the main equity factors outperformed most of the long positions of the same factor. In November, the stocks that made up the short part of the Momentum factor rose by an average of 19%, while those making up the long part rose only 10.1%. The dispersion was even wider within the Low Vol factor, with a 23% increase in short securities compared to 8.7% for securities in the long part. November thus seems to have been a “junk rally”, boosted by a combination of “short squeeze” and “risk on” trades. Can this trend last?
What does history teach us?
In order to answer the question of the sustainability of this rotation, we analysed the performance of the S&P 500 sectors since 1990. We define periods of rotation as one that sees a relative outperformance (in price return) of the S&P 500 Equal Weighted index versus the S&P 500 (‘market-cap weighted’) index and significant sector movements measured by the relative monthly performance of a sector versus the market cap index. We find three major episodes of rotation. All three periods feature a significant outperformance of the equal weighted index over the market cap index as well as monthly sectorial variations greater than 3 or 4 sigma.
The first period began in March 2000 with the bursting of the “internet bubble”. This rotation occurred at the peak of the market and took place in a bear market. The rotation resulted from a smaller decline in defensive sectors such as Healthcare, Financials and Consumer Staples relative to the IT sector, which massively outperformed the bull market. This was a bearish mean-reverting movement that could be described as “normalisation of valuation”.
The second episode took place in March 2009, and came at the bottom of the market after the Energy and Consumer Staples sectors in particular had outperformed the market. This rotation was the result of two elements: an outperformance of growth sectors such as Consumer Discretionary and IT, and significant underperformance in the Financial sector. This phase is more in line with a bullish mean reversion or a “normalisation of the growth premium”.
The last episode is this year, which begins in September after a significant performance of the IT sector observable since 2017. Since September, the S&P 500 Equal Weighted index has outperformed the market cap index by 6.6% with three consecutive monthly relative performances above 1 sigma. In addition, in November, the Energy sector recorded its second best relative performance since 1990 (+15.8%) and the Utilities sector posted one of its worst performances with an underperformance against the index of -10.5%. Although we are far from the bottom of the US equity market, the current phase is more similar to 2009 since it is the result of laggard sectors catching up and not of a significant decline in the outperformers. Therefore, we are more in a framework of normalisation of sector and factor performance than in a movement of overvaluation adjustment, as in 2000.
What is the market pricing in?
Despite the strong sector and factor rotation observed recently, the winners of 2020 remain the same: US and Chinese equities, the IT sector and the Momentum factor. The laggards also remain the same: European equities, the Energy and Financial sectors and the Value factor. This ranking illustrates that, at this stage, market expectations remain moderate in terms of rotation. An analysis of analyst expectations for 2021 profits by sector, however, highlights a significant potential for catching up, both geographically and by sector. Thus, the consensus is that Euro Stoxx 50 earnings are expected to increase by between 40% and 50% next year, compared to around 20% for S&P 500 stocks. In terms of sectors, the strongest variations in profits are expected for the sectors having suffered most in 2020, namely Energy, Financials and Industrials, while the weakest concern the more defensive sectors that have performed well this year, such as Telecoms, IT and Staples.
What we believe
The sharp decline in uncertainty, a result of both the US elections and the rapid introduction of several vaccines, will give visibility to companies and households that can now invest and consume in a more stable environment. Thanks to a very accommodating policy mix, we expect the cyclical rebound to continue in the coming quarters and drive broad improvement in fundamentals. These elements, confirmed by our Nowcasters and Newscaster indicators, support a positive view in favour of cyclical assets.
However, our analysis of sector and factor rotation phases underlines that one element is crucial to this rotation: the increase in the inflation premium. On a macro point of view, this is understandable since inflationary pressures are the consequence of a strong increase in household and business demand, which in turn leads to higher production prices and wages. We also observe that during the two major rotation phases, the slope of US rates steepened sharply and inflation break evens increased over the period. While these two elements have been on a positive trend for the past few months, their rebound is still too far removed from previous periods. It will therefore take some time, particularly to see an upturn in capacity utilisation levels as illustrated by the recent BIS paper that highlights that: “The persistent slump in GDP does not reflect a lack of policy stimulus, but rather a lower level of potential output”. Nevertheless, the normalisation of the economy is, in our view, ongoing with significant potential given the high level of household savings rates (18% in the US, 24% in Europe) and available liquidity, the result of the expansion of central bank balance sheets.
Given current valuations, both cross sectional and historical, we favour both real and cyclical assets on expectations of a global reflation of the economy. These tactical elements thus lead us to favour HY credit, developed equities, inflation break evens and cyclical commodities in our portfolios to the detriment of sovereign bonds, precious metals and the US dollar.
Unigestion Nowcasting
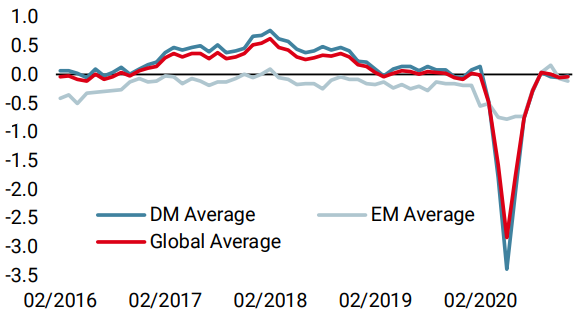
World Growth Nowcaster
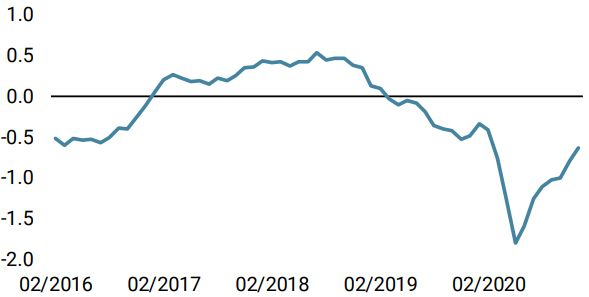
World Inflation Nowcaster
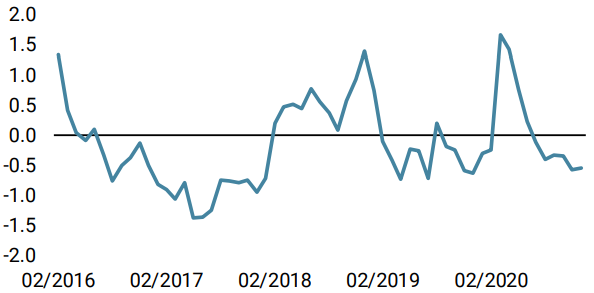
Market Stress Nowcaster
Weekly Change
- Our World Growth Nowcaster decreased last week, as European and Chinese data deteriorated. European data simply reflects the impact of the lockdowns while Chinese data is more noise than signal for the moment. Recession risk remains low.
- Our World Inflation Nowcaster increased slightly last week with the majority of countries showing rising inflation pressures. For now, this is more a normalisation than an acceleration of inflation pressures: inflation surprise risk remains neutral.
- Last week, our Market Stress Nowcaster remained unchanged: volatility has room to decline further while spreads should follow suit.
Sources: Unigestion. Bloomberg, as of 07 December 2020.
Important Information
This document is provided to you on a confidential basis and must not be distributed, published, reproduced or disclosed, in whole or part, to any other person.
The information and data presented in this document may discuss general market activity or industry trends but is not intended to be relied upon as a forecast, research or investment advice. It is not a financial promotion and represents no offer, solicitation or recommendation of any kind, to invest in the strategies or in the investment vehicles it refers to. Some of the investment strategies described or alluded to herein may be construed as high risk and not readily realisable investments, which may experience substantial and sudden losses including total loss of investment.
The investment views, economic and market opinions or analysis expressed in this document present Unigestion’s judgement as at the date of publication without regard to the date on which you may access the information. There is no guarantee that these views and opinions expressed will be correct nor do they purport to be a complete description of the securities, markets and developments referred to in it. All information provided here is subject to change without notice. To the extent that this report contains statements about the future, such statements are forward-looking and subject to a number of risks and uncertainties, including, but not limited to, the impact of competitive products, market acceptance risks and other risks.
Data and graphical information herein are for information only and may have been derived from third party sources. Although we believe that the information obtained from public and third party sources to be reliable, we have not independently verified it and we therefore cannot guarantee its accuracy or completeness. As a result, no representation or warranty, expressed or implied, is or will be made by Unigestion in this respect and no responsibility or liability is or will be accepted. Unless otherwise stated, source is Unigestion. Past performance is not a guide to future performance. All investments contain risks, including total loss for the investor.
Unigestion SA is authorised and regulated by the Swiss Financial Market Supervisory Authority (FINMA). Unigestion (UK) Ltd. is authorised and regulated by the UK Financial Conduct Authority (FCA) and is registered with the Securities and Exchange Commission (SEC). Unigestion Asset Management (France) S.A. is authorised and regulated by the French “Autorité des Marchés Financiers” (AMF). Unigestion Asset Management (Canada) Inc., with offices in Toronto and Montreal, is registered as a portfolio manager and/or exempt market dealer in nine provinces across Canada and also as an investment fund manager in Ontario and Quebec. Its principal regulator is the Ontario Securities Commission (OSC). Unigestion Asia Pte Limited is authorised and regulated by the Monetary Authority of Singapore (MAS). Unigestion Asset Management (Copenhagen) is co-regulated by the “Autorité des Marchés Financiers” (AMF) and the “Danish Financial Supervisory Authority” (DFSA). Unigestion Asset Management (Düsseldorf) SA is co-regulated by the “Autorité des Marchés Financiers” (AMF) and the “Bundesanstalt für Finanzdienstleistungsaufsicht” (BAFIN).