MiViews Q1 2020: It ain’t over ‘til it’s over
- Although the global economy has been slowing for 15 months, we do not believe a recession is on the cards.
- With inflation nowhere to be found, we expect central banks to remain dovish, offering continued support to financial markets.
- While the outlook for growth-oriented assets remains positive, valuations are one area of concern.
- Within our multi-asset portfolios, our preference is for equities and credit, but with much higher discrimination than in the past.
Overview
The global economy has been slowing down since mid-2018. US financial tightening implemented last year, the decline in global trade growth observed since 2016 and weak activity in Europe have been the main triggers, driving the negative trend over the last 15 months. In addition to weaker activity, rising tensions between the US and China also drove uncertainty higher, negatively impacting investment perspectives and production expectations.
Despite this broad economic slowdown, 2019 to date has been a great year for global stocks, with the MSCI World Index on track for its tenth best annual return since 1970. Historically, such a return for equities has been driven by macroeconomic acceleration, an increase in corporate profitability or a positive shock such as globalisation or technological innovation. However, this time the backdrop has been one of slower global growth, unchanged earnings per share and a rise in geopolitical uncertainties and polarisation.
A key difference this year has been a globally coordinated central bank shift to a more stimulative stance that served to push growth assets higher. We believe that central bank policy is likely to remain supportive in light of muted inflation pressures that show no sign of increasing. However, the sustained rally has pushed valuations up to levels that we believe are concerning in some areas and 2020’s global political calendar will likely weigh heavily on investor sentiment. Against this backdrop, we favour carry-related growth assets but with a highly discriminatory approach to asset selection.
Mid-Cycle or Late Cycle?
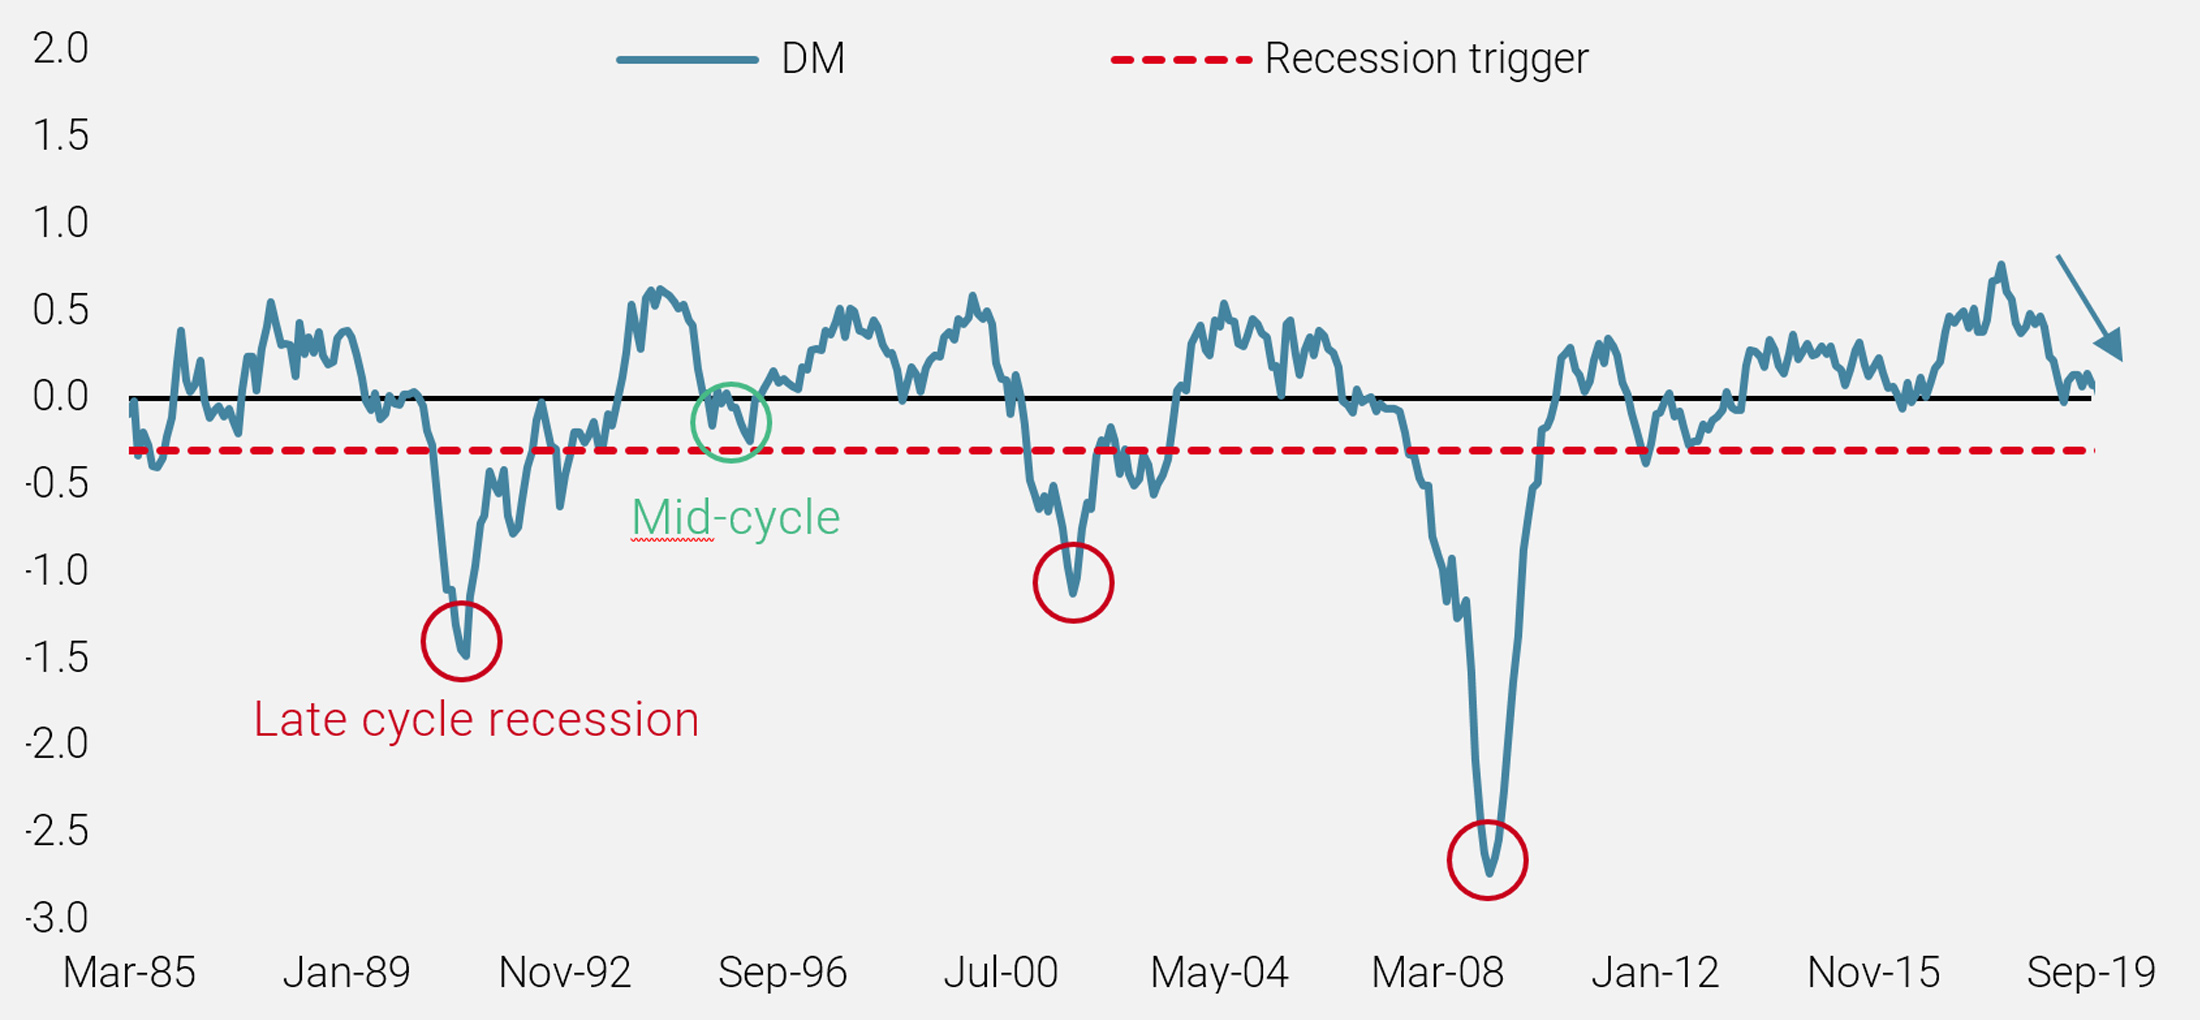
Our proprietary World Growth Nowcaster tracks the global economy in real time to assess whether the probability of recession is rising or not. As Figure 1 shows, we are currently at a critical juncture. Either the global economy is bottoming and will recover in 2020, or the negative trend which pushed our World Growth Nowcaster below zero in November will continue, leading to recession within the next 12 months. Are we looking at a repetition of a mid-cycle slowdown, as seen in 1995–1996, or a less rosy scenario leading to a new recession, similar to 1989–1990 and 2000–2001?
Figure 1: World Growth Nowcaster
Where Are We Today?
Despite the current economic slowdown, our conviction is that we are far from recession. Firstly, recession historically entails negative GDP growth, falling employment, muted wage growth and poor housing investment. Secondly, recession typically comes from two key elements: 1) An economic unbalance between supply and demand. This can come from monetary policy tightening, which aims to prevent economic overheating by controlling the demand side, or from a shock in supply, which pushes inflation to unsustainable levels. 2) An asset bubble that bursts because financial pricing has diverged from the real economy. Thirdly, when recession does kick in, macroeconomic deterioration is broad, reaching all components of GDP, including housing, consumption, production, investment and employment.
Does the current situation tick all of these boxes? The answer is an emphatic no. Since 1979, the National Bureau of Economic Research (NBER) has identified four recessions in the US. On average, the ISM Manufacturing reading during these periods was 42, while for Non-manufacturing it was a little higher at 46. One year before the official start of a recession, these figures were, on average, 49 and 53 respectively. Today, these numbers are 48.1 and 52.6, far from recessionary levels, but in line with 12‑month forward ones, which would confirm the pessimistic view.
However, the situation is very different in other key sectors of the US economy. During recessionary periods, the consumer confidence reading from the University of Michigan was, on average, 70 and, one year before an official recession, it was 84. We are currently at 96.8. The picture is similar for retail sales and household disposable income, which are at levels far from both recession averages and one-year forward readings. Employment is key for consumption, the biggest component of US GDP, and it remains solid, as reflected by the large employment creation numbers in recent quarters. During recessions, non‑farm payrolls are typically negative (-225k on average since 1979) and at 88k one year before recessions. The latest number, released in early December, was 266k and the average over the last twelve months has been 180k.
That view is confirmed by our proprietary US Growth Nowcaster, which tracks the US economy in real time by monitoring a large spectrum of data across the sub-components of GDP: housing, durable and non-durable goods consumption, production expectations, non-durable consumption, employment, financing conditions and investment. In Figure 2, we compare the current situation with both the 1995–1996 period and the average of the last three recessions seen in US, as dated by the NBER (1990, 2001, 2008).
Figure 2: US Growth Nowcaster – Current Trend vs Past Slowdowns
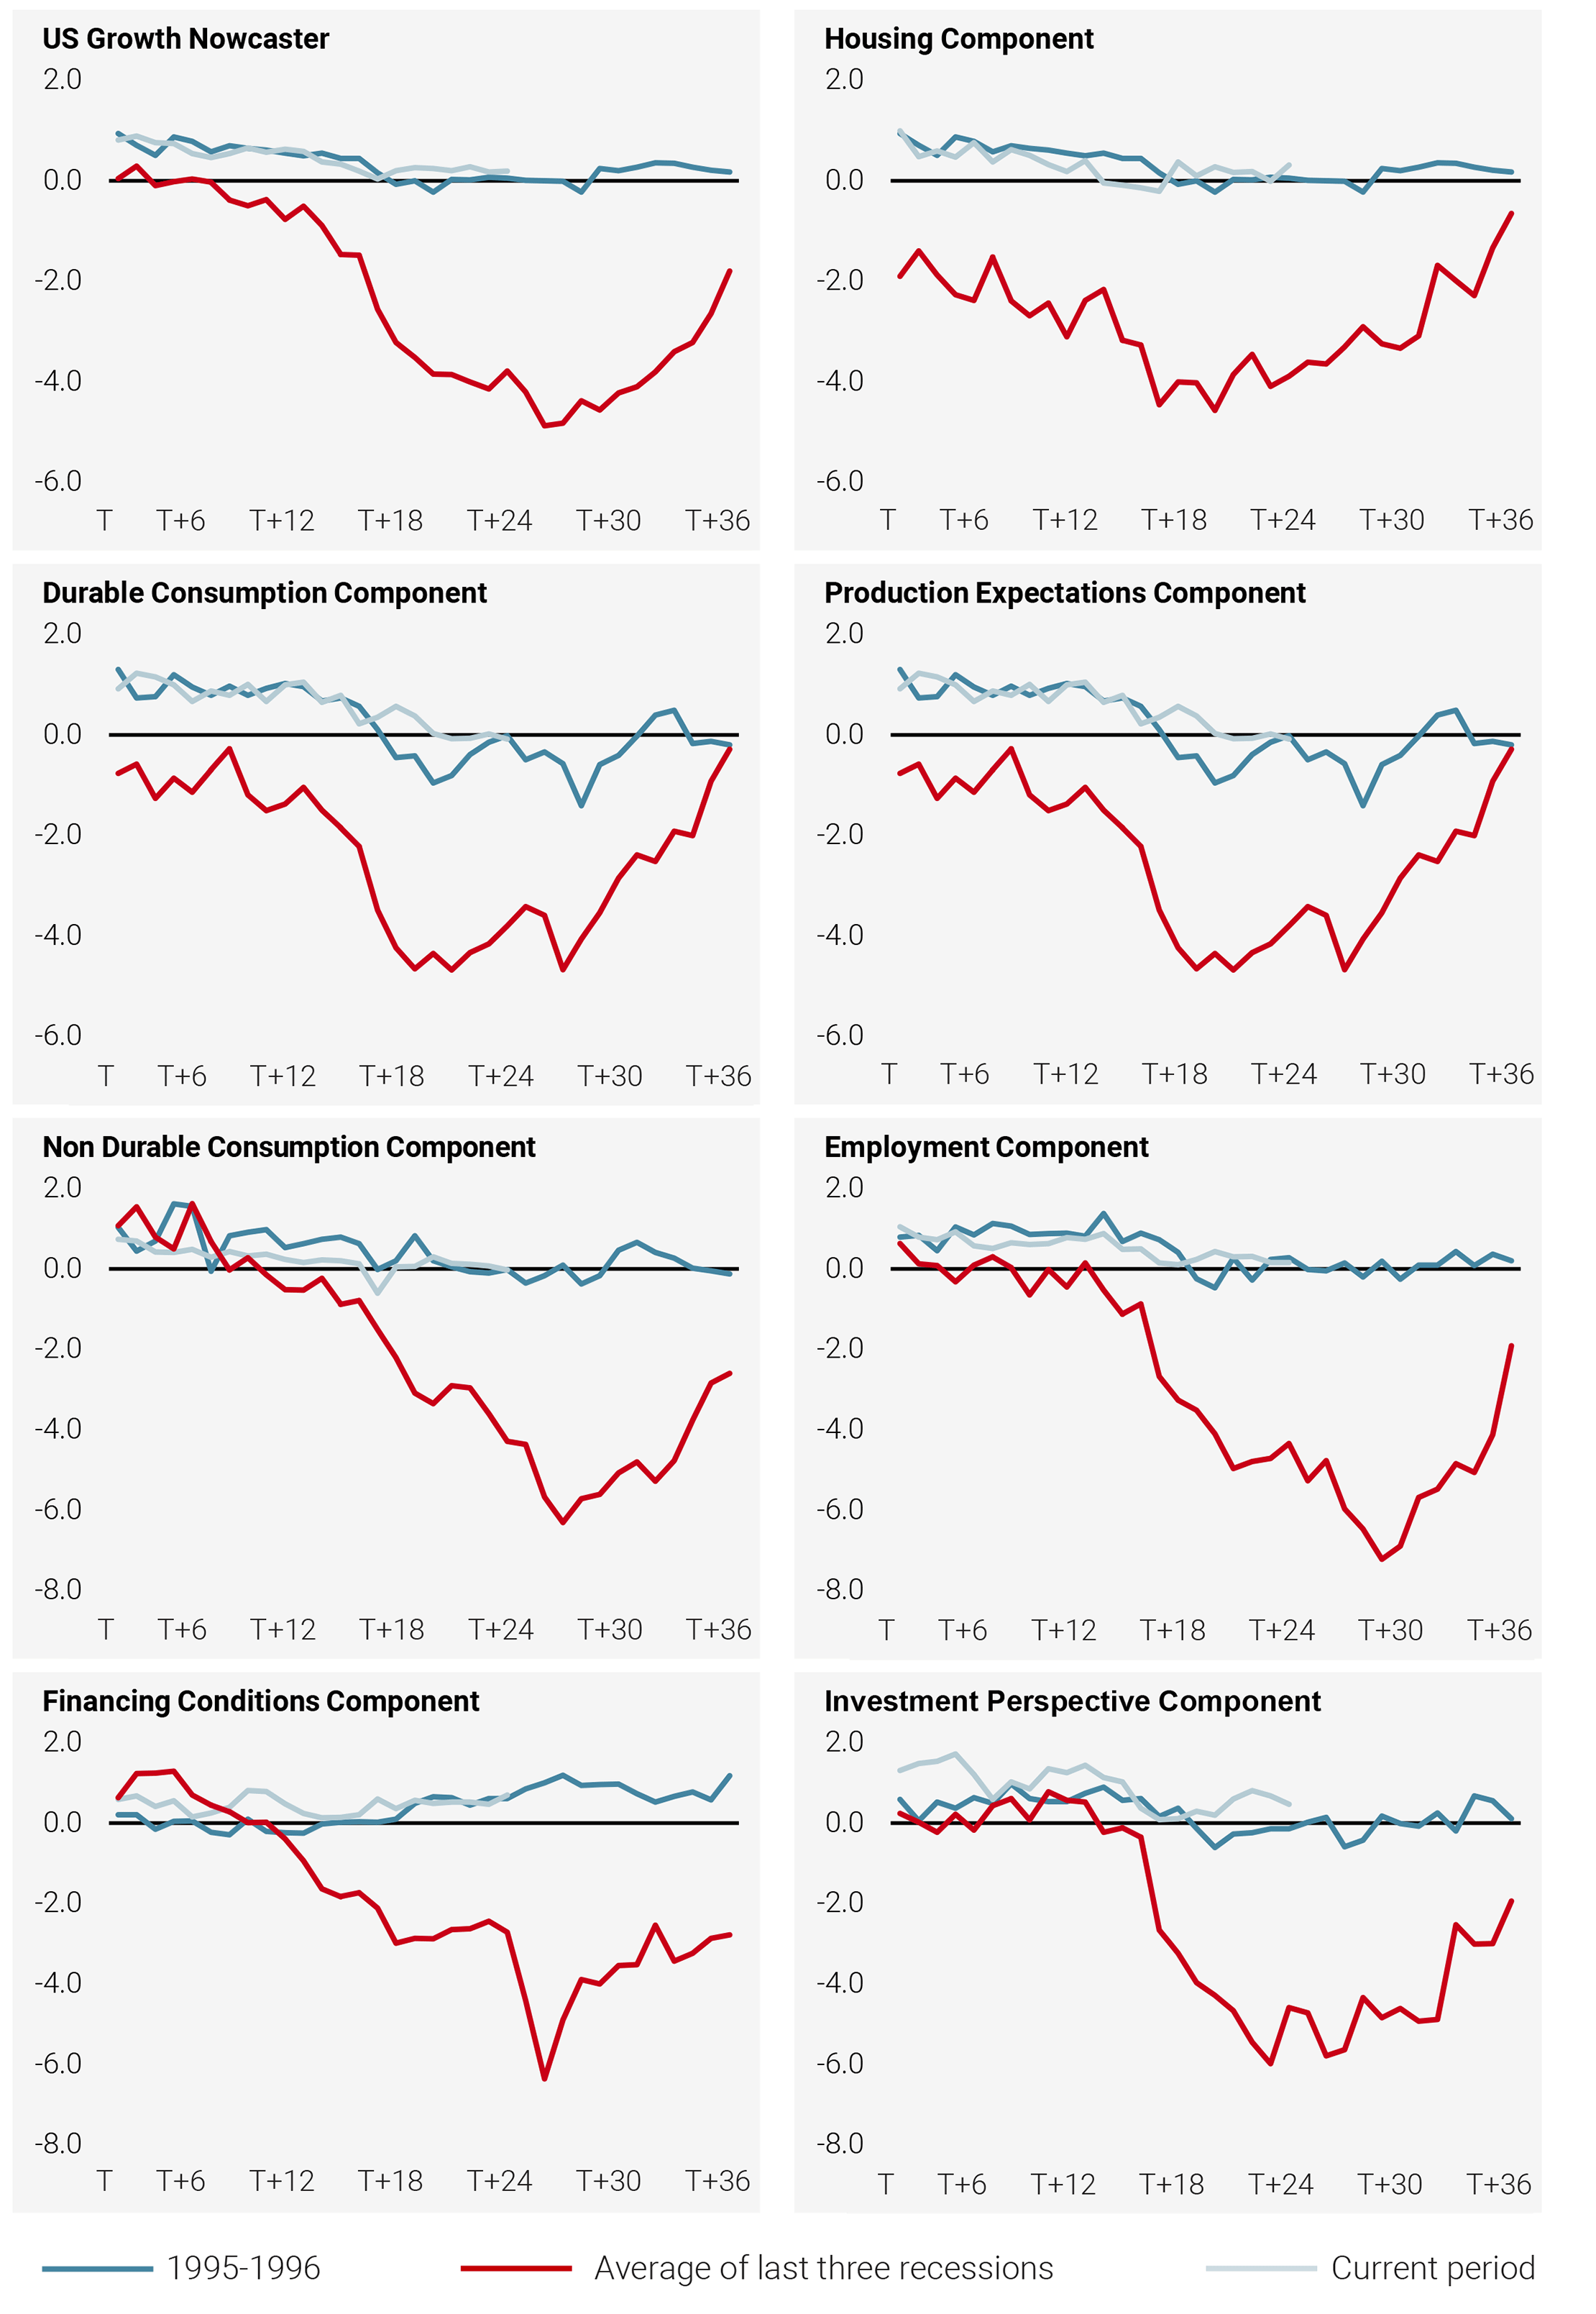
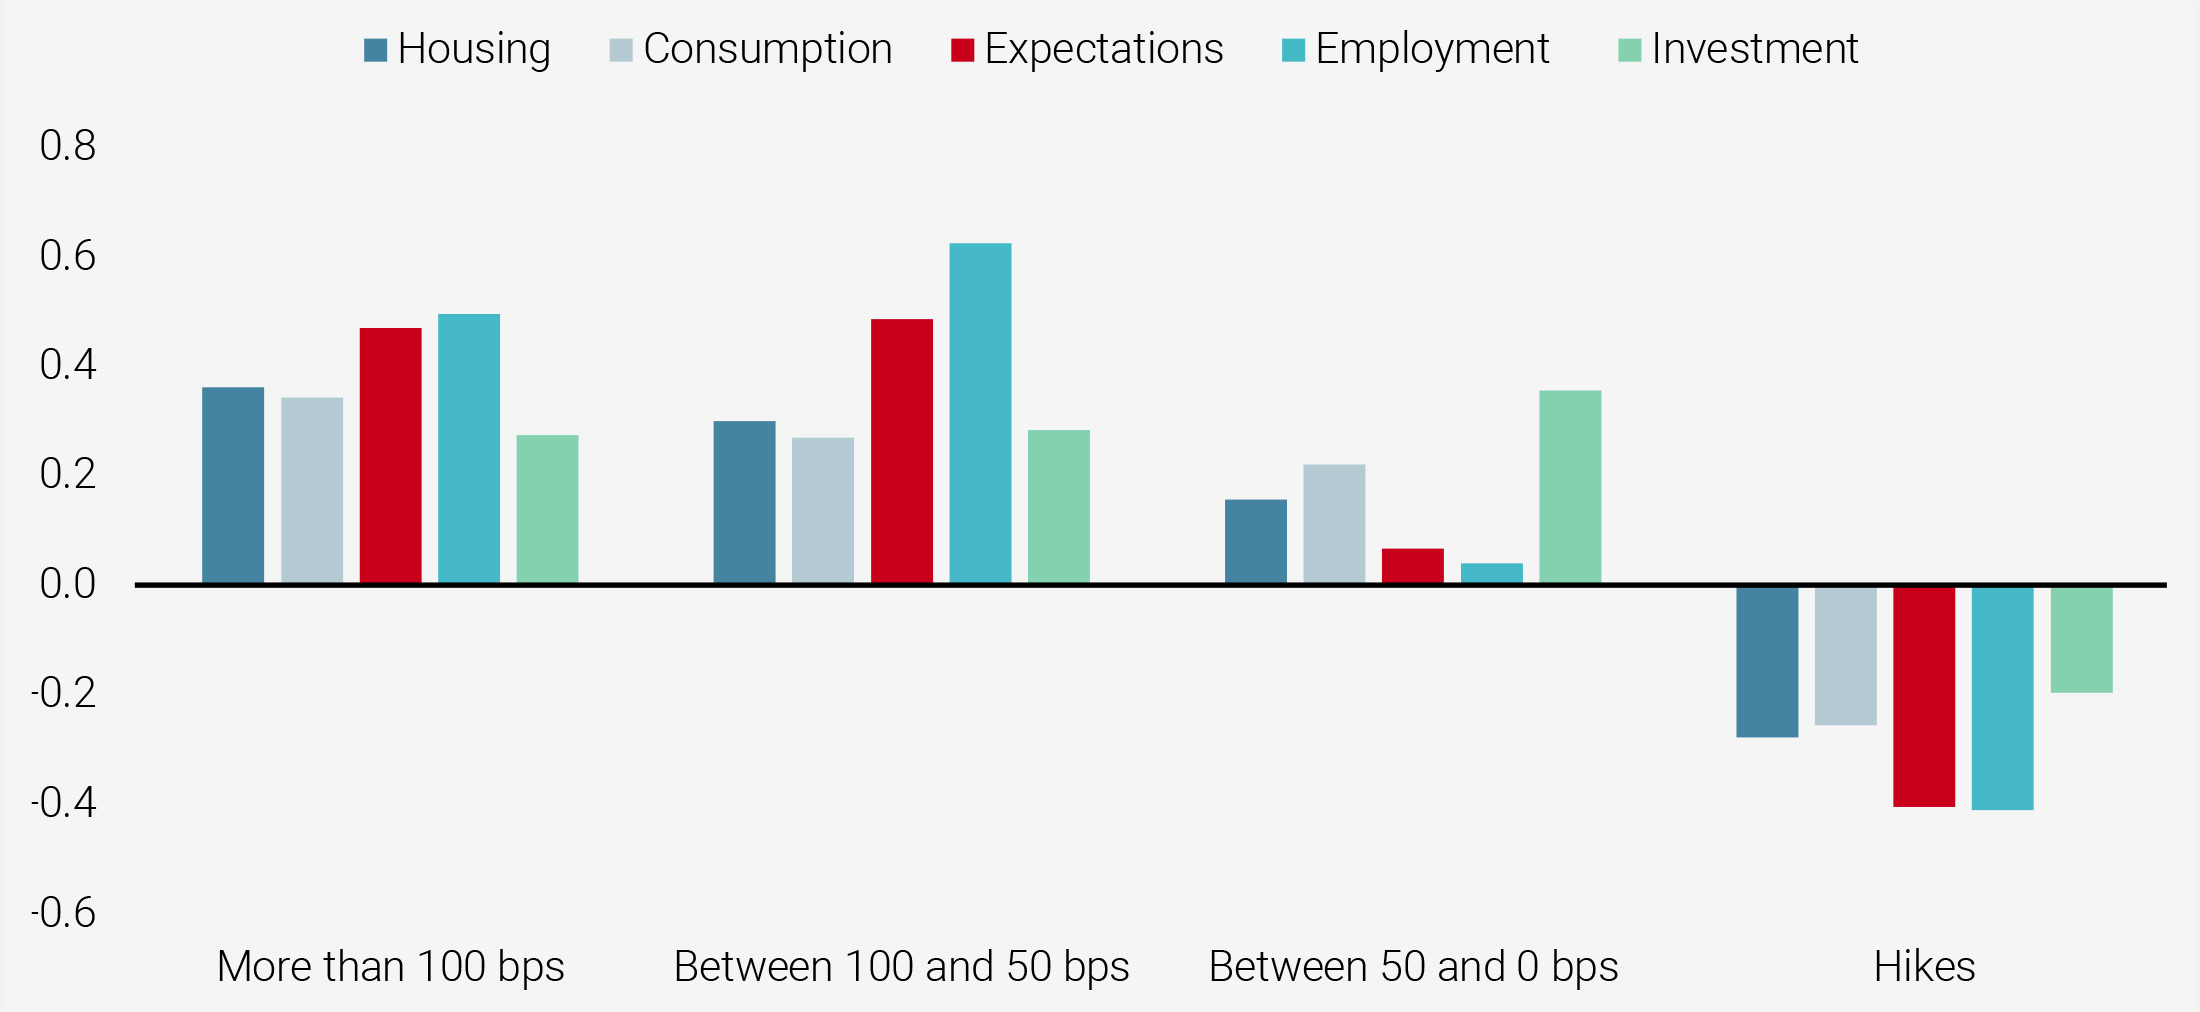
Our analysis finds large similarities with the mid-cycle context (1995–1996) but no common elements with the last three US recessions. Currently, all components of GDP are in positive territory except for durable goods consumption, which is slightly negative. Historically, these components have all been in negative territory one year ahead of a recession. In 1995–1996, pre-emptive rate cuts eased financial conditions and helped stabilise the housing market and consumption. These two components currently remain solid and are far from deteriorating, as they have been ahead of previous US recessions. We therefore share the Fed’s view about the economic outlook and are more positive than the consensus about macro risks for next year.
Inflation Risks Will Remain Moderate
The inflation situation is a key part of our macro assessment. As highlighted by central banks, it has disappointed recently and forecasts made by experts have declined steadily since November 2018. Despite a net improvement in employment for most countries, the Philips’ curve has failed to materialise, maintaining growth in labour costs at moderate levels. As an illustration, inflation expectations embedded in inflation swap markets imply no inflationary pressures on the horizon.
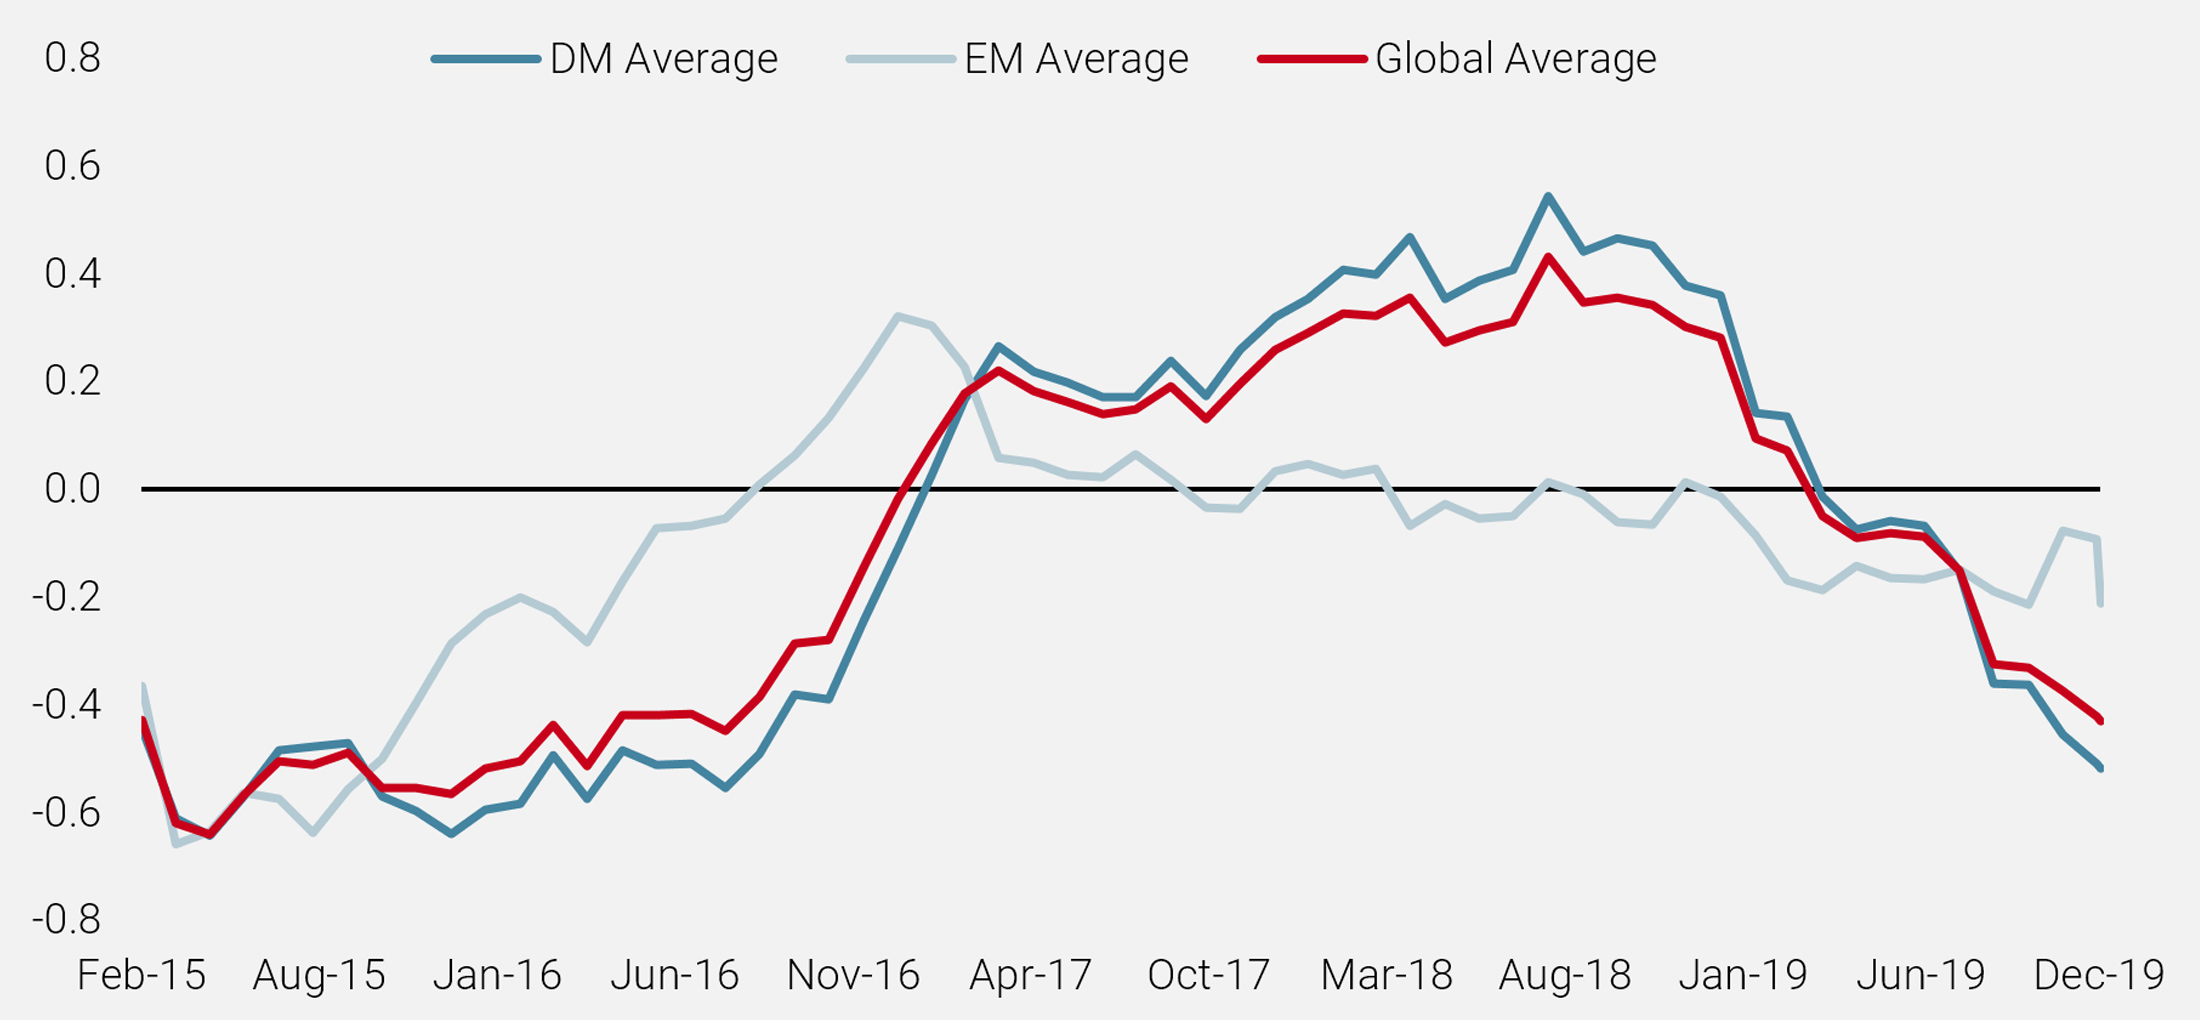
Our proprietary Inflation Nowcasters, which assess the risk of inflation surprise, show a similar trend, having declined consistently since the summer of 2018. Recently, this trend has accelerated, as highlighted in Figure 3. Globally, all sources of inflation are broadly pointing in the same direction, especially in the US. We think this is a key element of the current macro picture: inflation is nowhere to be found, meaning that central banks are likely to remain on the dovish side, offering continued and welcome support to financial markets.
Figure 3: World Inflation Nowcaster
Central Banks Will Continue To Sing
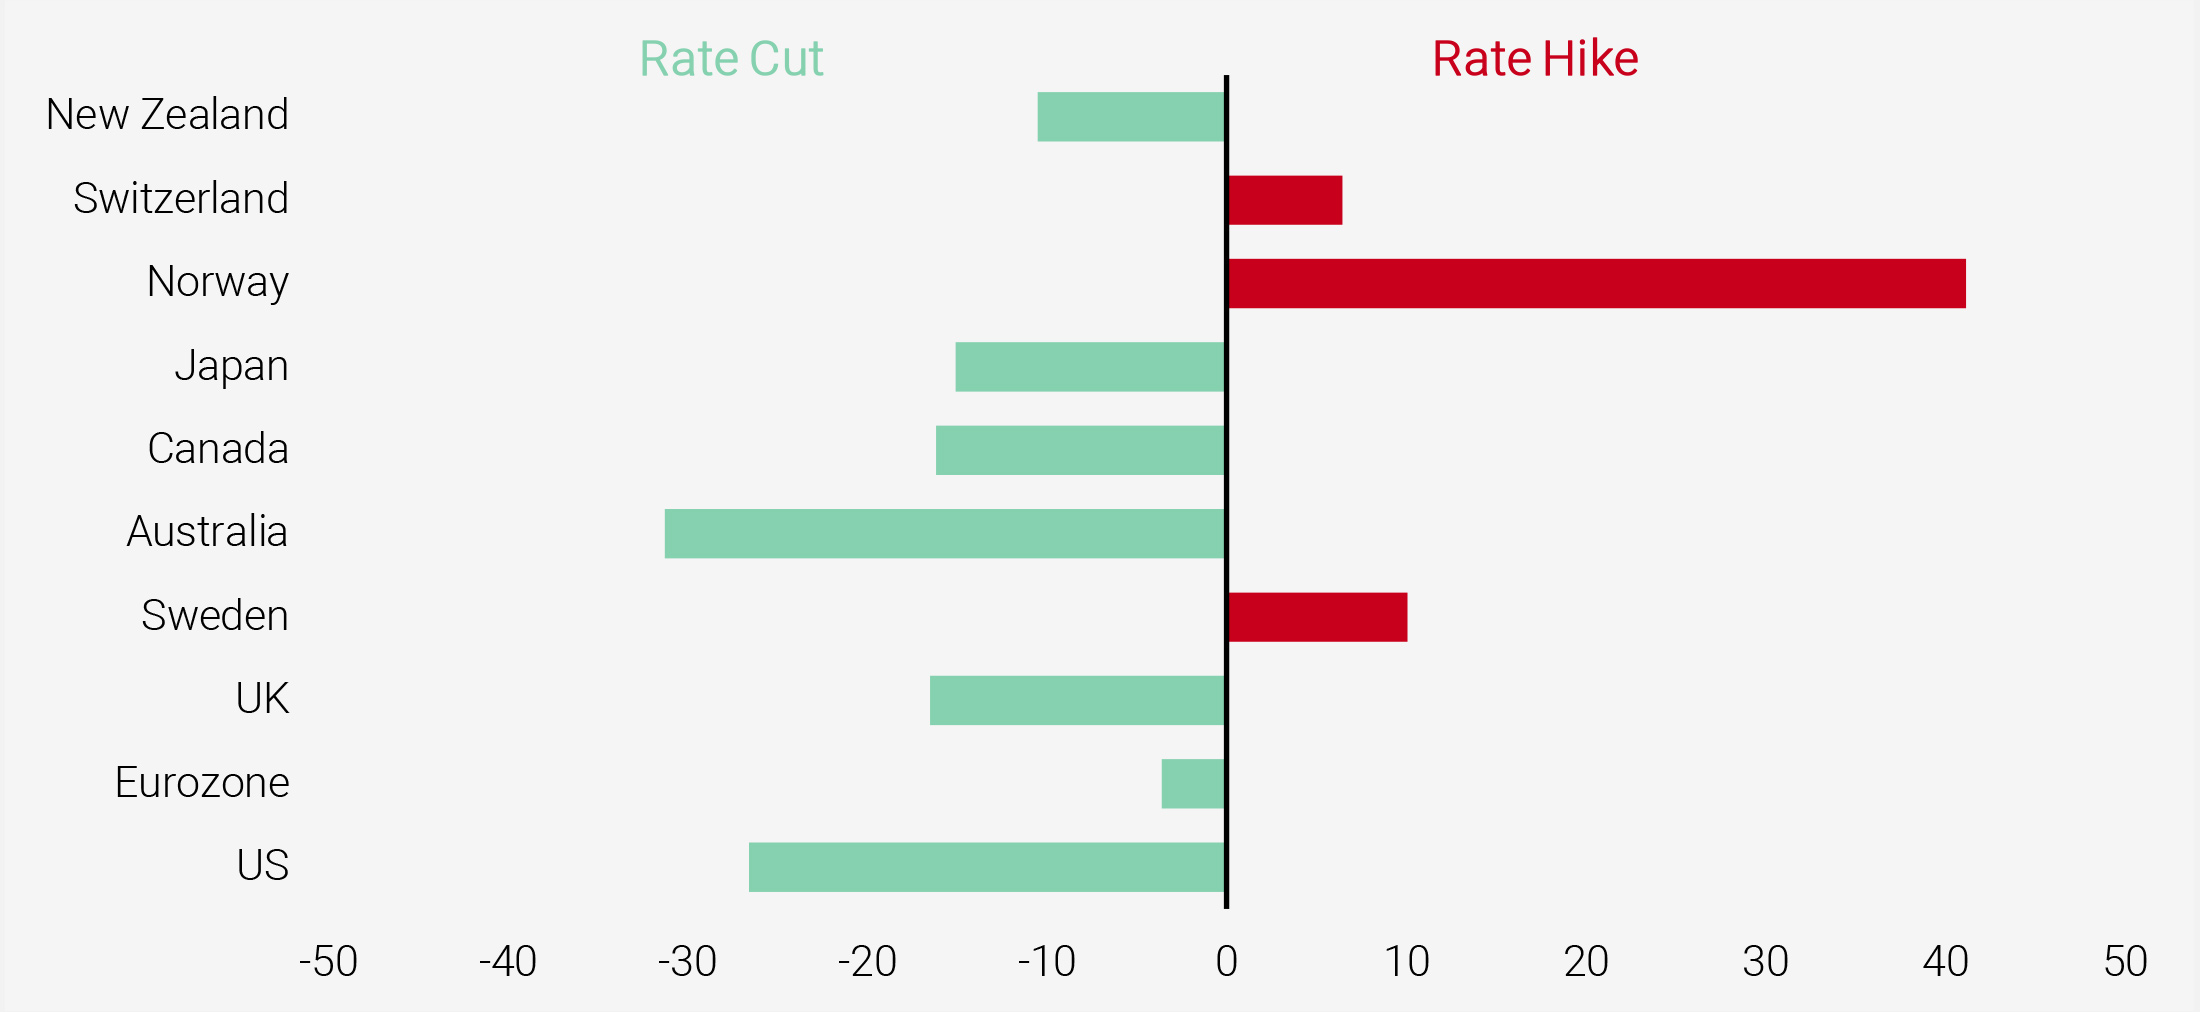
Nothing would make central banks more happy than stable growth and a lack of inflation risk – the perfect economic scenario. However, as has been conveyed in recent speeches, the balance of risk remains tilted toward the downside because realised inflation tends to undershoot central bank targets, raising questions about the possibility of the “Great Japanisation” of the global economy. At the same time, political risks are not off the table with tensions rising in Hong Kong, Europe and Latin America. Unless a resolution to the trade war can be found, visibility is likely to remain poor and this should see central banks maintain their accommodative stances in 2020, in line with market expectations (Figure 4).
Figure 4: Monetary Policy Expectations for 2020 (bps)
Based on our conviction that the global economy has bottomed and will recover in 2020, we expect the monetary policy of key central banks to remain unchanged in 2020. Our belief is that it has done its job, as evidenced by the fact that we are not in recession, and that the next steps to support the economy will be fiscal, particularly in Europe and Japan. In the US, the election is likely to freeze any decision there in the short-term. Consequently, the policy mix will remain supportive for the global economy next year with accommodative monetary policy and a less restrictive fiscal one. Historically, the main components of GDP benefit from such circumstances, as illustrated in Figure 5.
Figure 5: Average Yearly US Nowcaster Changes When Monetary Policy Has Eased
To summarise our macro outlook, we see a lower risk of recession than the market. Central bank action should remain a positive for investors as inflation continues to disappoint, prompting dovish monetary policy. Such a scenario should, in our view, be a key support for growth-related assets at the expense of the usual diversifiers such as sovereign bonds and real assets.
Valuation At Risk
A focus on macroeconomic factors alone, such as the stance of policy mix or the outlook for inflation and activity, would lead us to adopt an aggressive overweight for equities and credit for the coming quarters. However, macroeconomic risks are not the only ones to monitor to deliver stable and smooth returns over different market conditions. Another key factor is valuation and it slightly moderates our positive view for next year.
At the end of 2018, following the correction that occurred in the last quarter of the year, most risk assets were trading at very attractive valuations, both from a historical and cross-sectional perspective. However, after an almost 12 month rally for most assets, the situation has changed markedly, as depicted in Figure 6 by our proprietary measure based on the carry provided by single risk premia.
Figure 6: Cross-Asset Valuation Scoring
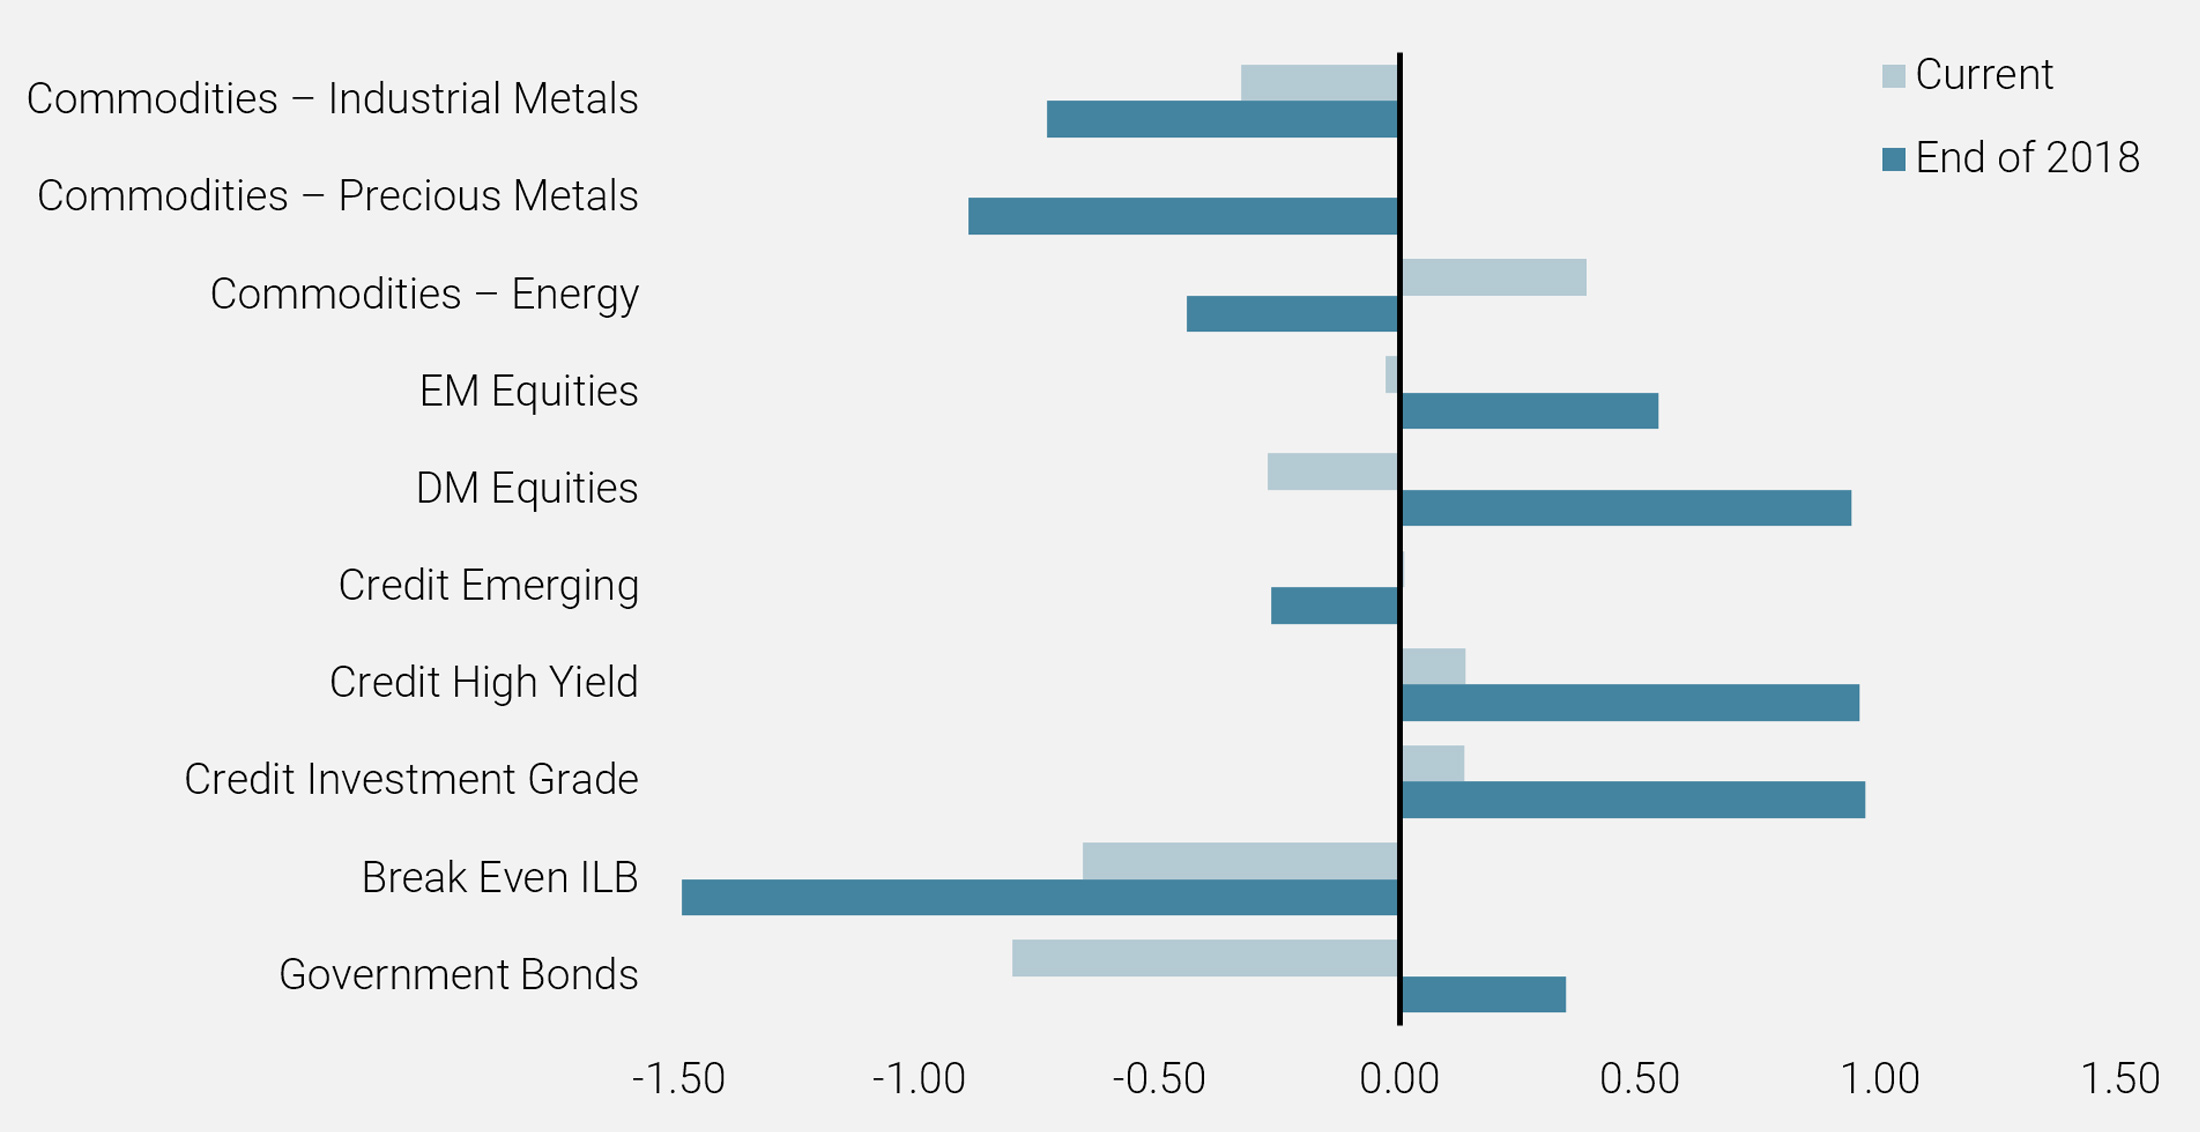
The most notable change has been in growth-oriented assets. At the end of November, credit spreads and equities were, on average, fairly valued, having moved up from cheap levels in December 2018. A deeper analysis, using metrics other than carry, depicts a more deteriorating valuation picture for most developed equity indices. Fundamental valuations, based on ratios such as EV/Sales or Price-to-Book, highlight how expensive US and European equities have become (see Figure 7).
Figure 7: Fundamental Valuations of Risky Assets
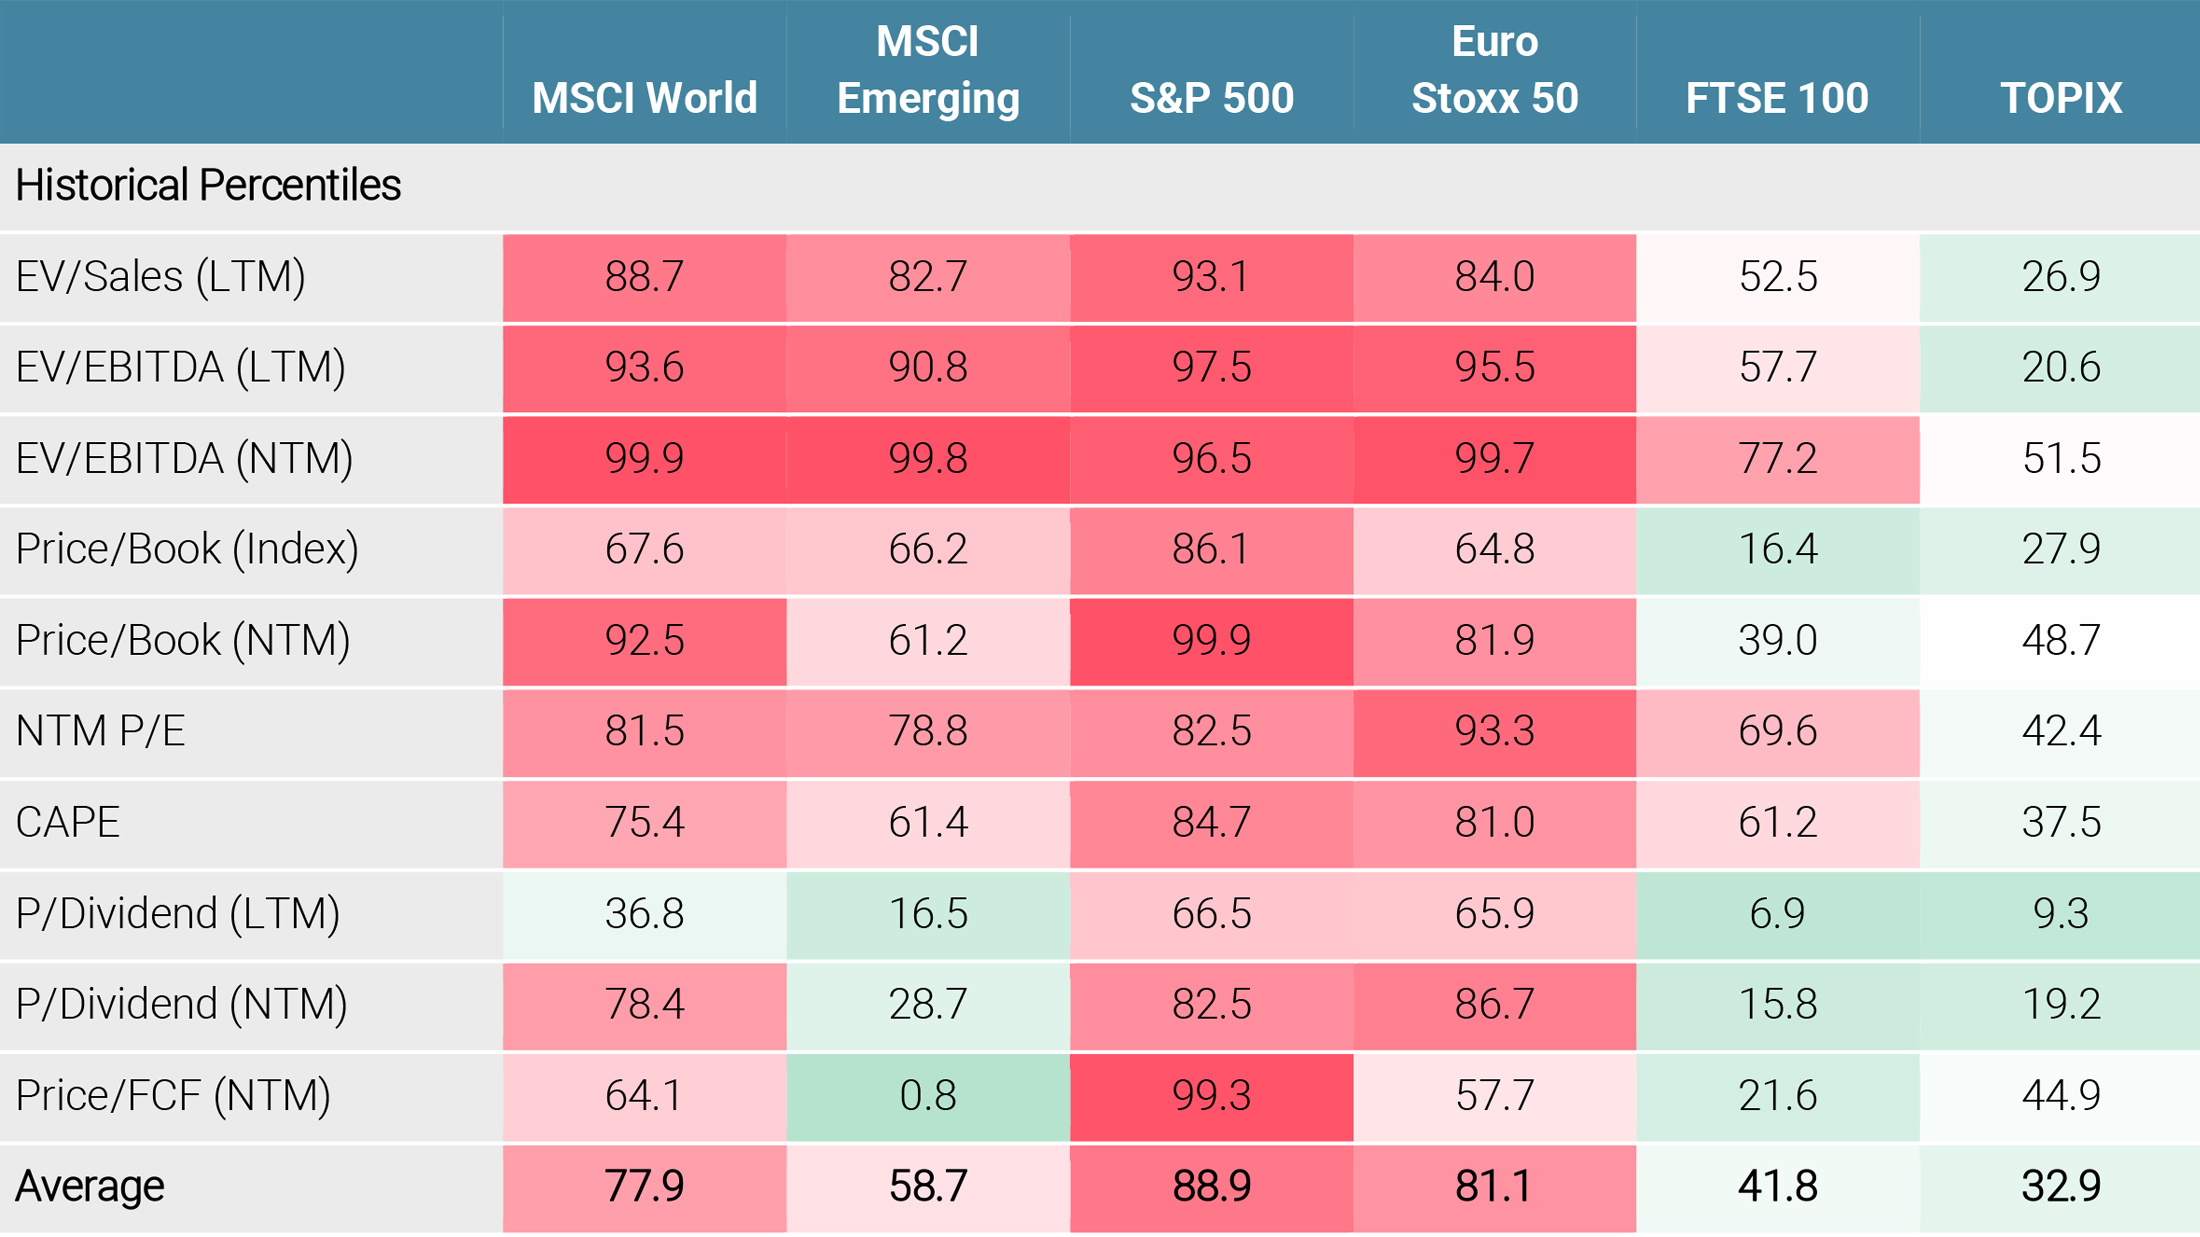
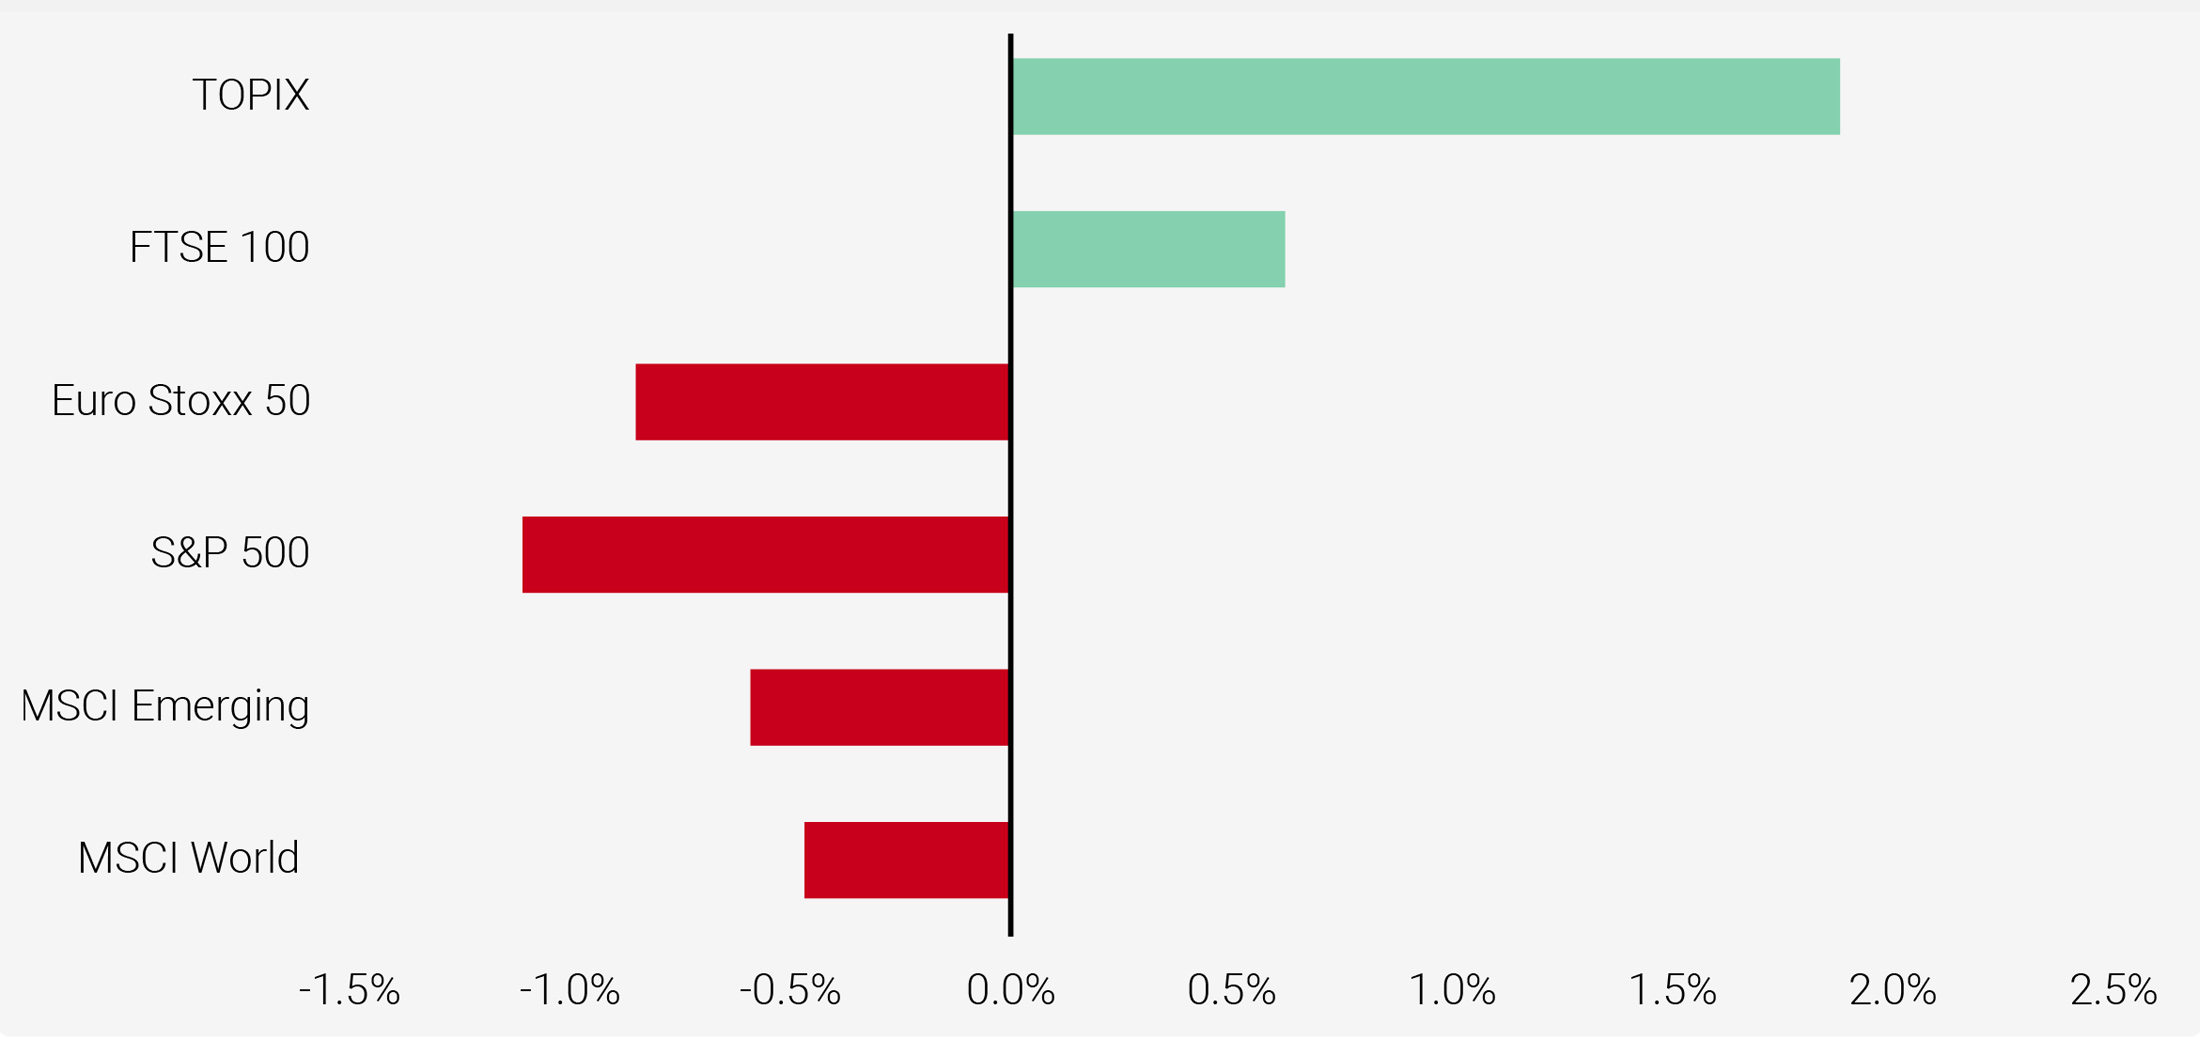
These fundamental valuations need to be taken into consideration in our dynamic risk management and weigh on our positive outlook for growth-oriented assets. Indeed, history shows that current valuations for developed equities are associated with poor forward returns (see Figure 8). Moreover, analysts’ forecasts for earnings growth in 2020 are still elevated (+10% on average for global equities for 2020) and would require a perfect macroeconomic environment to be achieved. Although we have a more positive view than the consensus on the economic outlook, we do not expect a “Goldilocks” outcome for next year. Current valuations therefore do leave the door open for a few alternative scenarios should global growth or the political situation deteriorate.
Figure 8: Historical Return With Current Valuation (Expected Monthly Return; 3-months Forward)
Consequently, the deterioration observed in the different indicators that we monitor has pushed the valuation signal from positive to neutral in our tactical outlook for growth-oriented assets. It does not mean that it is time to reverse our positive thinking for equities and credit, but it does represent an orange flag that needs to be monitored closely to prevent any greedy positioning next year.
Moreover, given the expensiveness of other assets, such as sovereign bonds and real assets, the global beta exposure of a diversified portfolio should be challenged, with a particular focus on the proportion of directional trades and relative value ones. Historically, expensive valuations mean higher dispersion, which requires more discrimination within assets. That is the reason why we believe that 2020 could be a better year for alpha than previous ones.
Market Sentiment Will Remain In The Driving Seat
The last risk factor that we monitor in our dynamic asset allocation framework is market sentiment, which encompasses a large spectrum of elements and data, including market positioning, risk aversion, perception of political risks and pricing of tail events. Usually, market sentiment has limited impact on medium-term asset returns, but it can drive short-term performance and lead to bad decisions in terms of dynamic asset allocation if wrongly assessed. This is why it is key to dissociate noise from fundamentals and accurately evaluate what is, and what is not, priced in.
Over recent months, market sentiment has been the main driver of asset returns, as determined by announcements and tweets on the trade war (see Figure 9).
Figure 9: Impact of Tweets on the VIX Index
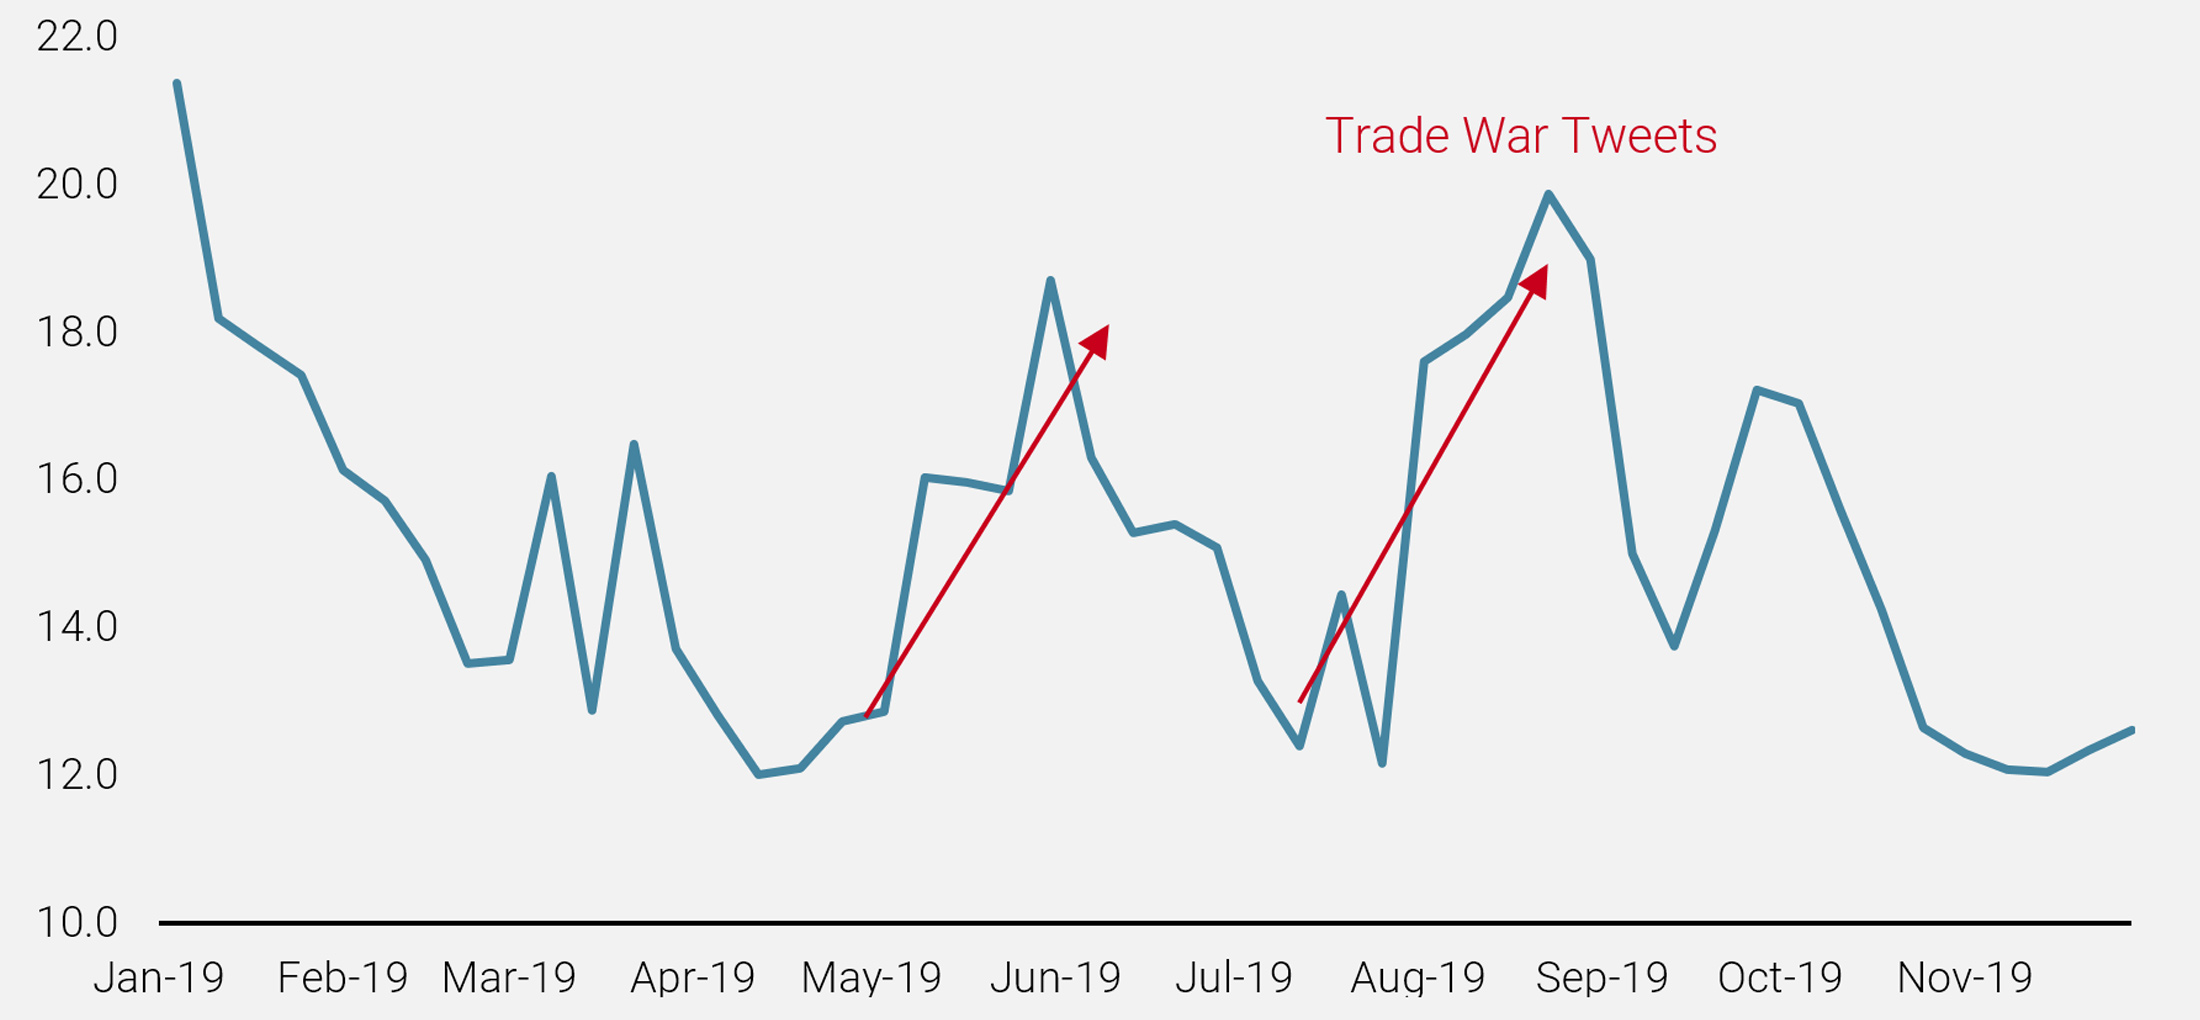
Global sentiment was very negative in August, as reflected by an inversed yield curve, the proportion of negative bond yields in the Barclays Global Aggregate universe and the high level of the VIX (24). However, since then the reversal has been large. Over three months, investors have shifted from pricing in a major economic slowdown, with a high probability of Brexit and trade war escalation, to an economic rebound, complete with a soft Brexit and a deal between China and the US. This is evidenced by the VIX falling back to levels last seen during the best periods of the “Goldilocks” era in 2017.
What Will The Picture Be For Next Year?
Overall, we believe that market sentiment will lie at the heart of our tactical allocation for two main reasons. Firstly, the political agenda is full in 2020 with the US election, rising instability in European governments, Brexit, unrest in several emerging countries and trade war tensions. Therefore, political risks are likely to determine investor sentiment and thus positioning and return. Secondly, political polarisation has increased and is expected to remain high over the coming months. This could generate a higher frequency of binary outcomes for expected and unexpected events (e.g. with Brexit and the US election) in a manner similar to 2016.
In this challenging environment, how should investors be positioned to achieve stable returns? The rationale for reducing risk and adding protection to a portfolio is high. Nevertheless, for assessing market sentiment, risk/reward analysis is crucial and here, more than elsewhere, details matter. Defining the risks to cover is not enough to protect your portfolio. Evaluating the cost of hedging, defining its implementation and timing its monetisation are as important as deciding on the risks to hedge.
Over the last couple of years, there have been several political events that have delivered either an expected or unexpected negative outcome. However, risk materialisation – a large prolonged drawdown in risky assets or currencies linked to the country of event – has rarely occurred. Figure 10 illustrates one such example. Despite a fall in the Brazilian real, its implied volatility declined. This means that buying a put on the real to protect your Brazilian exposure would have failed to hedge the risk of a decline in it.
In our view, one element explains this situation: generalised quantitative easing.
Figure 10: Brazilian Real and Implied Volatility
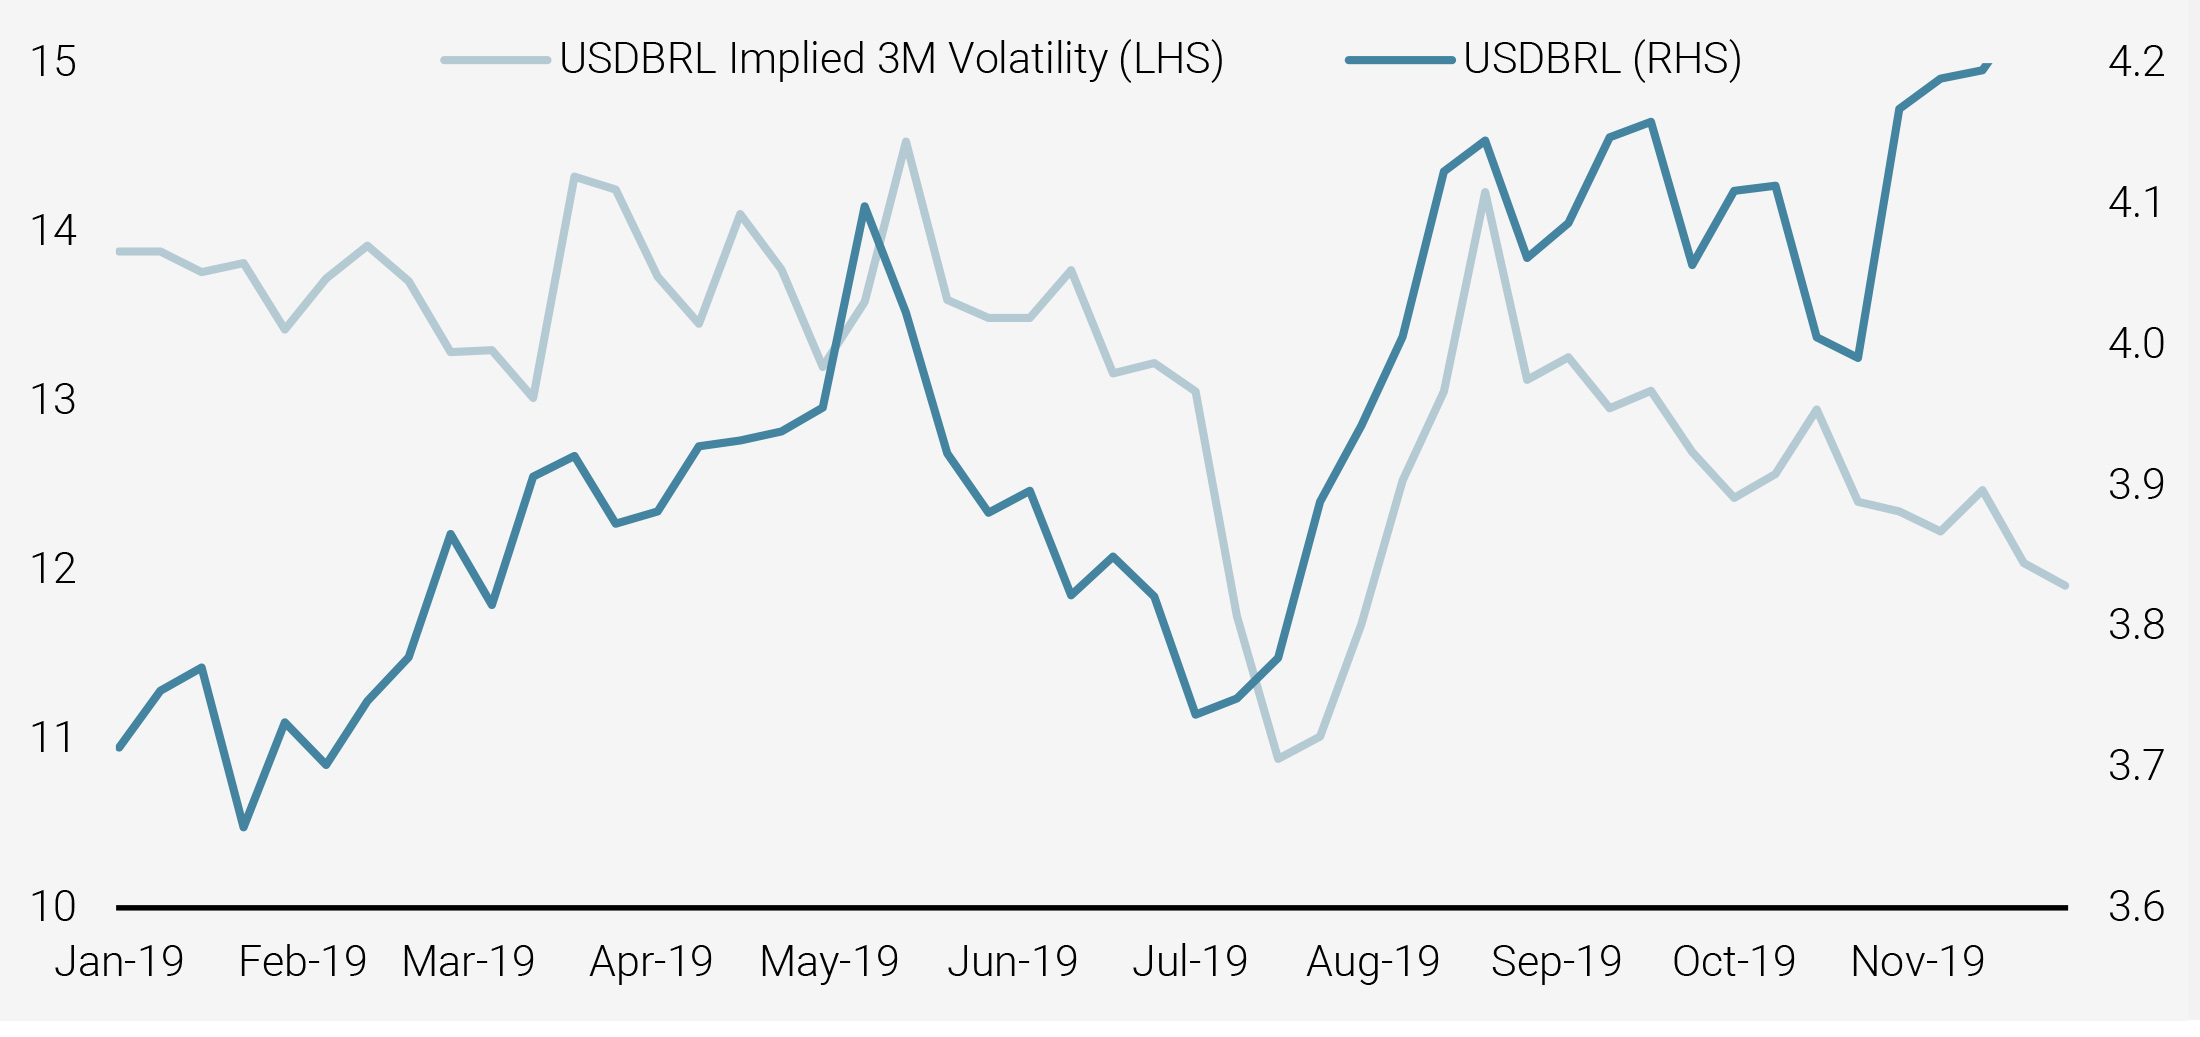
When it comes to assessing political events, an essential element which is often underestimated by investors is global liquidity. Are we in easing mode with large liquidity injections from central banks or in a restrictive mode? In the first case, drawdown protection should be bought and volatility spike sold (May and August 2019), while in the second case, risk reduction should be the norm (Q4 2018).
In our opinion, investors tend to overestimate two elements: 1) the nature of the risk and its impact on assets, and 2) the protection offered by the typical hedging methods using puts or put spreads. Generalised quantitative easing has structurally modified the relationship between volatility and risky asset returns and that change should be seen as: 1) an opportunity to capture spread between low realised volatility and a high implied one, and 2) a driver for changing the way portfolios are protected from using optional strategies to a diversification approach that incorporates FX or alternative liquid strategies. In fact, expanding the investment universe would allow the sensitivity of a portfolio to specific events to be lowered, thus reducing the need for specific hedging.
With political risks set to rise further in 2020, these two elements will play a big role in our strategy. Our conviction is that short-term shocks will be more frequent than in the past. However, implied volatility indicates that most of the worst-case scenarios are still well priced, lowering the benefits of hedging. As an illustration, the Nasdaq’s implied volatility is relatively high versus other US equity markets because of the risk of new regulations should Elizabeth Warren, a democratic candidate for the US presidency, be successful. By contrast, the expected distribution from the options market shows that outperformance of the Hang Seng index or the strength in the Brazilian real are not fully priced.
Asset Allocation For 2020: In Macro Factors We Trust
While our dynamic allocation framework revealed an alignment of planets six months ago (satisfactory global growth, overly bearish sentiment and attractive valuations for growth-oriented assets), the narrative for 2020 has changed slightly. In our view, although the macroeconomic picture should stay far from recessive territories, helped by the continued accommodative stance of central banks, valuation and market sentiment are now appearing less supportive for risky assets.
For 2020, our major source of optimism comes from monetary policy. A supportive policy mix is likely to remain in place and potentially be amplified in the case of an economic slowdown. We believe that this will keep the volatility of macroeconomic variables at low levels, reduce the risk of large shocks and reduce the probability of sustained financial turmoil. As a result, we expect a reduction in the risk premium of most liquid risky assets.
Based on this, we are maintaining a preference for equities and credit at the expense of sovereign bonds and real assets, but with much higher discrimination than in the past. While 2019 has been a year for beta, we think that 2020 will bring about a larger dispersion, both within and across assets.
Of course, it is always difficult to forecast yearly asset returns. Who would have forecast in 2018 that returns for 2019 would represent one of the best years for most asset classes? Ten years ago, everybody thought that accommodative monetary policy would be inflationary. No one would have predicted that the biggest monetary experiment of all time would result in zero inflationary pressures.
Within growth-oriented assets, besides a long bias in equity and credit, we like relative value strategies, such as FX carry strategies, Credit carry and Volatility carry. They should benefit from the lower realised volatility brought about by the support of central banks. From a valuation perspective, emerging market and Japanese equities appear the most attractive. If the US and China reach a trade deal, both should outperform.
Within diversifying assets, we prefer US bonds at the expense of European ones because the Fed has much more scope to ease compared to the ECB, SNB, Riskbank or BofE. We also expect a steepening of the US and German curves, driven by an improvement in the economic outlook without any inflationary pressures.
Finally, we are looking toward the FX market as an attractive tool to diversify rather than the usual safety of sovereign bonds and gold. Within FX, our preference is for defensive strategies in order to balance our positive tilts in favour of growth-oriented assets. The FX Value strategy, which is long undervalued currencies and short overvalued currencies, should deliver a positive return in a worst-case scenario and should help smooth returns in different market conditions. Important information This document is provided to you on a confidential basis and must not be distributed, published, reproduced or disclosed, in whole or part, to any other person. The information and data presented in this document may discuss general market activity or industry trends but is not intended to be relied upon as a forecast, research or investment advice. It is not a financial promotion and represents no offer, solicitation or recommendation of any kind, to invest in the strategies or in the investment vehicles it refers to. Some of the investment strategies described or alluded to herein may be construed as high risk and not readily realisable investments, which may experience substantial and sudden losses including total loss of investment. The investment views, economic and market opinions or analysis expressed in this document present Unigestion’s judgement as at the date of publication without regard to the date on which you may access the information. There is no guarantee that these views and opinions expressed will be correct nor do they purport to be a complete description of the securities, markets and developments referred to in it. All information provided here is subject to change without notice. To the extent that this report contains statements about the future, such statements are forward-looking and subject to a number of risks and uncertainties, including, but not limited to, the impact of competitive products, market acceptance risks and other risks. Data and graphical information herein are for information only and may have been derived from third party sources. Although we believe that the information obtained from public and third party sources to be reliable, we have not independently verified it and we therefore cannot guarantee its accuracy or completeness. As a result, no representation or warranty, expressed or implied, is or will be made by Unigestion in this respect and no responsibility or liability is or will be accepted. Unless otherwise stated, source is Unigestion. Past performance is not a guide to future performance. All investments contain risks, including total loss for the investor. Unigestion SA is authorised and regulated by the Swiss Financial Market Supervisory Authority (FINMA). Unigestion (UK) Ltd. is authorised and regulated by the UK Financial Conduct Authority (FCA) and is registered with the Securities and Exchange Commission (SEC). Unigestion Asset Management (France) S.A. is authorised and regulated by the French “Autorité des Marchés Financiers” (AMF). Unigestion Asset Management (Canada) Inc., with offices in Toronto and Montreal, is registered as a portfolio manager and/or exempt market dealer in nine provinces across Canada and also as an investment fund manager in Ontario and Quebec. Its principal regulator is the Ontario Securities Commission (OSC). Unigestion Asia Pte Limited is authorised and regulated by the Monetary Authority of Singapore (MAS). Unigestion Asset Management (Copenhagen) is co-regulated by the “Autorité des Marchés Financiers” (AMF) and the “ Danish Financial Supervisory Authority” (DFSA). Unigestion Asset Management (Düsseldorf) SA is co-regulated by the “Autorité des Marchés Financiers” (AMF) and the “Bundesanstalt für Finanzdienstleistungsaufsicht” (BAFIN). Document issued: December 2019.