Last week’s Fed meeting confirmed what many market participants had expected for a couple of months, namely that monetary policy will likely shift from patiently neutral toward easing through a combination of rate cuts and balance sheet expansion. This clear dovish signal followed comments by ECB President Mario Draghi indicating that rate cuts were on the table if the ECB decides to ease in the face of downside risks to the Eurozone. Some investors may question the Fed’s justification in making this shift, especially in light of their stable projections for growth and unemployment, but a combination of disinflationary pressures and uncertainty on external conditions are clearly the primary risks in the minds of Fed governors. We believe the 1995 example is most relevant today, when the Fed cut rates after a sustained trend of tightening moderated inflation pressures. Markets have heard this song before and will keep on dancing to the familiar beat. One of the key supports for financial markets this year has been investor expectations of easier monetary policy. The shift from pricing rate hikes and balance sheet reduction to rate cuts and asset purchases has more than offset concerns about global growth and trade uncertainty. Last week, the Fed largely delivered on investor expectations, confirming the dovish pivot they have been communicating since the end of last year. In our view the highlights from the meeting are:“KEEP ON DANCING” – The Jacksons, 1976
What’s Next?
The Fed is One Step Away From its First Rate Cut Since 2008
- Projections for the target rate (the “dot plot”) were revised down significantly toward market pricing (for the second time) and now point to no hikes for this year. Importantly, the median longer-term neutral rate is now 2.5%, indicating that Fed members think the current level of rates is sufficient to promote growth in the absence of material downside risks.
- Indeed, their projections for growth and unemployment did not change much and Chairman Powell confirmed that growth and the labour market remain “solid“.
- However, inflation projections were revised down significantly from 1.8% (or close to their 2% target) to 1.5% (or markedly below target) for 2019.
- Their statement dropped the “patience” references and Powell confirmed they are ready to act if needed. And, for the first time in a while, the board is split between doves and hawks.
In our view, the 1995 case is most relevant to today’s context, although it is not a perfect analogy. Starting in early 1994, the Fed raised rates continuously from 3% all the way to 6% in the span of 15 months. This contained price appreciation but business spending was showing signs of slowing down and so, in July 1995, the Fed, under the leadership of Alan Greenspan, thought a more accommodative policy was apt and cut rates by 0.25%. Today, the Fed has engaged in slower and less drastic policy tightening, but they are also seeing, as they did in 1995, inflation under control while risks to growth mount. By cutting rates pre-emptively in 1995, the Fed was able to extend the economic expansion until the tech bubble burst. Back to the future, investors today expect the Fed to take the same action this year and succeed in supporting the expansion. One other interesting parallel is noteworthy: back in 1995, President Clinton was a year out from running for re-election, and the easier policy helped to avoid a possible recession that would have made his re-election chances much tougher. The New York Times opened their 7 July 1995 story on the rate cut by writing, “Under mounting political and economic pressure to stave off a possible recession, the Federal Reserve reduced short-term interest rates for the first time since 1992.” We could easily imagine reading a very similar headline in the next few months.Roads? Where We’re Going, We Don’t Need Roads

As in 1995, we expect risky assets to extend their gains over the medium term. Lower bond yields should lower debt service costs and promote credit creation. Without an imminent threat of recession, growth-oriented assets should benefit from both cash-flow growth and lower discount rates. One countervailing headwind is that valuation for some assets has become quite rich. In particular, the carry in G10 nominal bonds and high yield credit spreads looks quite expensive historically (though less so when compared to other assets). In equities, the S&P 500 index is expensive by almost any metric. Whether you consider the underlying assets, earnings, dividends or cash flows that you get for the price you pay for US stocks, you are getting much less today than you would have historically. However, the elephant in the room is the US-led trade war and resulting uncertainty. A key question for investors is whether the impacts will be felt primarily via the demand or supply channel. In the Fed’s view, the impacts will largely be on the demand side and not lead to a significant pick-up in prices. Outside of the macro impacts to growth and inflation, we are concerned about the sensitivity of market sentiment to the ebb and flow of trade negotiations. While the latest news has been positive and a meeting between President Trump and Xi is likely next week, we are not convinced the thorny issues can be easily resolved. Nevertheless, we prefer to remain risk-on to benefit from the tailwinds of an easier Fed and tactically hedge tail risk via options.Got Our Dancing Shoes On, but Listening Closely to the Beat

Keep on Dancing

Our medium-term views remain cautious, and we are pairing an overweight in government bonds with an underweight in high yield corporate credit. We are also complementing our equity exposure with options to protect the portfolio in the case of equity drawdowns. Over the month of June so far, the Multi Asset Risk Targeted Strategy is up 3.1% versus 6.5% for the MSCI AC World index and 1.1% for the Barclays Global Aggregate index (USD hedged). Year-to-date, the Multi Asset Risk Targeted Strategy has returned 6.8% versus 16.1% for the MSCI AC World index, while the Barclays Global Aggregate index (USD hedged) is up 5.7%. * The Multi Asset Risk Targeted Strategy performance is shown in USD net of fees for the representative account of the Multi Asset Risk Targeted (Medium) USD Composite and reflects the deduction of advisory fees and brokerage commission and the reinvestment of all dividends and earnings. Past performance is not indicative of future performance. This information is presented as supplemental information only and complements the GIPS compliant presentation provided on the following page.Strategy Behaviour
Performance Review
Unigestion Nowcasting
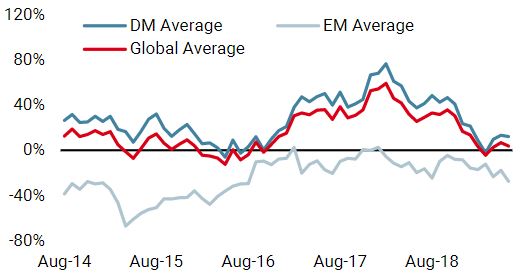
World Growth Nowcaster
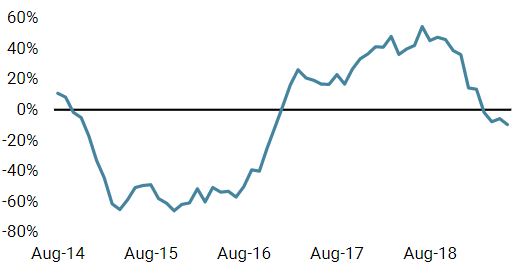
World Inflation Nowcaster
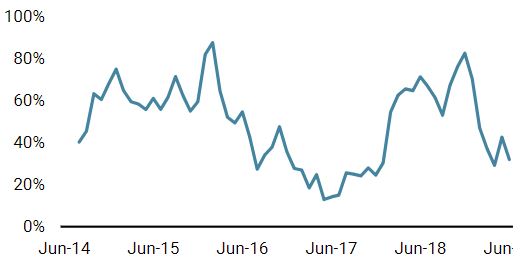
Market Stress Nowcaster
Weekly Change
- Our world Growth Nowcaster was steady over the week, with a slight improvement in developed economies offset by weakness in the emerging world.
- Our world Inflation Nowcaster was also steady this week, as most countries did not see material changes to inflationary pressures.
- Market stress moved down further, as spreads became more supportive.
Sources: Unigestion. Bloomberg, as of 24 June 2019.
Important Information Past performance is no guide to the future, the value of investments can fall as well as rise, there is no guarantee that your initial investment will be returned. This document has been prepared for your information only and must not be distributed, published, reproduced or disclosed by recipients to any other person. This is a promotional statement of our investment philosophy and services only in relation to the subject matter of this presentation. It constitutes neither investment advice nor recommendation. This document represents no offer, solicitation or suggestion of suitability to subscribe in the investment vehicles it refers to. Please contact your professional adviser/consultant before making an investment decision. Where possible we aim to disclose the material risks pertinent to this document, and as such these should be noted on the individual document pages. Please contact Unigestion for a complete list of all the applicable risks. Some of the investment strategies described or alluded to herein may be construed as high risk and not readily realisable investments, which may experience substantial and sudden losses including total loss of investment. These are not suitable for all types of investors. To the extent that this report contains statements about the future, such statements are forward-looking and subject to a number of risks and uncertainties, including, but not limited to, the impact of competitive products, market acceptance risks and other risks. As such, forward looking statements should not be relied upon for future returns. Data and graphical information herein are for information only and may have been derived from third party sources. Unigestion takes reasonable steps to verify, but does not guarantee, the accuracy and completeness of this information. As a result, no representation or warranty, expressed or implied, is or will be made by Unigestion in this respect and no responsibility or liability is or will be accepted. All information provided here is subject to change without notice. It should only be considered current as of the date of publication without regard to the date on which you may access the information. Rates of exchange may cause the value of investments to go up or down. An investment with Unigestion, like all investments, contains risks, including total loss for the investor. This information is issued by Unigestion (UK) Ltd (“Unigestion”), which is authorised and regulated by the UK Financial Conduct Authority (“FCA”). Unigestion is also registered as an investment adviser with the U.S. Securities and Exchange Commission (“SEC”). This information is intended only for professional clients, institutional clients and eligible counterparties, as defined by the FCA, and qualified purchasers as defined by the SEC and has therefore not been adapted to retail clients. Unigestion Multi Asset Risk-Targeted (USD): 31 December 2014 to 31 December 2018 1: This year is incomplete. Special Disclosure: For presentations prior to 31.03.2018 the strategy was measured against the LIBOR 3M USD + 4%. Beginning April 2018 the firm determined that the benchmark did not accurately reflect the strategy mandate and the benchmark was removed. Definition of the Firm: For the purposes of applying the GIPS Standards, the firm is defined as Unigestion. Unigestion is responsible for managing assets on the behalf of institutional investors. Unigestion invests in several strategies for institutional clients: Equities, Hedge Funds, Private Assets and the solutions designed for the clients of our Cross Asset Solution department. The GIPS firm definition excludes the Fixed Income Strategy Funds, which started in January 2001 and closed in April 2008, and the accounts managed for private clients. Unigestion defines the private clients as High Net Worth Families and Individual investors. Policies: Unigestion policies for valuing portfolios, calculating performance, and preparing compliant presentations are available upon request. Composite Description: The Multi Risk Targeted (Medium) composite was defined on 15 December 2014. It consists of accounts which aim to deliver consistent smooth returns of cash + 5% gross of fees across all market conditions over a 3-year rolling period. It seeks to achieve this by capturing the upside during bull markets while protecting capital during market downturns. Benchmark: Because the composites strategy is absolute return and investments are permitted in all asset classes, no benchmark can reflect this strategy accurately. Fees: Returns are presented gross of management fees, administrative fees but net of all trading costs and withholding taxes. The maximum management fee schedule is 1.2% per annum. Net returns are net of model fees and are derived by deducting the highest applicable fee rate in effect for the respective time period from the gross returns each month. List of Composites: A list of all composite descriptions is available upon request. Minimum Account Size: The minimum account size for this composite is 5’000’000.- USD. Valuation: Valuations are computed in US dollars (USD). Performance results are reported in US dollars (USD). Internal Dispersion & 3YR Standard Deviation: The annual composite dispersion presented is an asset-weighted standard deviation calculated for the accounts in the composite the entire year. When internal dispersion is not presented it is as a result of an insufficient number of portfolios in the composite for the entire year. When the 3 Year Standard Deviation is not presented it is as a result of an insufficient period of time. Compliance Statement Unigestion claims compliance with the Global Investment Performance Standards(GIPS®) and has prepared and presented this report in compliance with the GIPS standards. Unigestion has been independently verified for the periods 1 January 2003 to 31 December 2016. The verification report(s) is/are available upon request. Verification assesses whether (1) the firm has complied with all the composite construction requirements of the GIPS standards on a firm-wide basis and(2) the firms policies and procedures are designed to calculate and present performance in compliance with the GIPS standards. Verification does not ensure the accuracy of any specific composite presentation.
Year
Composite
Return Gross
of FeesComposite Net Return
Benchmark Return
Number of Accounts
Internal Dispersion
Composite 3-Yr Std Dev
Benchmark 3-Yr Std Dev
Composite AUM (M)
Firm
AUM (M)
2015
-1.61%
-2.80%
–
1
–
–
–
127.24
15,550.31
2016
5.05%
3.79%
–
1
–
–
–
129.66
18,144.46
2017
11.16%
9.82%
–
1
–
–
–
169.51
22,340.80
2018
-2.91%
-4.08%
–
1
–
–
–
286.93
21,403.49
20191
5.06%
4.74%
–
1
–
–
–
278.23
23,204.71