MiViews Q4 2019: Let’s Agree To Disagree For Now
- The macro situation is not as bad as many think. We do not foresee a global recession in the next six months and therefore disagree with the recession signals implicit in negative yield curves.
- Thanks to muted inflation, central bank action is increasingly on the side of investors. We see this as a net positive for carry-related assets.
- We think sentiment is overly pessimistic. Investors are under-invested and over-hedged. If the macro situation improves, a rapid reversal in sentiment is a risk as bonds are currently very expensive.
Overview
We allocate risk dynamically by monitoring the three key factors that drive asset returns over the medium term: 1) macroeconomic factors (economic cycle and inflation), 2) market sentiment and 3) valuation. Recently, markets have shown concerns about the macro side of this equation: many yield curves are flat or inverted, a traditional sign that a recession is coming. Our macro indicators disagree with this view, showing that the world is growing in line with potential. We think that inflation is the greater concern when it comes to adapting portfolios to the current environment. Inflation pressures are nowhere to be found and that puzzles many central banks. We expect to enjoy their support for some time to come, giving us confidence that there is still some value in credit and equities. When looking at market sentiment, we see significant signs of pessimism, both in terms of allocation and hedging demand. Lastly, we see bonds as being more of a valuation risk than equities or credit. In short, we disagree with broad market pessimism and expect a change in sentiment in the coming quarter.
Global Recession Risk Is Limited, Inflation Is Low
Investors are concerned about the macro situation in light of various indicators that, in aggregate, are increasingly pointing towards further economic deceleration. 12 months ago, when growth conditions were strong, a deceleration would have meant only a limited increase in the risk of recession. However, today’s situation is very different as economic conditions are much worse.
Worrying signals are appearing across the spectrum of macro data but most are coming from the industrial side of the economy:
- The US ISM manufacturing index fell from 60.8, its peak in August 2018 to 47.8 in September. A similar deterioration occurred in 2015-2016, although a recession did not follow. New orders, the most forward-looking component of this purchasing manager survey, recently hit 2015 lows, painting a particularly gloomy picture.
- The US capacity utilisation rate peaked in October 2018 but has fallen almost continuously since then, something that the Fed would have been keenly aware of and another sign of a deteriorating macro situation in the US.
- In Germany, the IFO survey, a leading indicator of the German cycle, already places the German economy in a recession with the GDP contraction in Q2 set to continue.
- The European Commission survey paints a similar picture in Finland, which is also likely to experience a recession, alongside Belgium and Sweden. The same survey also places the UK in a difficult situation.
- Similar indications can be found in the emerging world. The growth rate of Chinese electricity production is close to 2015 levels. The GDP of South Africa has been negative for three of the past six quarters, with a severe -3.2% contraction in Q1. The CPB world trade index has declined by 3% in a year. Finally, analysts expect an earnings contraction this year across the emerging world.
In light of these indications, investors are anticipating a recession in the coming months, as clearly highlighted by the current shape of sovereign bond yield curves. Across many developed economies, yield curves are now flat to inverted. Figure 1 makes this point very clear: yields on most G10 sovereigns are converging towards where the Japanese curve has been for a long time now. The New York Fed computes a recession probability out of the level of the US yield curve, currently at 37%, up from 31% in August. It is significant and rising.
Figure 1: Yield Curve Slopes (10-year Minus 2-year) Across the G10 World
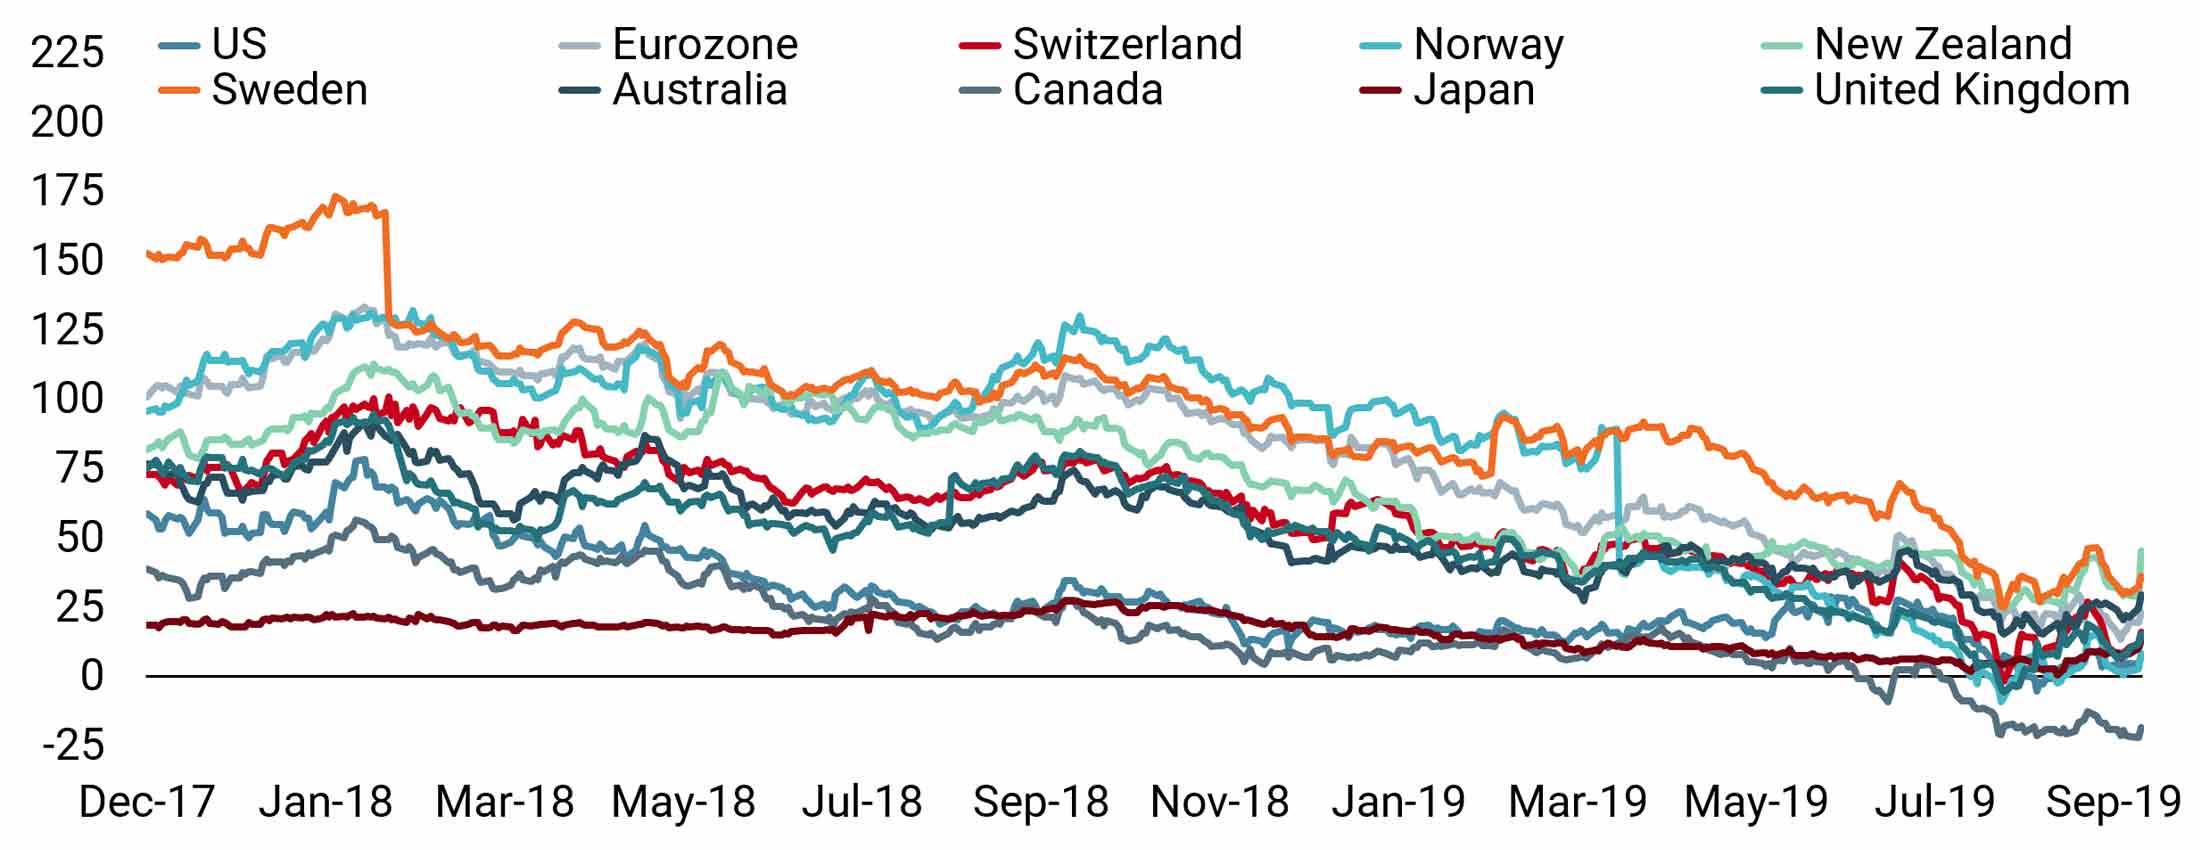
There is no place to hide, or so it seems. The signs are clear and a world recession looks increasingly likely. But is that really the case?
When taking stock of a broader range of data, we reach a very different conclusion. Our proprietary Growth Nowcasters are economic indicators that track recession risk on a daily basis. These indicators cover a wide range of economic dimensions including consumption, investment, production expectations, housing and external trade situations for 90% of the world’s GDP. The aim is to exploit what we know best about recessions: they affect a broad spectrum of economic dimensions within and across a large number of economies. This has been the case since the end of World War II and our indicators have been calibrated to exploit precisely this fact.
What are the Nowcasters telling us? As already detailed in a previous publication, and as clearly presented in Figure 2, our world Growth Nowcaster is currently hovering around the zero line. This indicates that the world is growing in line with its potential, i.e. its natural pace of growth – around 3.5%, according to the IMF.
Figure 2: World Growth Nowcaster vs. Recession Threshold
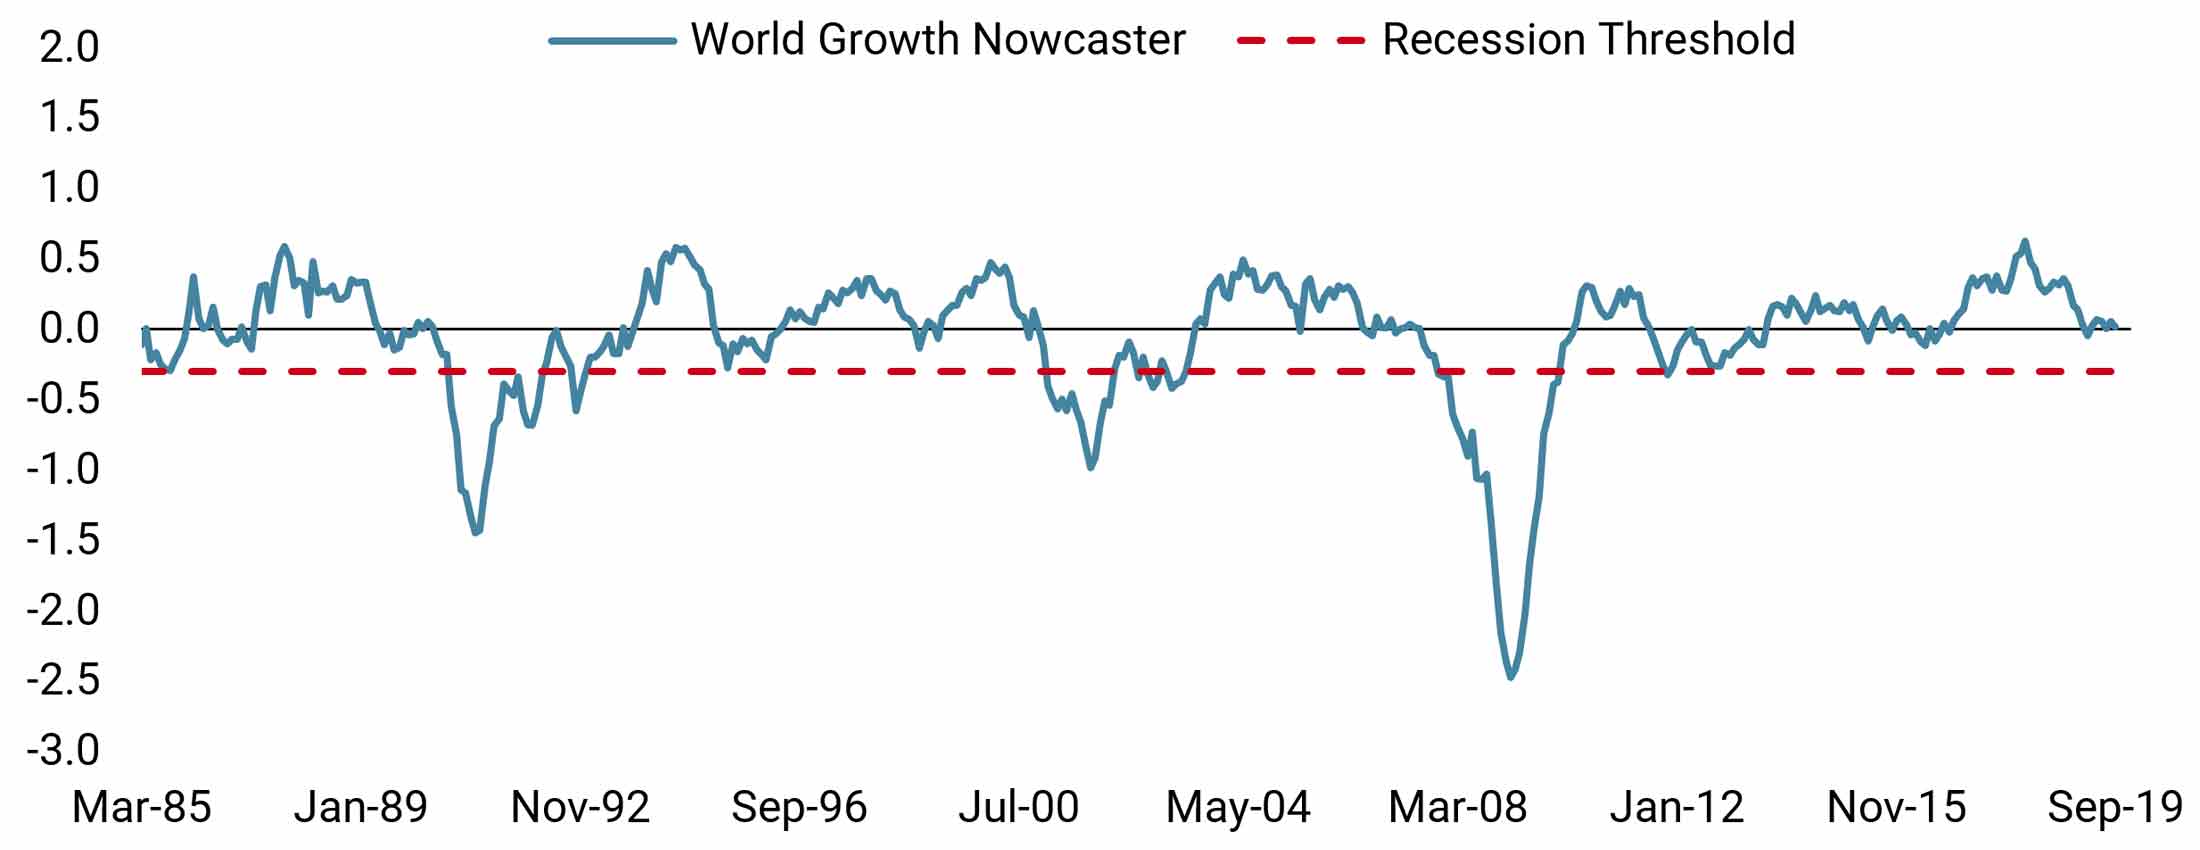
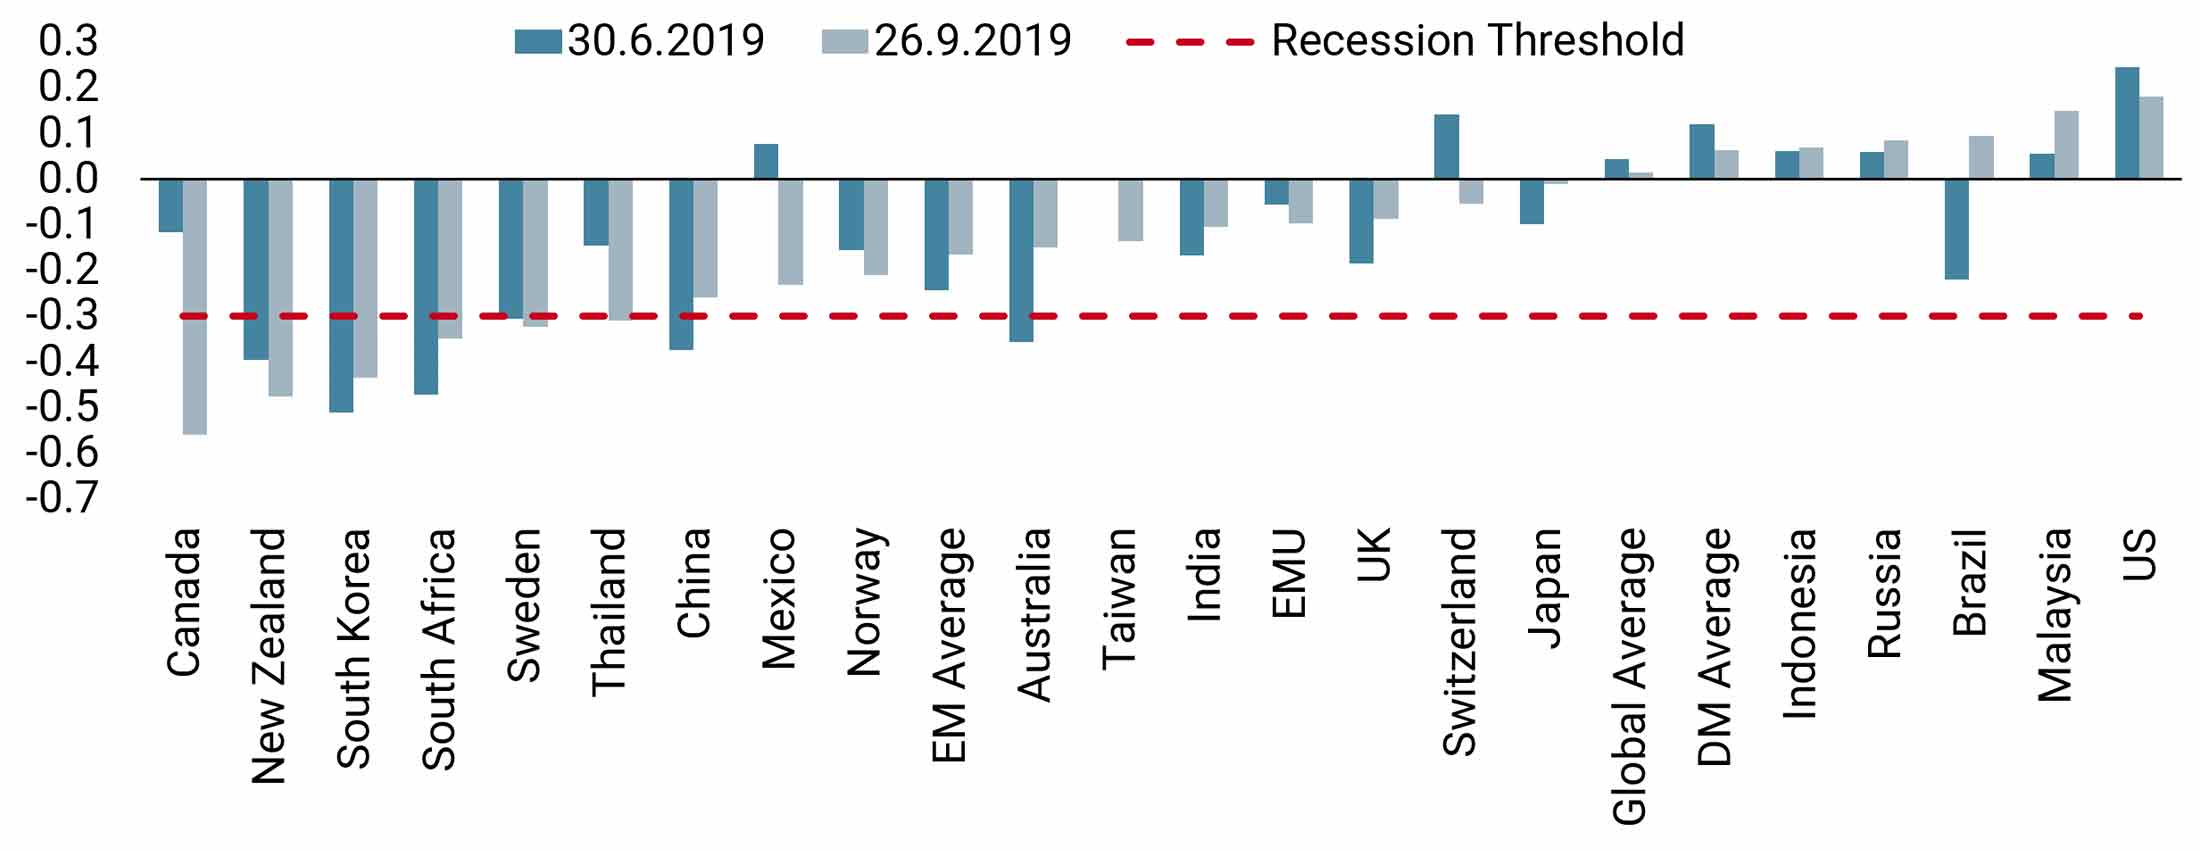
We can conclude from Figure 2 that the world still stands some way from crossing the recession threshold, thanks largely to US economic strength. Second quarter US GDP was 2%, slightly higher than the country’s potential growth. However, the issue is that many other countries are lagging the US. Figure 3 shows that current economic conditions are uneven. The weakest countries, according to our regional Growth Nowcasters, are Canada, New Zealand, South Korea, South Africa, Sweden and Thailand. In the other economies, the situation seems in hand with respective regional Growth Nowcaster levels sitting around zero. In addition, some signs of improvement in the macro backdrop are visible compared to the past quarter. In the emerging world, the situation has marginally improved for India, Indonesia, Brazil and Russia.
Figure 3: Regional Growth Nowcasters
We currently see three reasons for expecting macroeconomic improvement:
- World trade indices have fallen sharply since the start of the trade war but many have now stabilised, if not recovered. For example, the Baltic dry index rose by 200% recently, a positive sign for slow‑growing emerging economies, whose growth prospects depend on it.
- Most of the deterioration that we observe across our indicators concerns production expectation survey data, which shows a strong sensitivity to the vagaries of trade war rhetoric. Should this situation improve, the data from many of these surveys would strengthen again.
- Third, both the ECB and the People’s Bank of China (PBoC) seem to be well aware of the increasing risk of a slowdown. The ECB has unleashed a new QE plan, the PBoC has cut its required reserve ratio and the Chinese government continues to implement economic stimulus measures. Both economies should enjoy some support across the fourth quarter of this year.
Low Inflation Means Continued Central Bank Support
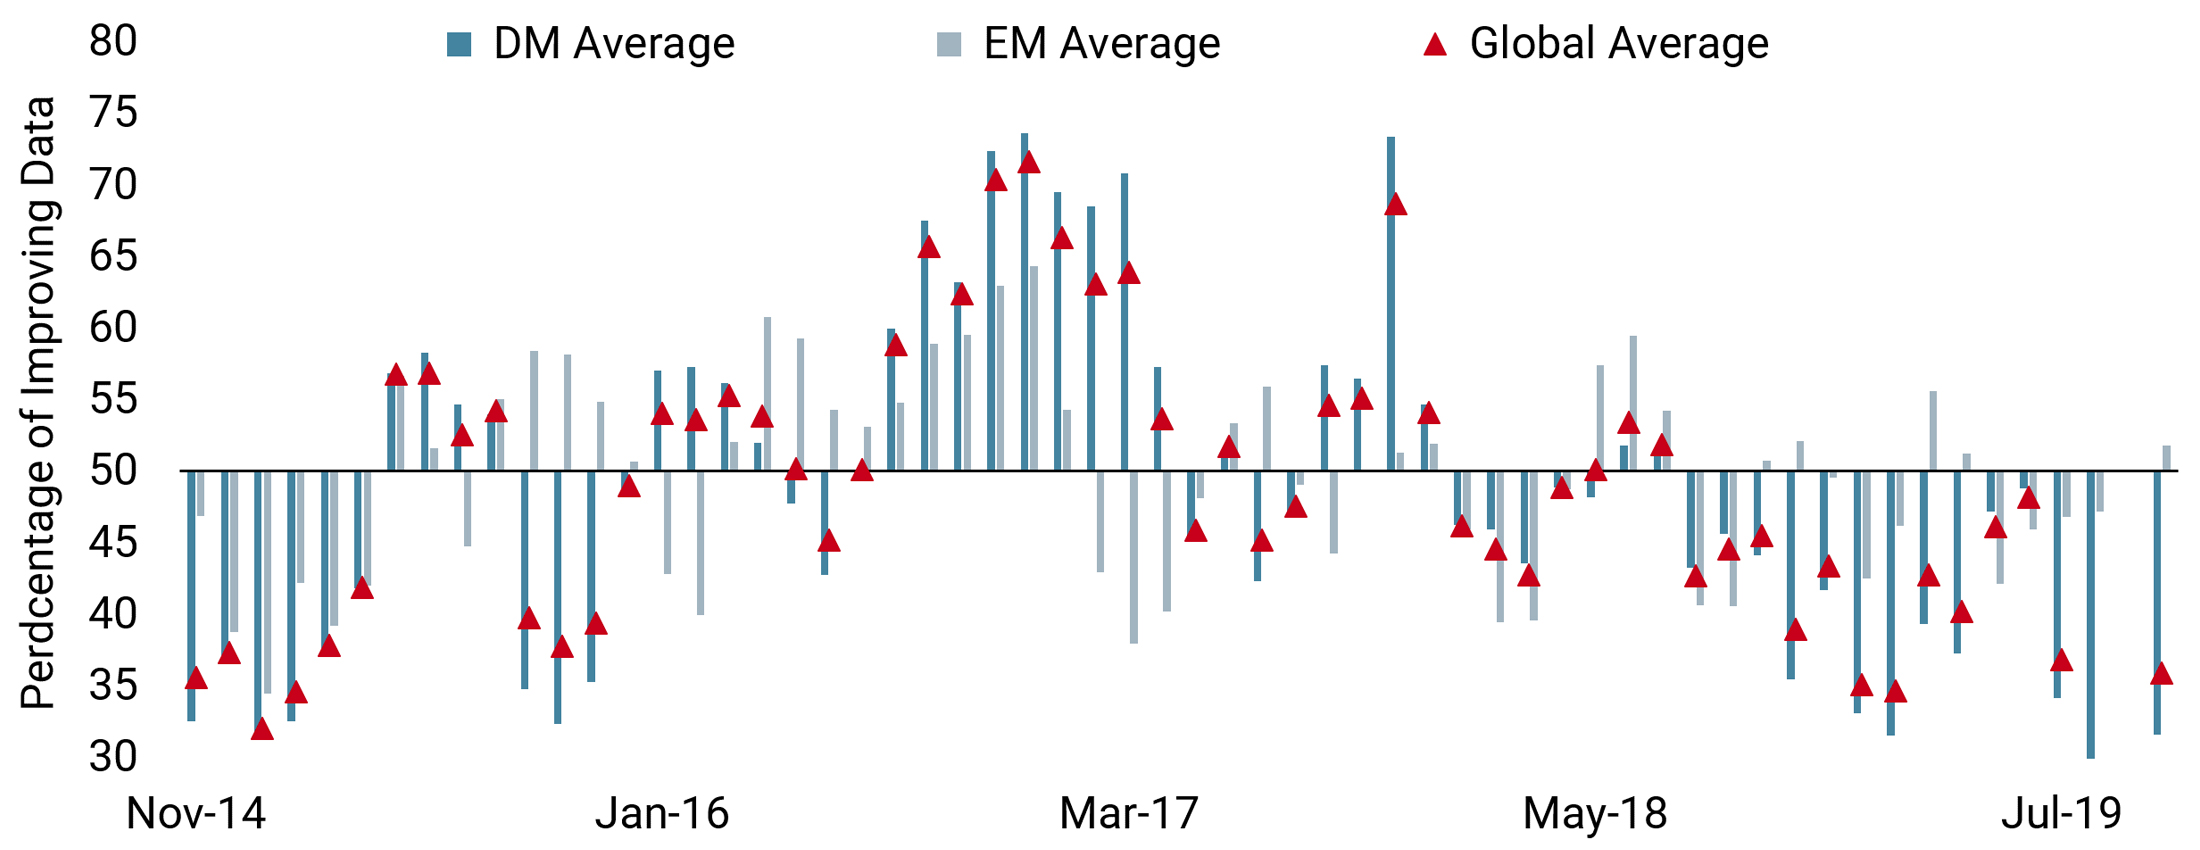
The inflation situation is a key part of our current macro assessment. As highlighted by the ECB and more recently by the Fed, inflation has disappointed recently and inflation forecasts have declined steadily since November 2018. In the US, 2020 inflation forecasts were revised from 2.3% to 2% (source Bloomberg), while in the Eurozone, they fell from 1.7% to 1.3%. Our Inflation Nowcasters, which assess the risk of inflation surprise, show a similar trend, having declined consistently since the summer of 2018. Recently, this trend has accelerated, as presented in Figure 4. The collapse in our indicator is more visible in the top chart. When negative, this indicator predicts a negative risk of inflation surprise. The bottom chart shows an even more worrying picture for the inflation outlook. The diffusion index (the percentage of improving data in our Inflation Nowcaster) has recently reached a very low level. About 30% of all inflation data is improving, meaning that 70% of it is deteriorating. Globally, all sources of inflation are pointing more or less in the same direction, and especially so in the US. We think this is a key element of the current macro picture: inflation is nowhere to be found, meaning that central banks are likely to remain on the dovish side, offering welcome support to financial markets.
Figure 4: Inflation Nowcasters (Top) and Diffusion Index (Bottom)

To summarise our macro outlook, we see a lower risk of recession than the market. Central bank action should remain a positive for investors as inflation continues to disappoint, prompting dovish monetary policy that supports growth-related assets.
Investors are Overly Cautious
The second element in our outlook concerns market sentiment. Given the supportive macro picture outlined above, one might expect market participants to be positioned to profit from the continuation of this protracted growth cycle. However, across the various metrics that we look at, we see a number of indications that investors are defensively positioned.
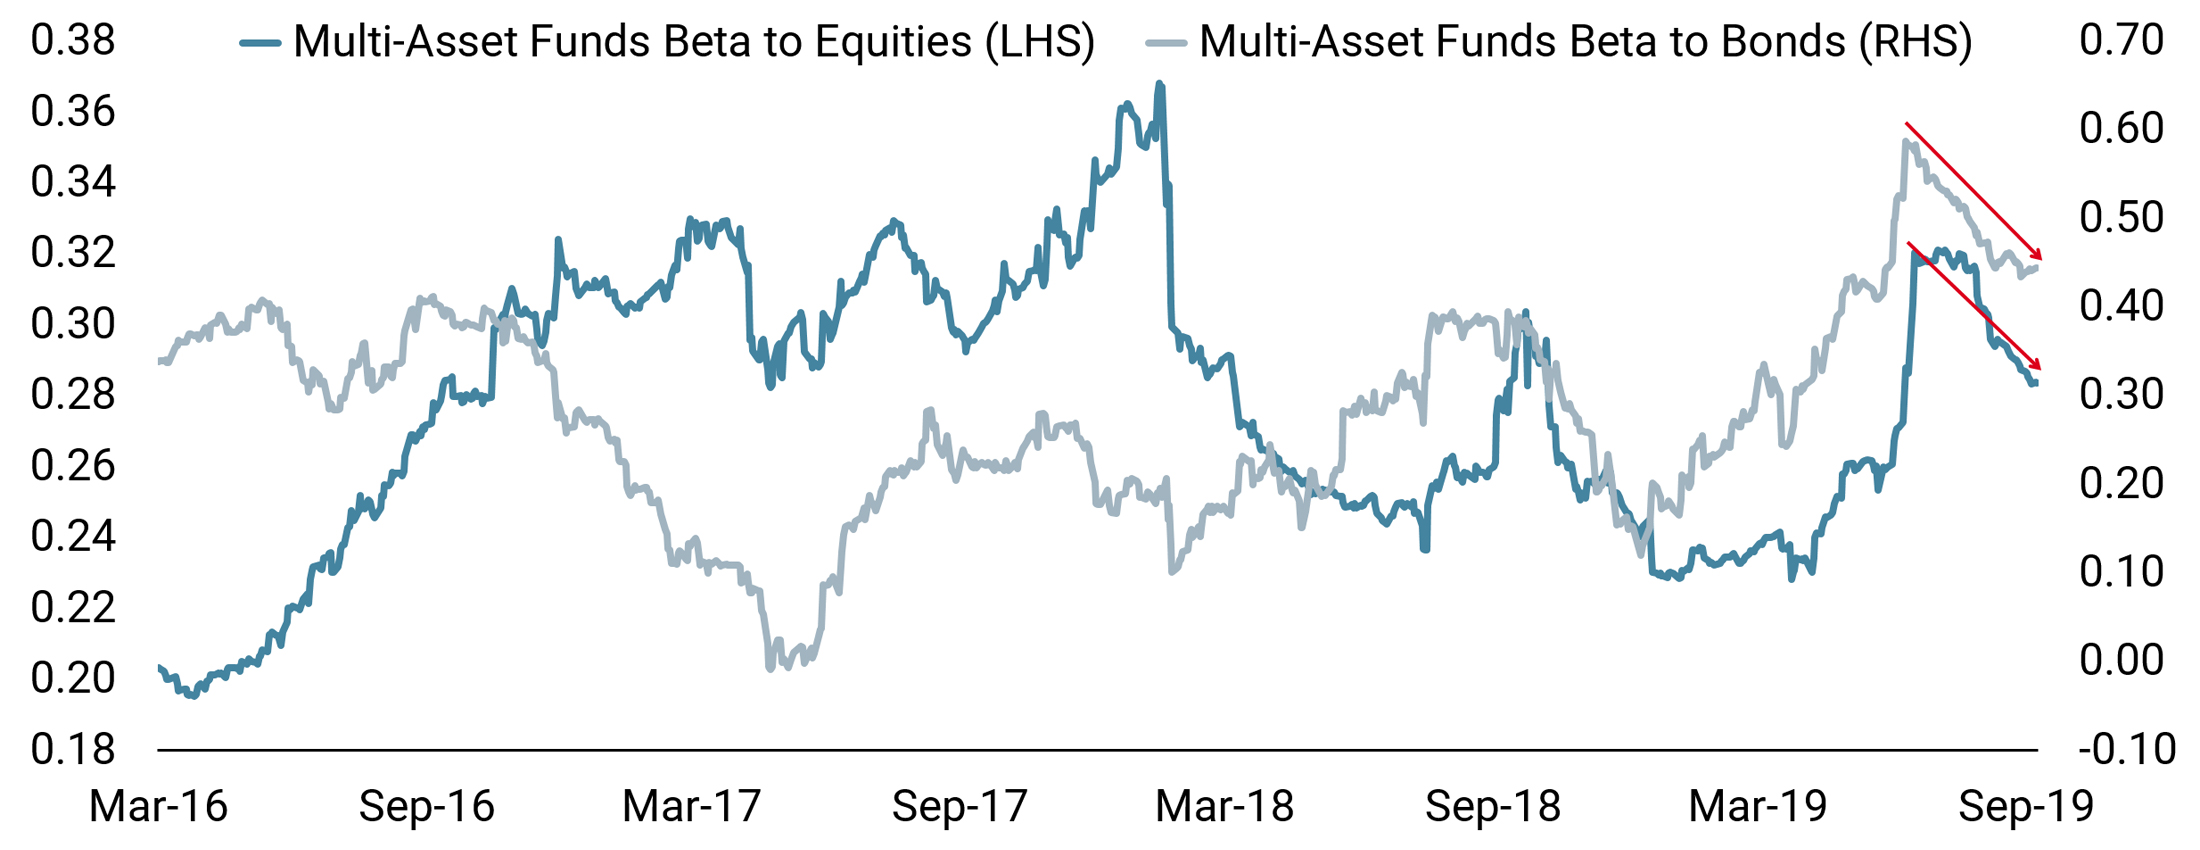
We can see this through two key elements. First, when looking at the historical beta of a representative group of multi asset funds to bonds and equities, a clear trend appears. Multi asset funds have significantly reduced their exposures to both asset classes since June 2019. The situation is similar when looking at the beta of different types of hedge fund strategies, from global macro to long-short equities. Given the performance of global markets from January to June, is this a sign that many investors have been taking profits? From December 2018 to June 2019, a balanced multi asset portfolio returned 10% USD with an annualised volatility of 5% – a clear historical anomaly. However, factoring in the negative performance of markets in late 2018 yields a different conclusion. Since August 2018, realised equity performance has returned close to 0% while bonds have returned 7%, yielding a Sharpe ratio in USD of nearly 0.5, which is the long-run Sharpe ratio of traditional assets. In our view, the 12-month rolling performance of markets is not an anomaly.
Figure 5: Multi Asset Fund Beta to Equities and Bonds
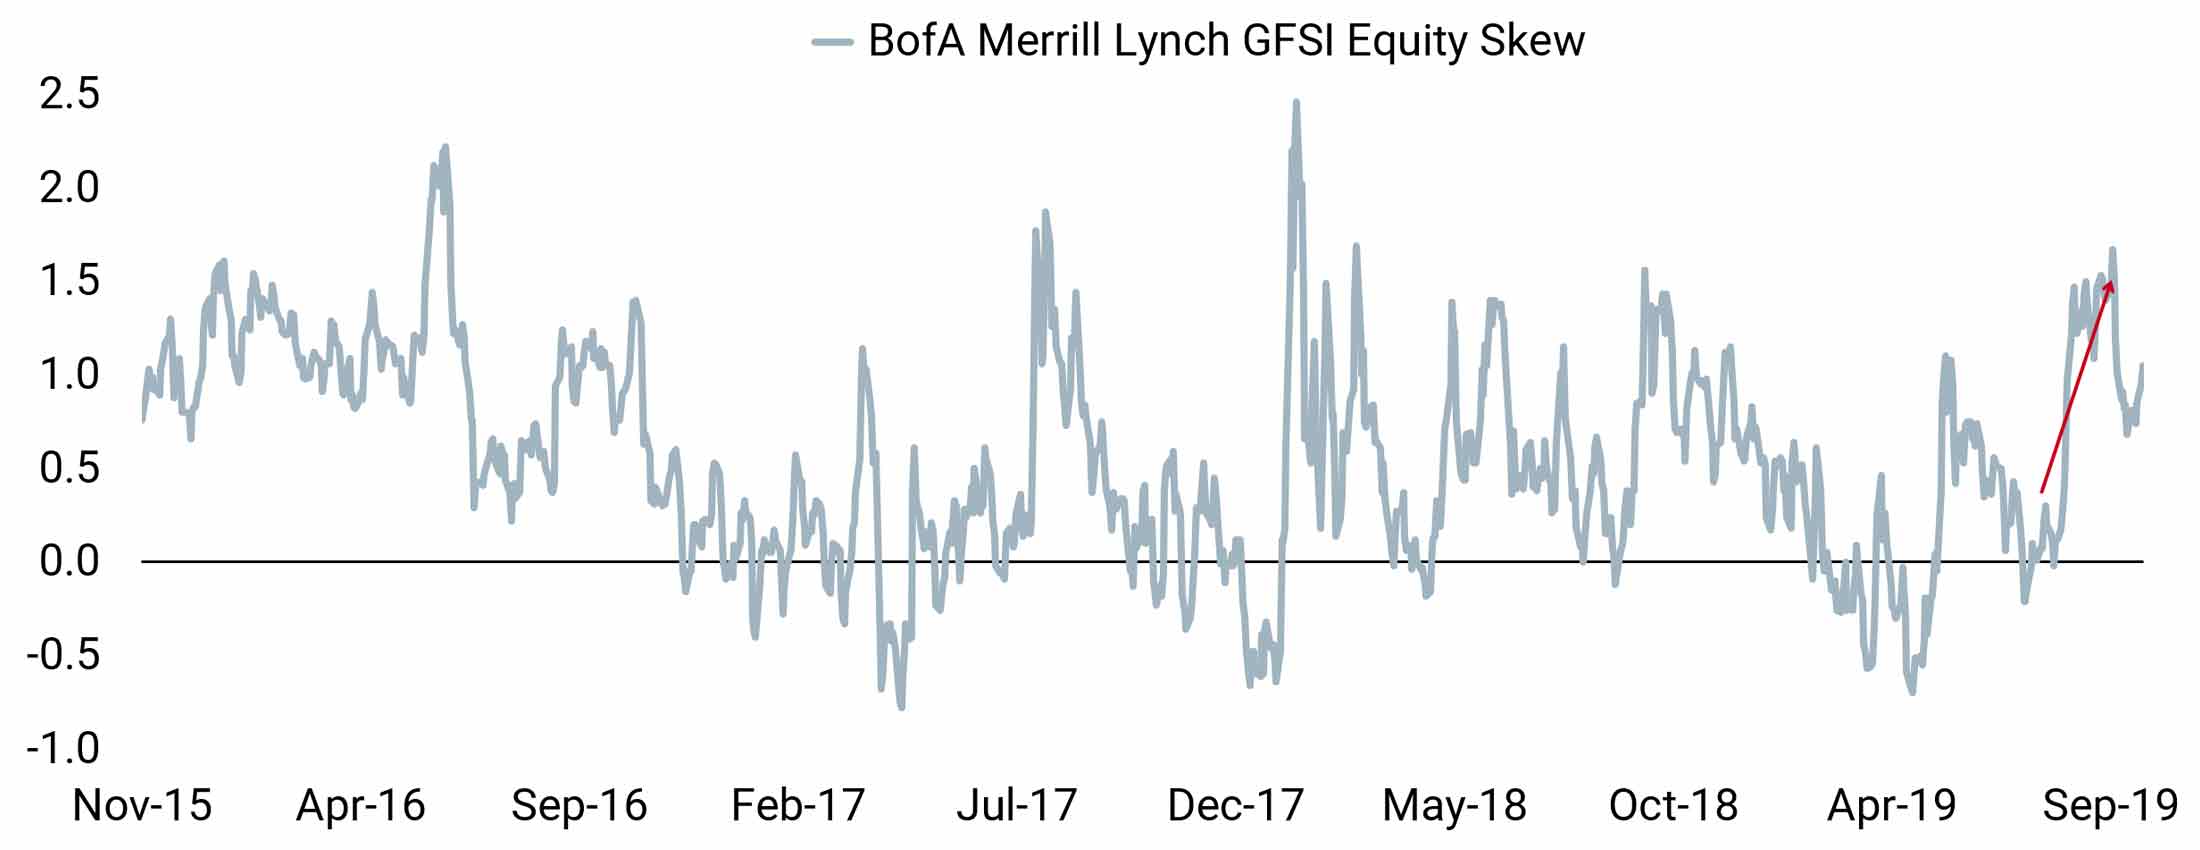
A natural way to assess how cautiously investors are positioned today is to look at the cost of hedging against a market downturn. Figure 6 shows changes in equity and forex market skew, a measure of demand for downside hedging versus upside hedging. Demand for downside risk hedging has increased sharply as multi asset funds have reduced their exposures (see Figure 5). Investors have therefore significantly increased hedging levels recently, a clear sign of pessimism. When faced with this higher cost of hedging against downside risk, we think that the forex market can provide some interesting alternatives to protect against a global downturn in growth assets.
Figure 6: Equity Option Market Skew
Investors have recently been taking profits, but high levels of downside hedging also reveal a pessimism that we do not share for now. We see this pessimism as pointing to a possible upside squeeze, and we think that, over the next quarter, markets are set to reappraise their views on the macro situation.
Valuations are High but Uneven
Finally, we think market valuations deliver an interesting message. Figure 7 shows our cross-asset valuation metrics based on each asset class’s carry and highlights a need for caution. First, hedging assets are expensive. Bonds are currently the most expensive of all, far more than inflation linkers, industrial or precious metals. From this valuation angle, investors are poorly prepared for a valuation recovery that would see bonds significantly cheapen. Conversely, many growth-related risk premia such as credit, emerging equities and energy look cheap. Within a score range of -2 (very expensive) to +2 (very cheap), investment grade currently scores +0.92 and energy, +0.54, despite delivering strong returns this year so far.
We also expect the fourth quarter to mark the beginning of greater discrimination within geographic equity indices, in light of valuation disparities. When looking at a wide range of valuation metrics turned into percentiles, including value-to-sales, price-to-book or price-to-free-cash-flow ratios, clear differences can be seen. The only index that is expensive by all measures is the S&P 500 while the TOPIX is the only index that is cheap by all measures. In between both, indices span a broad range of expensiveness: European equities are not the cheapest while emerging assets are far from expensive. If the macro situation improves, the laggards of 2019 will likely benefit from greater market attention. Historically, when emerging markets reach current valuation levels, ensuing 1- to 6-month returns have been positive at about 1% per month. It is the same with the MSCI World index: at current valuation levels (and in spite of dominant US representation), history shows that it could return around 3% (on average) in the forthcoming quarter. From these numbers, we expect global equities to deliver a positive performance in the fourth quarter, addressing the imbalance between US and other equity indices.
Figure 7: Unigestion Cross-asset Valuation Scoring
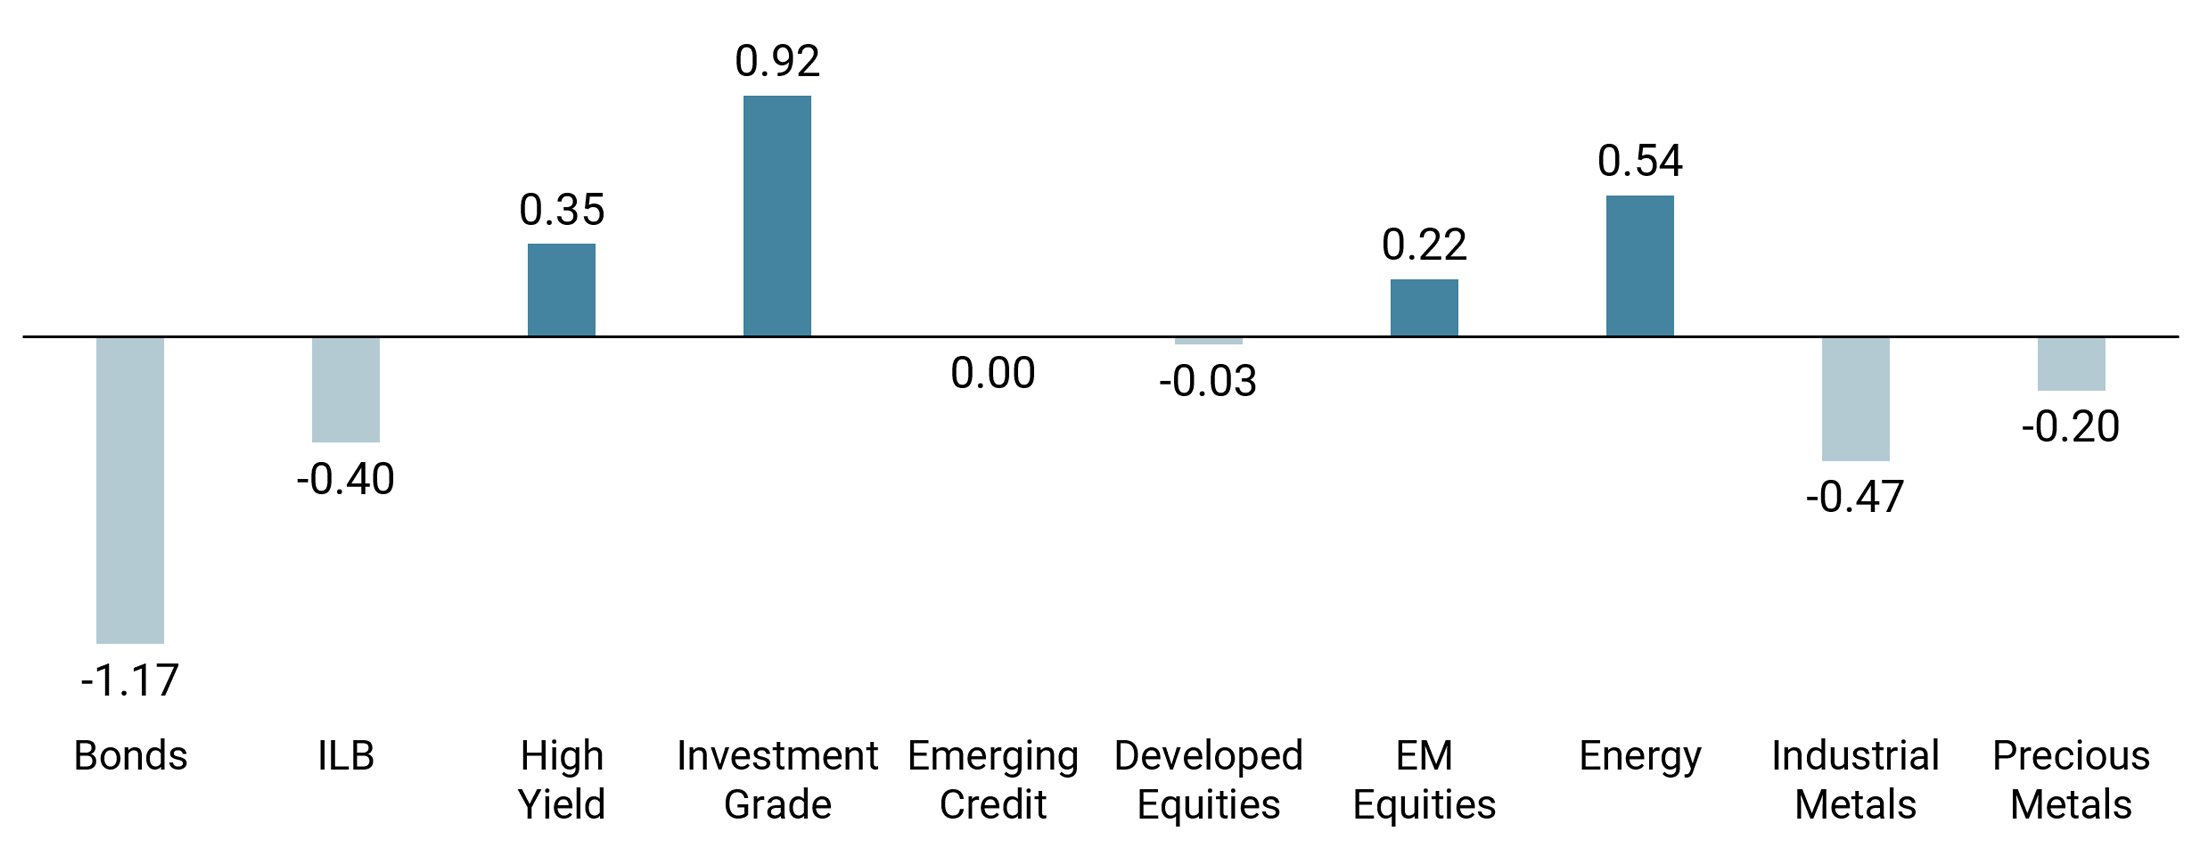
Reading note: a positive (negative) scoring implies the asset is cheap (expensive). The scores are obtained using the carry of each asset relative to the other assets and its own history.
Our Process Leads Us To Disagree With Markets
Our dynamic allocation framework reveals an alignment of planets. Global growth remains satisfactory and far from recession territory, while inflation continues to prompt significant support from central banks. In light of this, sentiment is overly bearish in our view, creating a risk of a rapid pivot in markets similar to what we saw in the first half of September. Finally, we think markets are not sufficiently aware of current valuation risks. Bonds and other hedging asset valuations are looking stretched, while selected growth assets remain fairly priced.
Our allocation for the fourth quarter therefore reflects a more positive view than most: we disagree with the current prevailing pessimism and hold overweights in growth assets. We have held this positioning since early September and currently see no reason to change it as things stand. We also expect the support of central banks to be positive for carry-yielding assets and strategies.
However, we are keenly aware of risks in the form of further deterioration in the trade war, an unexpectedly bad outcome in the Brexit situation or a significant deterioration in macro newsflow. We therefore continue to look for hedging opportunities, especially in the forex market, and we use various crosses and strategies to make up for the expensiveness created by the skew in equity options markets.
Important information
This document is provided to you on a confidential basis and must not be distributed, published, reproduced or disclosed, in whole or part, to any other person.
The information and data presented in this document may discuss general market activity or industry trends but is not intended to be relied upon as a forecast, research or investment advice. It is not a financial promotion and represents no offer, solicitation or recommendation of any kind, to invest in the strategies or in the investment vehicles it refers to. Some of the investment strategies described or alluded to herein may be construed as high risk and not readily realisable investments, which may experience substantial and sudden losses including total loss of investment.
The investment views, economic and market opinions or analysis expressed in this document present Unigestion’s judgement as at the date of publication without regard to the date on which you may access the information. There is no guarantee that these views and opinions expressed will be correct nor do they purport to be a complete description of the securities, markets and developments referred to in it. All information provided here is subject to change without notice. To the extent that this report contains statements about the future, such statements are forward-looking and subject to a number of risks and uncertainties, including, but not limited to, the impact of competitive products, market acceptance risks and other risks.
Data and graphical information herein are for information only and may have been derived from third party sources. Although we believe that the information obtained from public and third party sources to be reliable, we have not independently verified it and we therefore cannot guarantee its accuracy or completeness. As a result, no representation or warranty, expressed or implied, is or will be made by Unigestion in this respect and no responsibility or liability is or will be accepted. Unless otherwise stated, source is Unigestion. Past performance is not a guide to future performance. All investments contain risks, including total loss for the investor.
Unigestion SA is authorised and regulated by the Swiss Financial Market Supervisory Authority (FINMA). Unigestion (UK) Ltd. is authorised and regulated by the UK Financial Conduct Authority (FCA) and is registered with the Securities and Exchange Commission (SEC). Unigestion Asset Management (France) S.A. is authorised and regulated by the French “Autorité des Marchés Financiers” (AMF). Unigestion Asset Management (Canada) Inc., with offices in Toronto and Montreal, is registered as a portfolio manager and/or exempt market dealer in nine provinces across Canada and also as an investment fund manager in Ontario and Quebec. Its principal regulator is the Ontario Securities Commission (OSC). Unigestion Asia Pte Limited is authorised and regulated by the Monetary Authority of Singapore (MAS). Unigestion Asset Management (Copenhagen) is co-regulated by the “Autorité des Marchés Financiers” (AMF) and the “ Danish Financial Supervisory Authority” (DFSA). Unigestion Asset Management (Düsseldorf) SA is co-regulated by the “Autorité des Marchés Financiers” (AMF) and the “Bundesanstalt für Finanzdienstleistungsaufsicht” (BAFIN).
Document issued: October 2019